
From data to visual work, in one prompt.
Checking today’s chat quota…
Featured examples

Circles of influence

Istanbul: a city history timeline
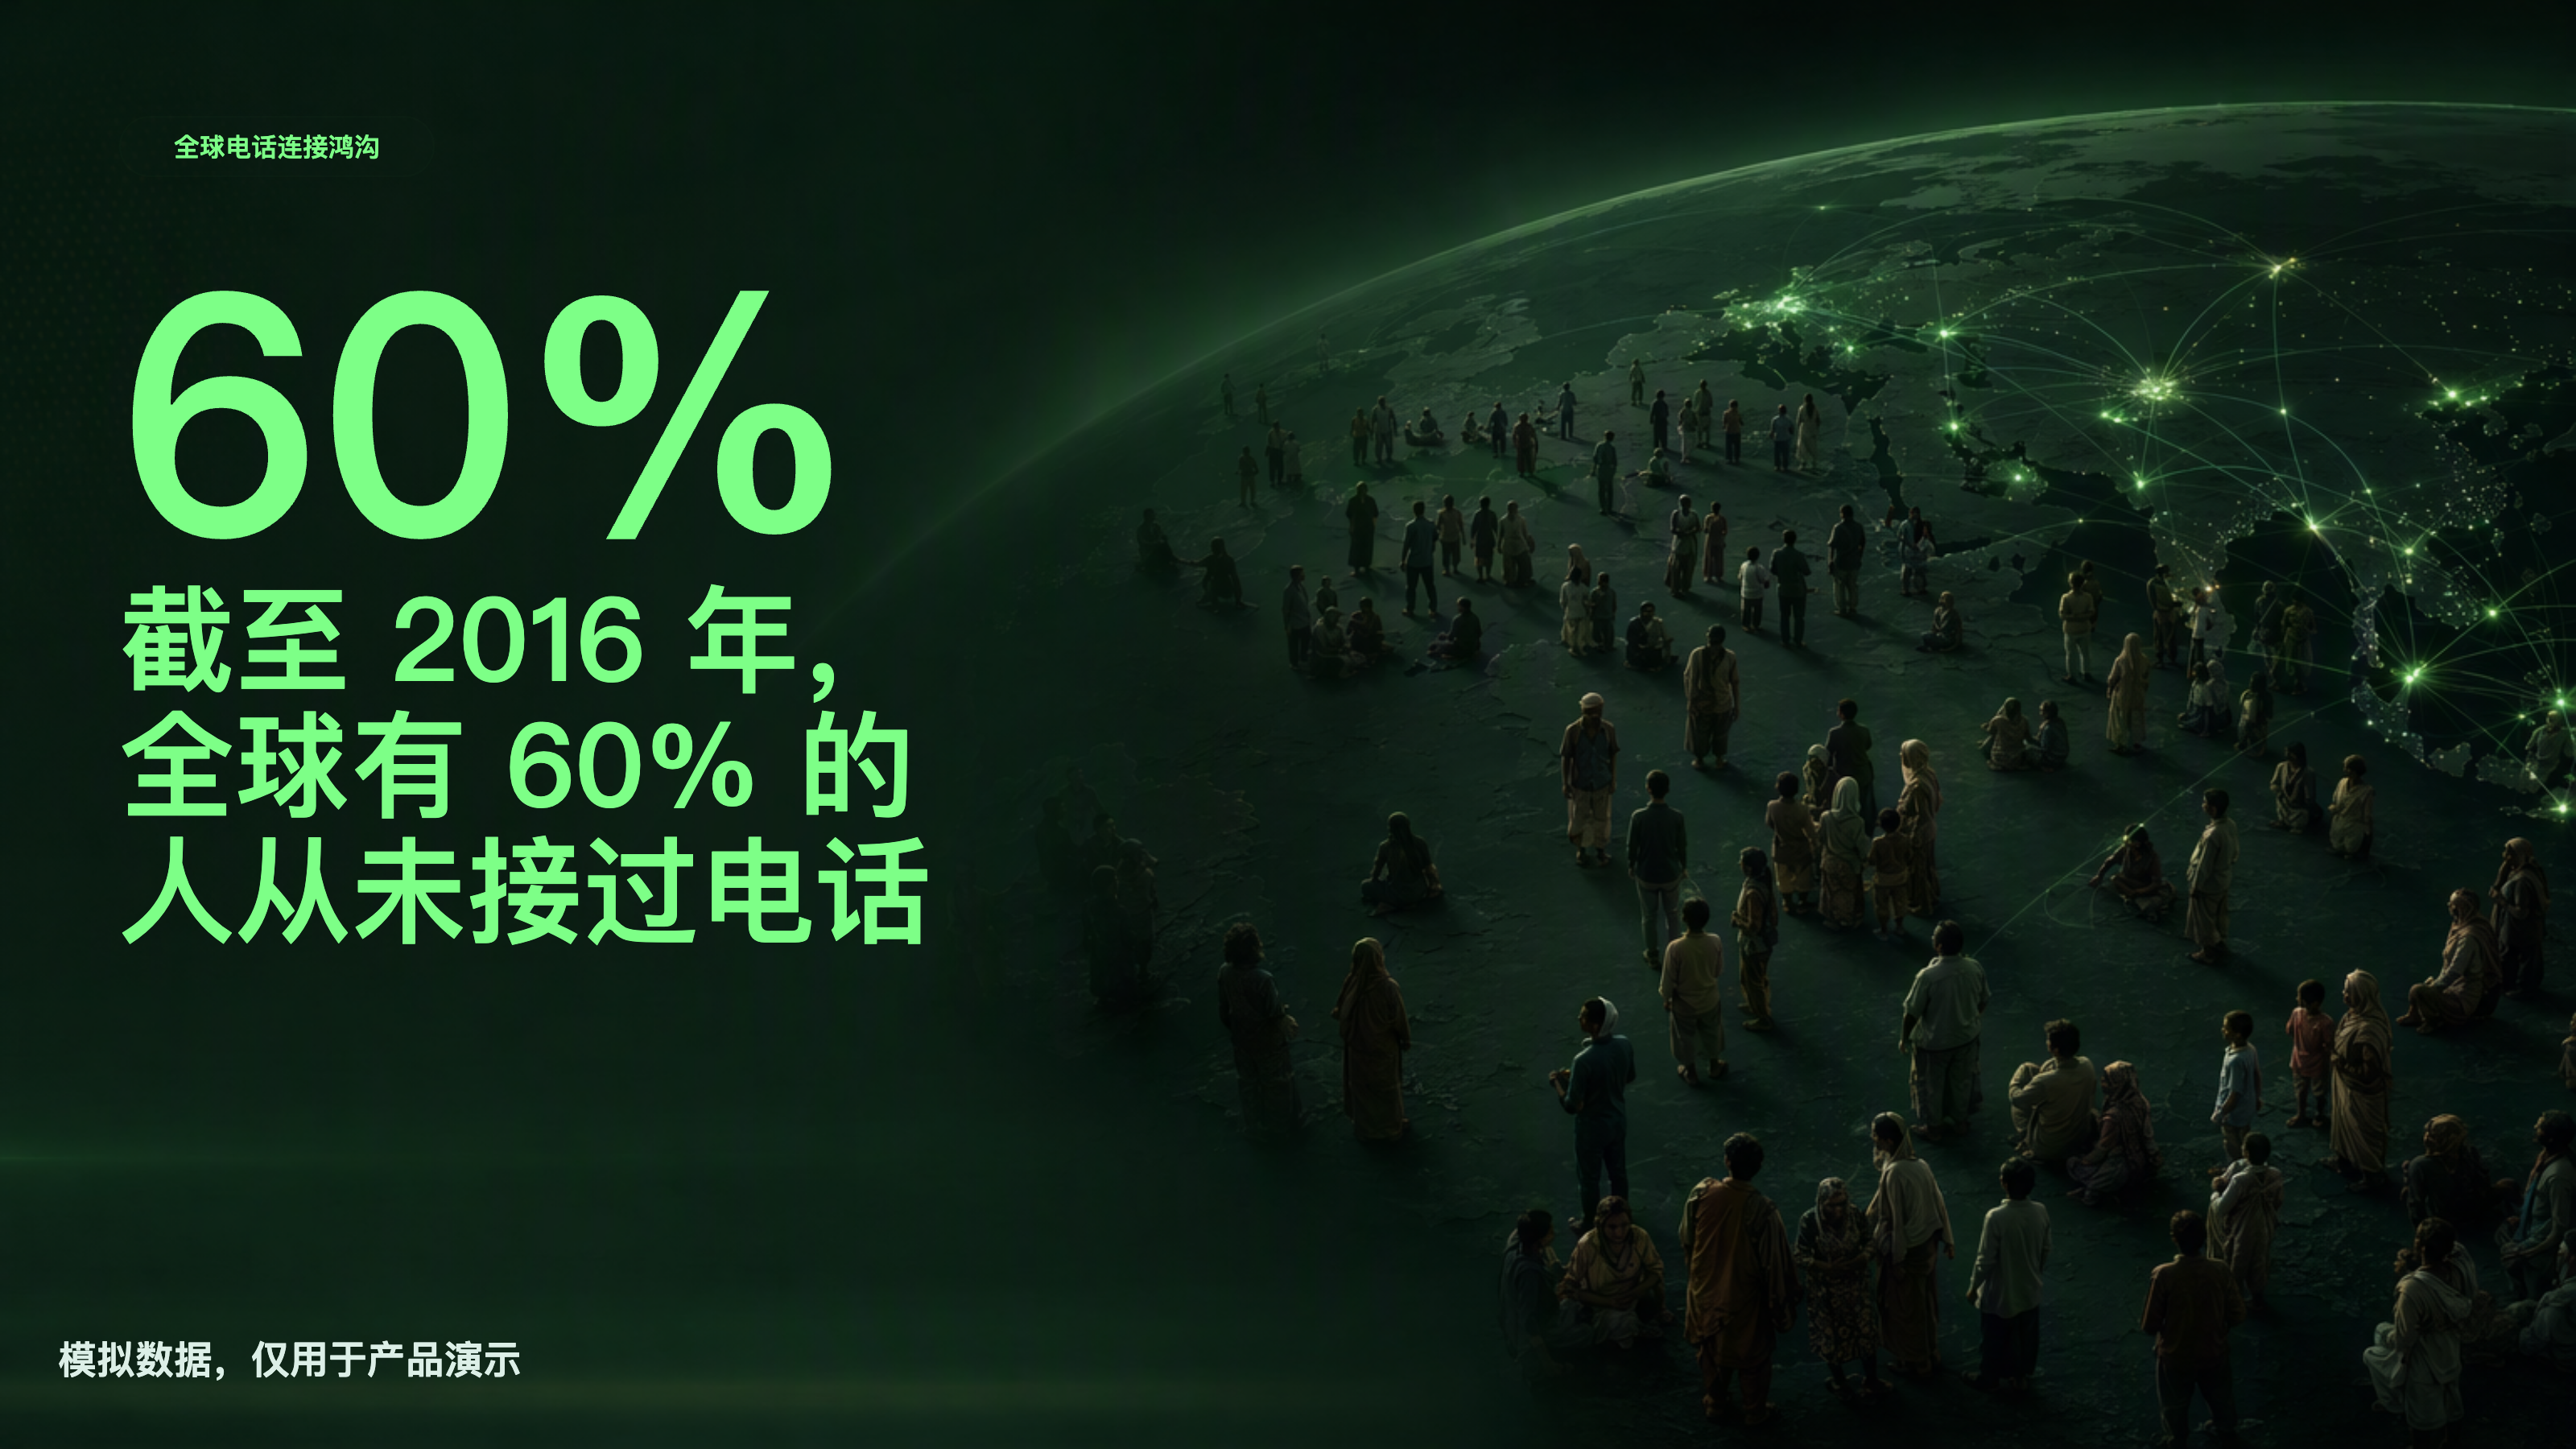
60% have never received a phone call

Li Bai and Du Fu: two poetic peaks

Customer journey: from awareness to advocacy

The iceberg principle: seen and hidden

The Shenzhen growth story

Where e-commerce growth turns

Who is responsible for global CO₂?

Las Vegas GP: blockbuster or spectacle?

What will drive the next stage of growth?

Double Eleven review: what comes after growth?

Metric change waterfall
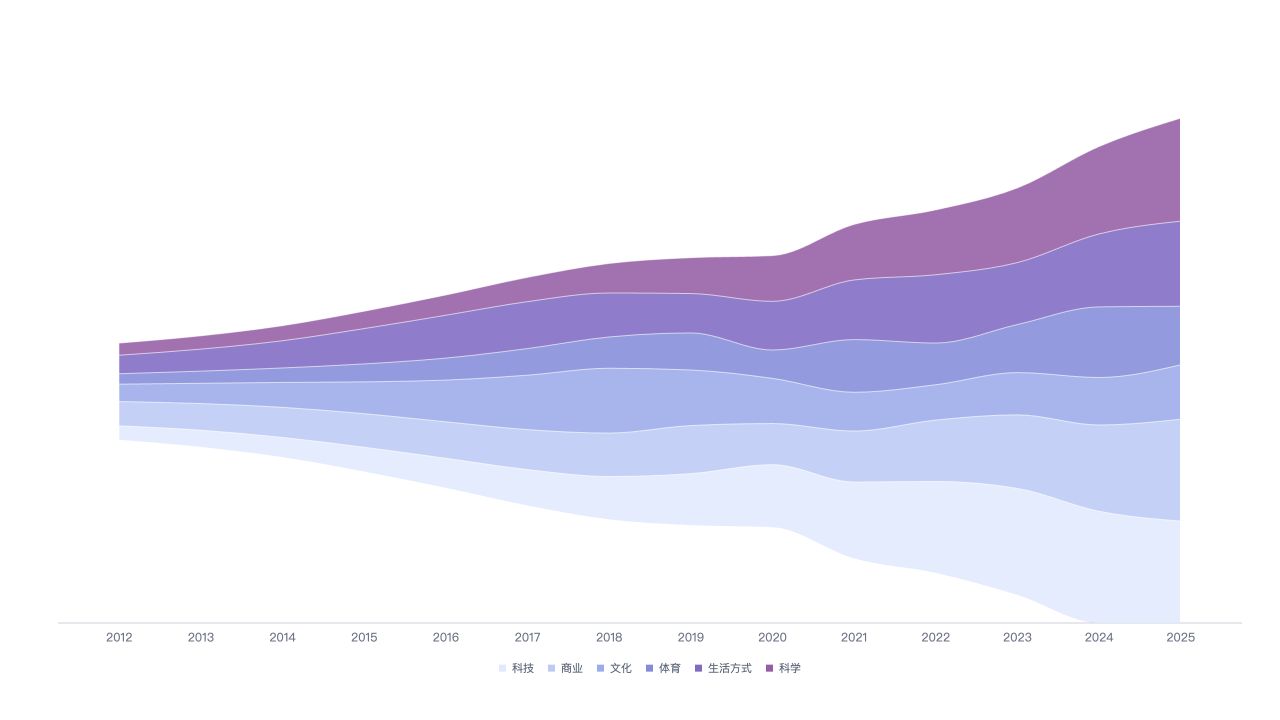
Content interest streamgraph

Power and efficiency scatter
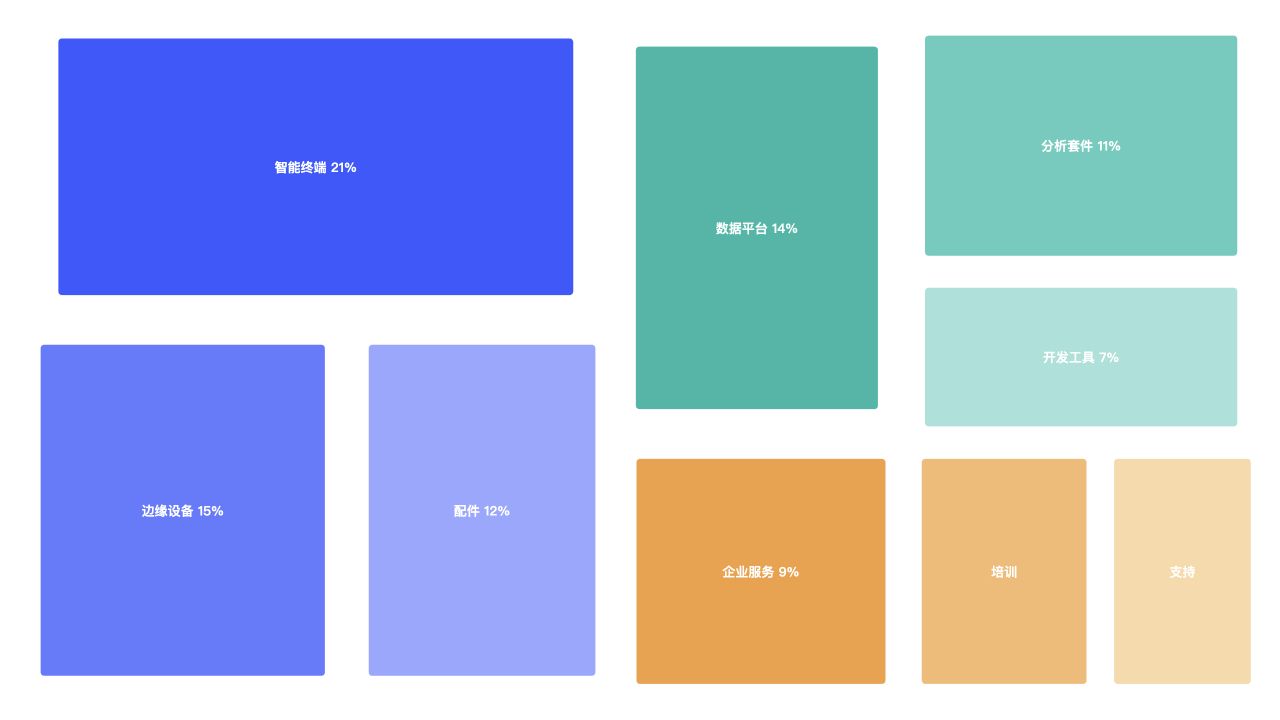
Product revenue treemap

Purchase conversion funnel

User age population pyramid

Conversion path Sankey

Multi-market long-term trends

Regional ranking and trends

Regional operating heat table
