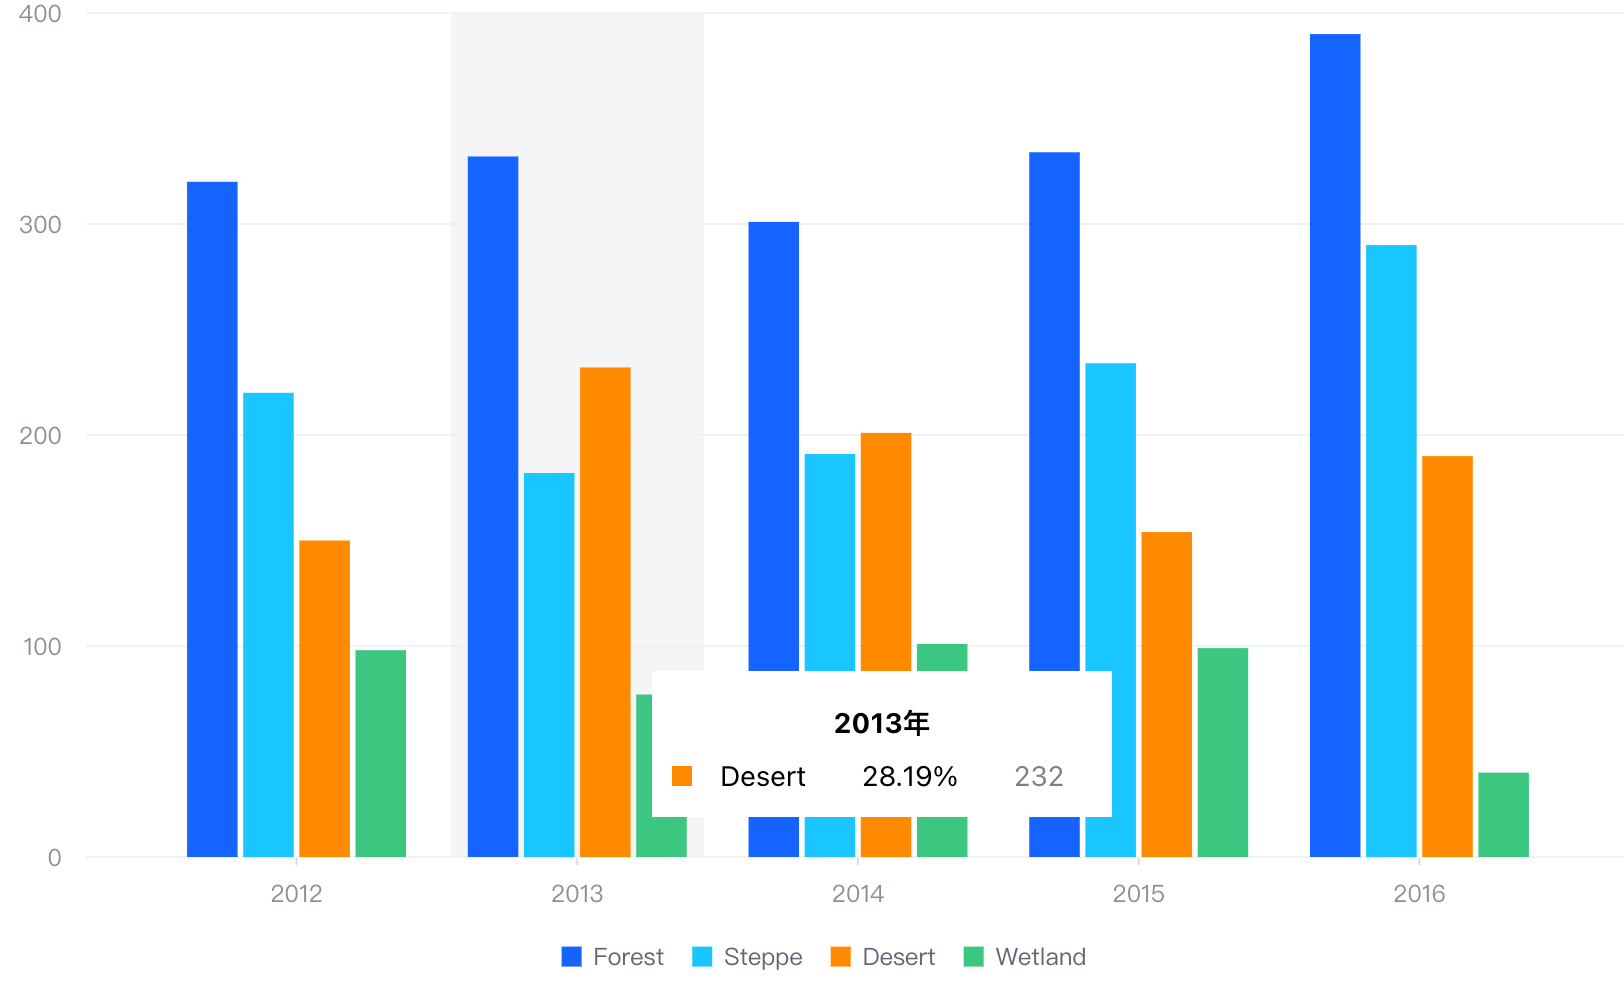
How can Tooltip achieve multi column display in VChart?
Question Description
Seemly to( https://visactor.io/vchart/demo/line-chart/null-value-line )I hope ToolTip can format such a chart into multiple columns

Solution
The solutions for different chart libraries are different. According to the demo you provided, in VChart, you need to implement the multi column style of tooltips through the custom tooltip function.

Code Example
const data = [
  { year: '2012', type: 'Forest', value: 320 },
  { year: '2012', type: 'Steppe', value: 220 },
  { year: '2012', type: 'Desert', value: 150 },
  { year: '2012', type: 'Wetland', value: 98 },
  { year: '2013', type: 'Forest', value: 332 },
  { year: '2013', type: 'Steppe', value: 182 },
  { year: '2013', type: 'Desert', value: 232 },
  { year: '2013', type: 'Wetland', value: 77 },
  { year: '2014', type: 'Forest', value: 301 },
  { year: '2014', type: 'Steppe', value: 191 },
  { year: '2014', type: 'Desert', value: 201 },
  { year: '2014', type: 'Wetland', value: 101 },
  { year: '2015', type: 'Forest', value: 334 },
  { year: '2015', type: 'Steppe', value: 234 },
  { year: '2015', type: 'Desert', value: 154 },
  { year: '2015', type: 'Wetland', value: 99 },
  { year: '2016', type: 'Forest', value: 390 },
  { year: '2016', type: 'Steppe', value: 290 },
  { year: '2016', type: 'Desert', value: 190 },
  { year: '2016', type: 'Wetland', value: 40 }
];
const aggregation = {};
data.forEach(({ year, value }) => {
  if (!aggregation[year]) {
    aggregation[year] = 0;
  }
  aggregation[year] += value;
});
const spec = {
  type: 'bar',
  data: [
    {
      id: 'bar',
      values: data
    }
  ],
  xField: ['year', 'type'],
  yField: 'value',
  seriesField: 'type',
  bar: {
    state: {
      legend_hover_reverse: {
        fill: '#ccc'
      }
    }
  },
  legends: {
    visible: true
  },
  tooltip: {
    mark: {
      title: {
        value: datum => datum['year'] + '年'
      },
      content: [
        {
          key: datum => datum['type'],
          value: datum => datum['value']
        },
        {
          hasShape: false,
          key: 'Proportion',
          value: datum => Math.round((datum['value'] / aggregation[datum['year']]) * 10000) / 100 + '%'
        }
      ]
    },
    dimension: {
      title: {
        value: datum => datum['year'] + '年'
      },
      content: [
        {
          key: datum => datum['type'],
          value: datum => datum['value']
        },
        {
          hasShape: false,
          key: datum => datum['type'] + ' Proportion',
          value: datum => Math.round((datum['value'] / aggregation[datum['year']]) * 10000) / 100 + '%'
        }
      ]
    }
  }
};

const vchart = new VChart(spec, { dom: CONTAINER_ID });
vchart.renderSync();

vchart.setTooltipHandler({
  showTooltip: (activeType, tooltipData, params) => {
    // some code of custom tooltip
    let tooltip = document.getElementById('custom-tooltip');
    console.log(params);
    if (!tooltip) {
      tooltip = document.createElement('div');
      tooltip.id = 'custom-tooltip';
      document.getElementById(CONTAINER_ID).appendChild(tooltip);
      const title = document.createElement('p');
      title.id = 'custom-tooltip-title';
      title.style['fontWeight'] = 'bolder';
      tooltip.appendChild(title);
      const content = document.createElement('div');
      content.id = 'custom-tooltip-content';
      content.style.display = 'flex';
      content.style.flexDirection = 'row';
      tooltip.appendChild(content);
      const leftC = document.createElement('div');
      leftC.style.display = 'flex';
      leftC.style.flexDirection = 'column';
      leftC.style.justifyContent = 'center';
      const s = document.createElement('div');
      s.id = 'custom-tooltip-symbol';
      s.style.width = '10px';
      s.style.height = '10px';
      leftC.appendChild(s);
      const rightC = document.createElement('div');
      rightC.style.width = '200px';
      rightC.style.display = 'flex';
      rightC.style.justifyContent = 'space-around';
      content.appendChild(leftC);
      content.appendChild(rightC);
      const r1 = document.createElement('div');
      r1.id = 'custom-tooltip-r1';
      const r2 = document.createElement('div');
      r2.id = 'custom-tooltip-r2';
      const r3 = document.createElement('div');
      r3.id = 'custom-tooltip-r3';
      r3.style.color = 'grey';
      rightC.appendChild(r1);
      rightC.appendChild(r2);
      rightC.appendChild(r3);
    }

    if (!tooltip || activeType !== 'mark') return;
    const datum = tooltipData[0].datum[0];
    const series = tooltipData[0].series;
    console.log(activeType, tooltipData, params, datum);
    tooltip.style.visibility = 'visible';
    tooltip.style.left = params.event.x + 20 + 'px';
    tooltip.style.top = params.event.y + 20 + 'px';
    tooltip.style.position = 'absolute';
    tooltip.style.background = 'white';
    tooltip.style.padding = '10px';
    const title = document.getElementById('custom-tooltip-title');
    title.innerText = datum['year'] + '年';
    const s = document.getElementById('custom-tooltip-symbol');
    s.style.background = series.getSeriesStyle(datum)('fill');
    const r1 = document.getElementById('custom-tooltip-r1');
    const r2 = document.getElementById('custom-tooltip-r2');
    const r3 = document.getElementById('custom-tooltip-r3');
    r1.innerText = datum['type'];
    r2.innerText = Math.round((datum['value'] / aggregation[datum['year']]) * 10000) / 100 + '%';
    r3.innerText = datum['value'];
  },
  hideTooltip: () => {
    // hide your custom tooltip
    const tooltip = document.getElementById('custom-tooltip');
    if (!tooltip) return;
    tooltip.style.visibility = 'hidden';
  }
});

// Just for the convenience of console debugging, DO NOT COPY!
window['vchart'] = vchart;
Results
Online demo:https://codesandbox.io/s/tooltip-multicolumn-j9s8x7

Related Documentation
Tooltip 教程:https://visactor.io/vchart/guide/tutorial_docs/Chart_Concepts/Tooltip 相关 api:https://visactor.io/vchart/option/barChart#tooltip.visible github:https://github.com/VisActor/VChart
