Question title
How to avoid the outline being blocked when hovering the pie chart sector in VChart?
Problem description
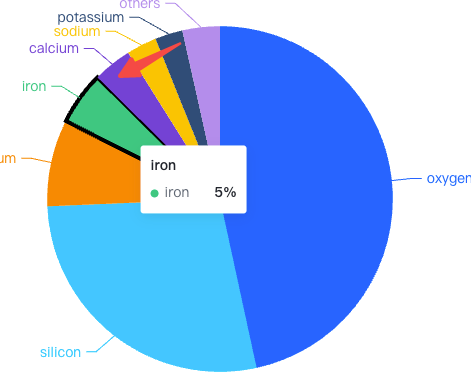
The hover stroke of the pie chart sector is configured, but it will be obscured by other sectors

Solution
You can adjust the level of the element when hover, so that the hover element is always displayed above other sectors, which can avoid the problem of stroke obstruction
 pie: {
    state: {
      hover: {
        stroke: 'black',
        lineWidth: 4,
        zIndex: 1
      }
    }
  },</br>
Code example
const spec = {
  type: 'pie',
  data: [
    {
      id: 'id0',
      values: [
        { type: 'oxygen', value: '46.60' },
        { type: 'silicon', value: '27.72' },
        { type: 'aluminum', value: '8.13' },
        { type: 'iron', value: '5' },
        { type: 'calcium', value: '3.63' },
        { type: 'sodium', value: '2.83' },
        { type: 'potassium', value: '2.59' },
        { type: 'others', value: '3.5' }
      ]
    }
  ],
  outerRadius: 0.8,
  valueField: 'value',
  categoryField: 'type',
  title: {
    visible: true,
    text: 'Statistics of Surface Element Content'
  },
  legends: {
    visible: true,
    orient: 'left'
  },
  label: {
    visible: true
  },
  pie: {
    state: {
      hover: {
        stroke: 'black',
        lineWidth: 4,
        zIndex: 1
      }
    }
  },
  tooltip: {
    mark: {
      content: [
        {
          key: datum => datum['type'],
          value: datum => datum['value'] + '%'
        }
      ]
    }
  }
};

const vchart = new VChart(spec, { dom: CONTAINER_ID });
vchart.renderSync();

// Just for the convenience of console debugging, DO NOT COPY!
window['vchart'] = vchart;</br>
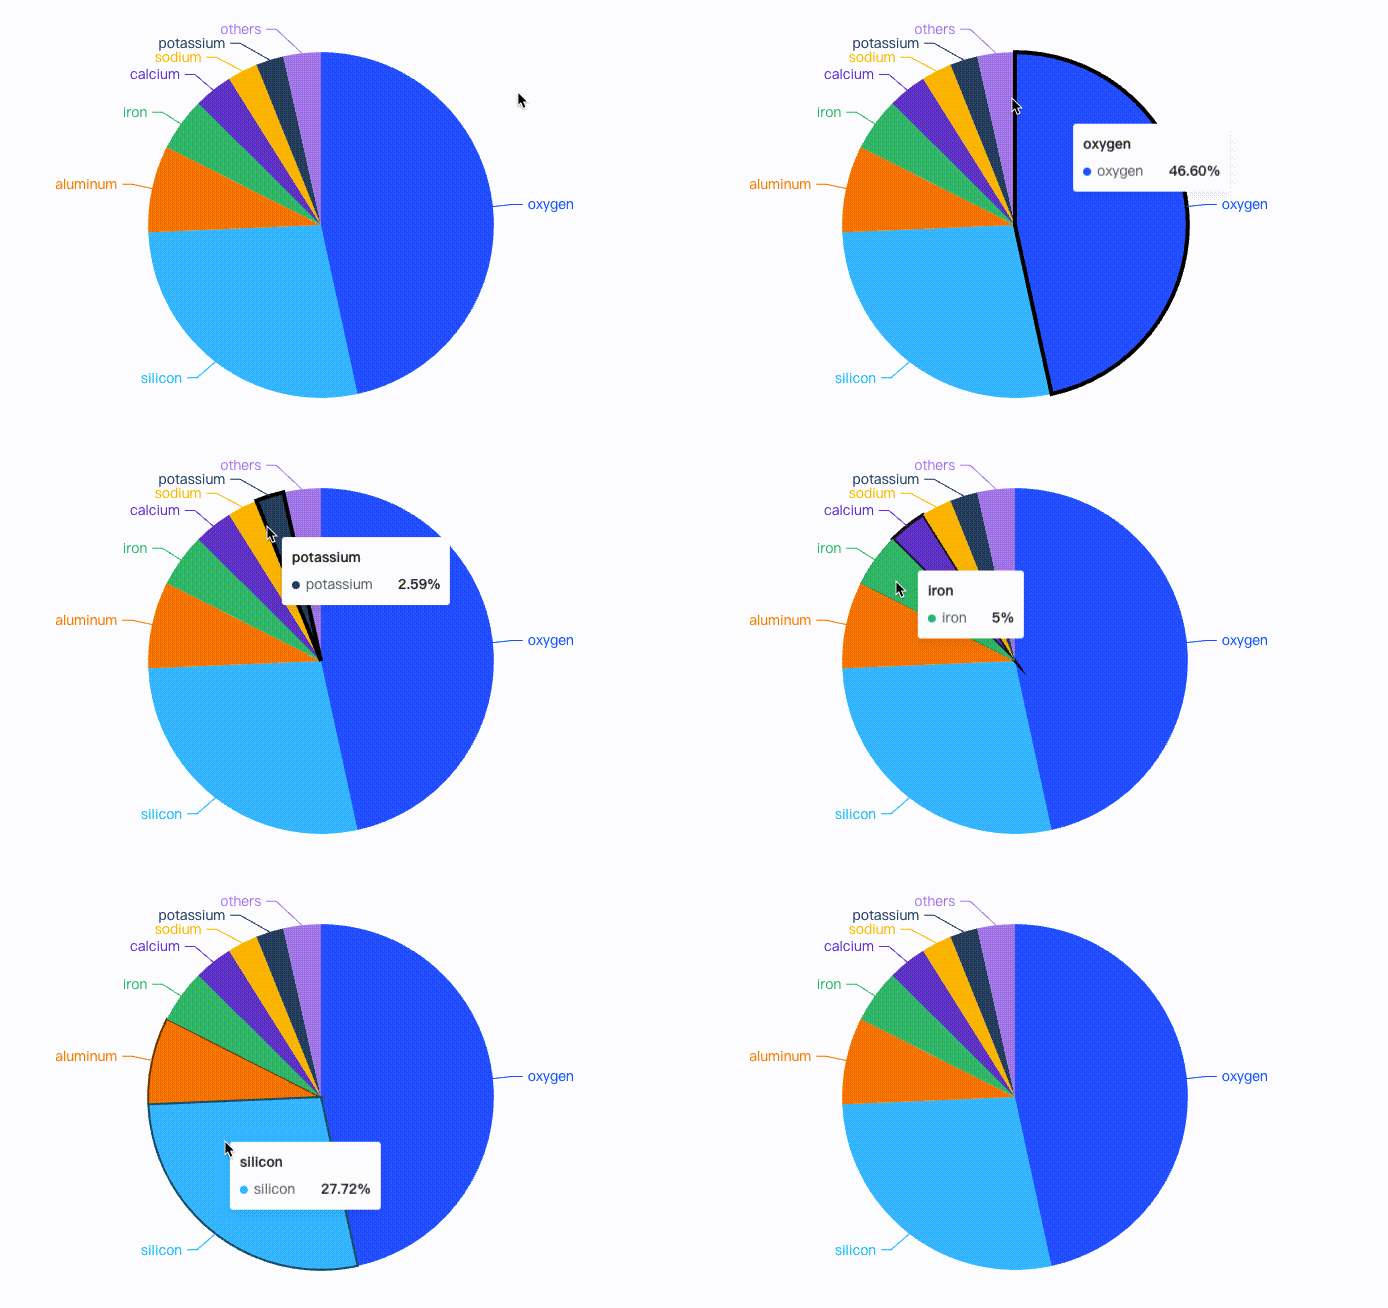
Results show

