How to listen to the click event of the histogram to customize the style of the column?
Question Description
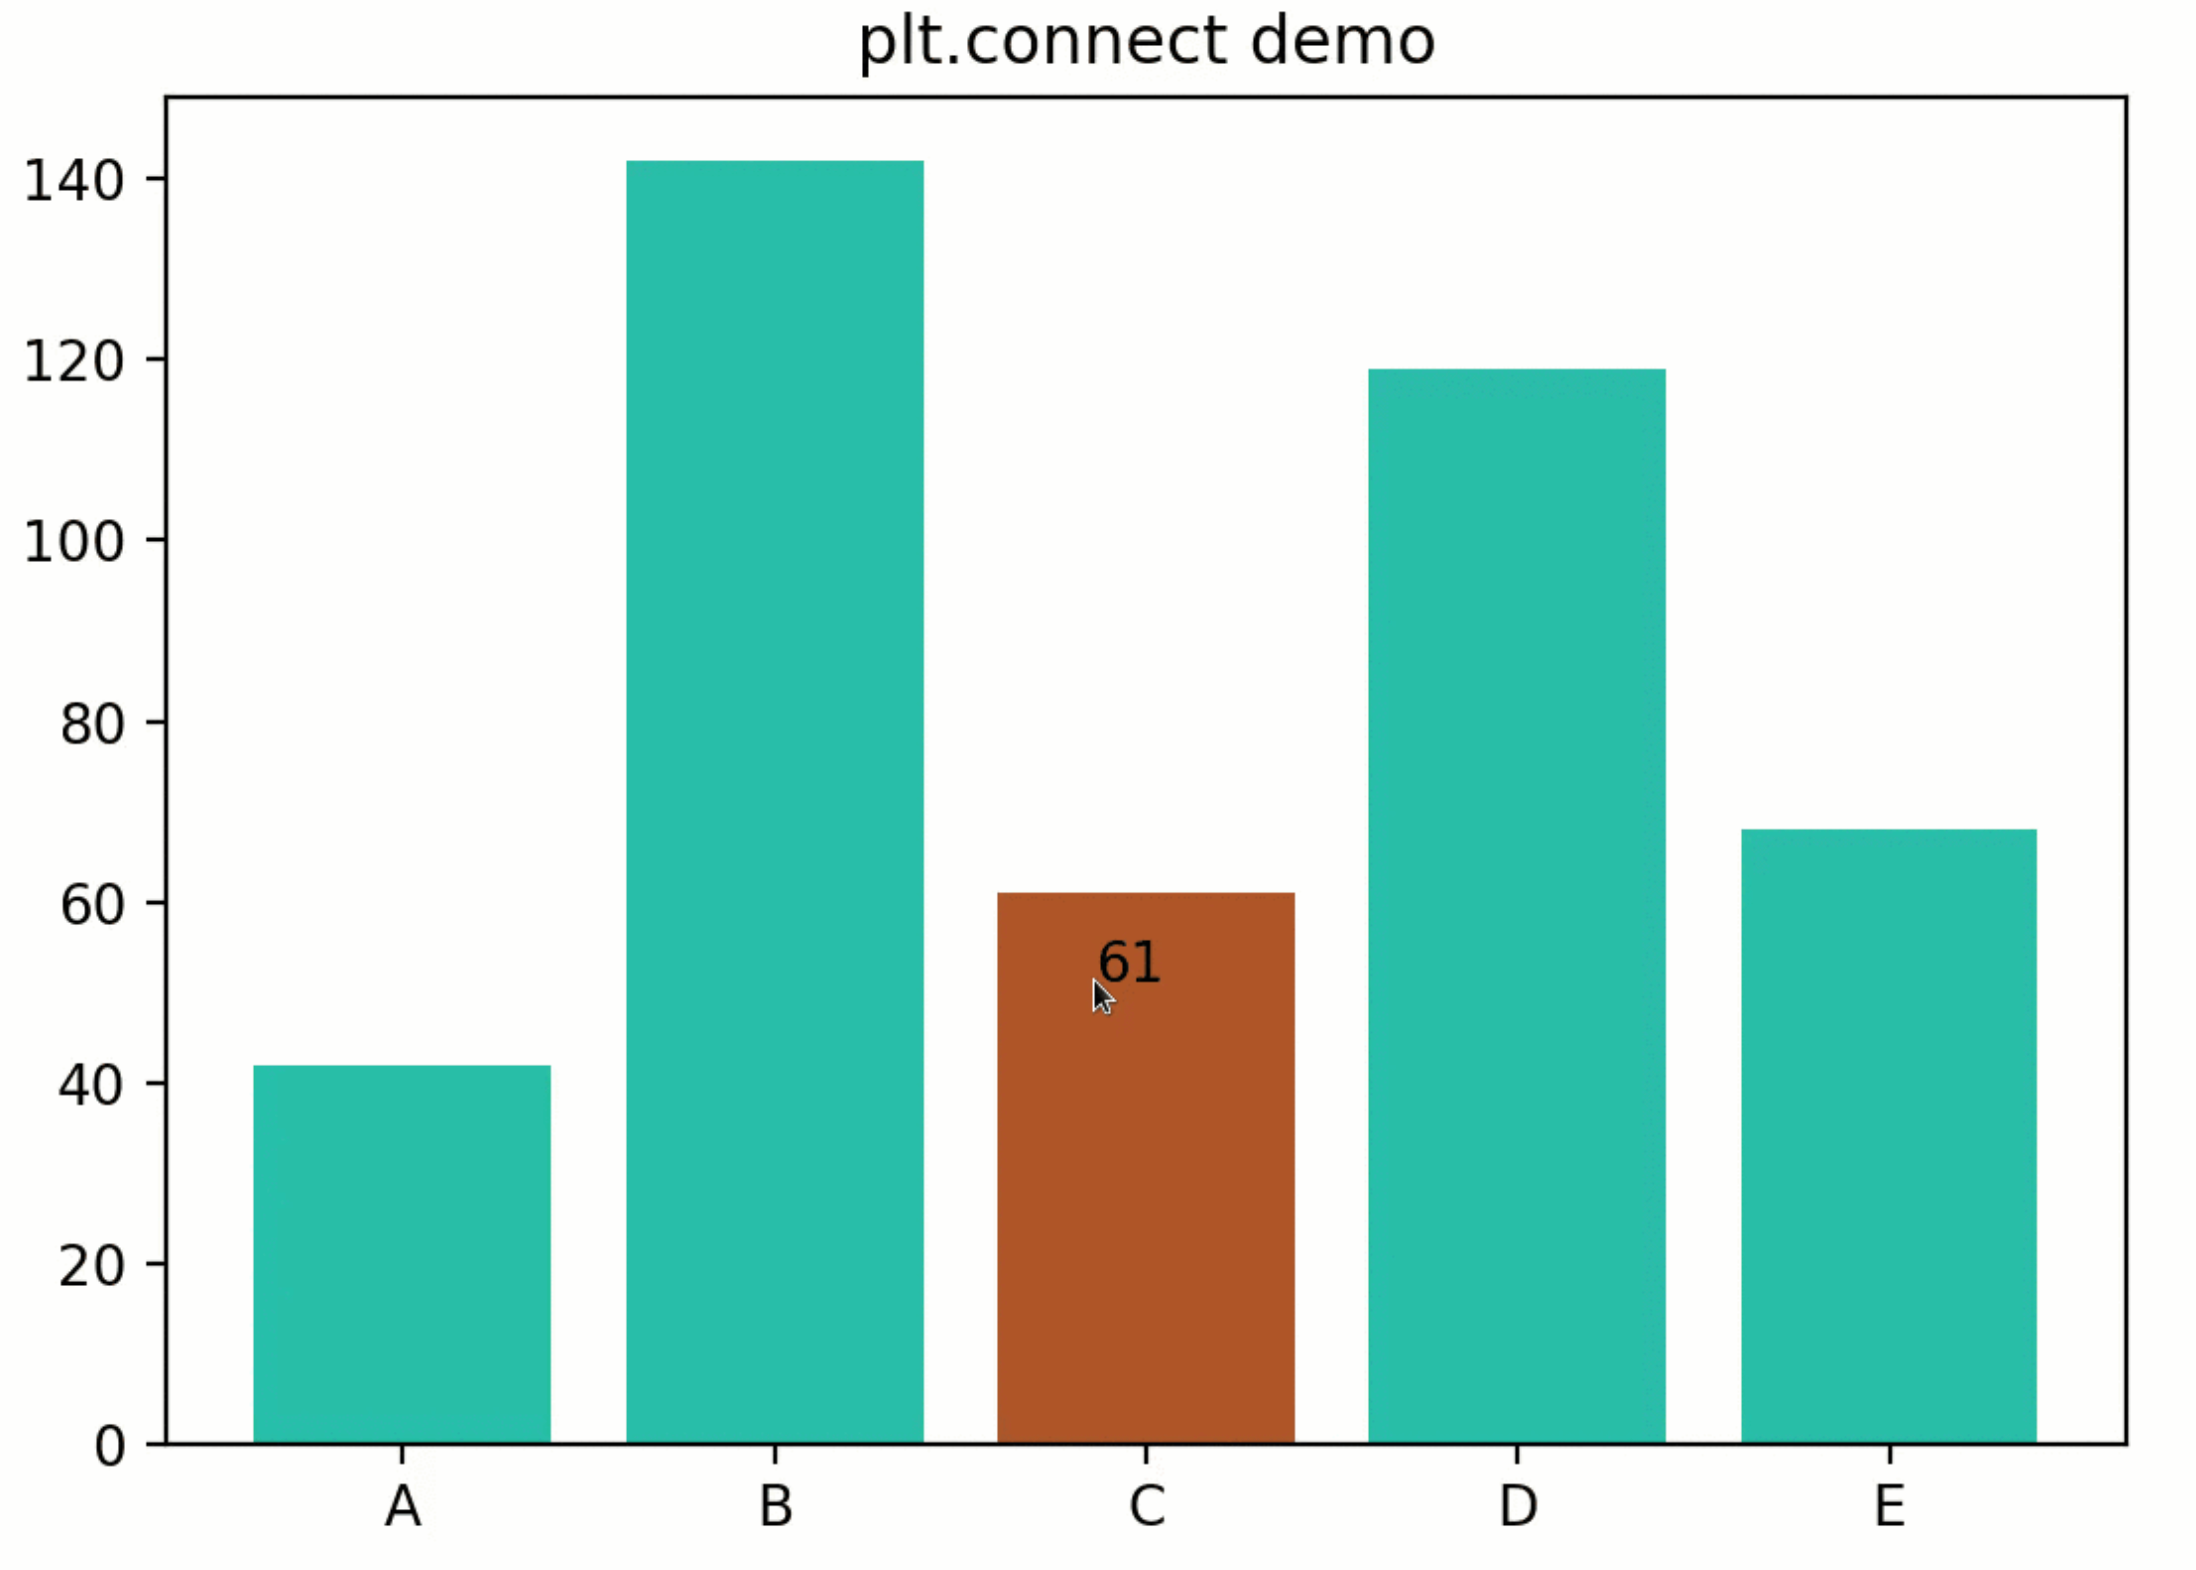
I want to listen to the click event of each column in a bar chart, and if the column is clicked, it will be painted in a different color, probably like this:

But after the click event is triggered, I don't want to re-render the entire chart. It is better to have a smooth transition effect on the current chart. How should this be achieved?
Solution
VChart provides built-in hover and select states for each chart element. Developers do not need to monitor the click event of the column themselves. They only need to declare the style in the select state in the corresponding primitive configuration to achieve the effect of rendering the column in different colors after being selected.
At the same time, in the VChart histogram, the update animation is enabled by default for visual channel changes of column marks. When the color changes, the rendering effect of the column will smoothly transition to the final state.
