Question Title
How to set different fill colors for different groups in a radar chart?
Question Description
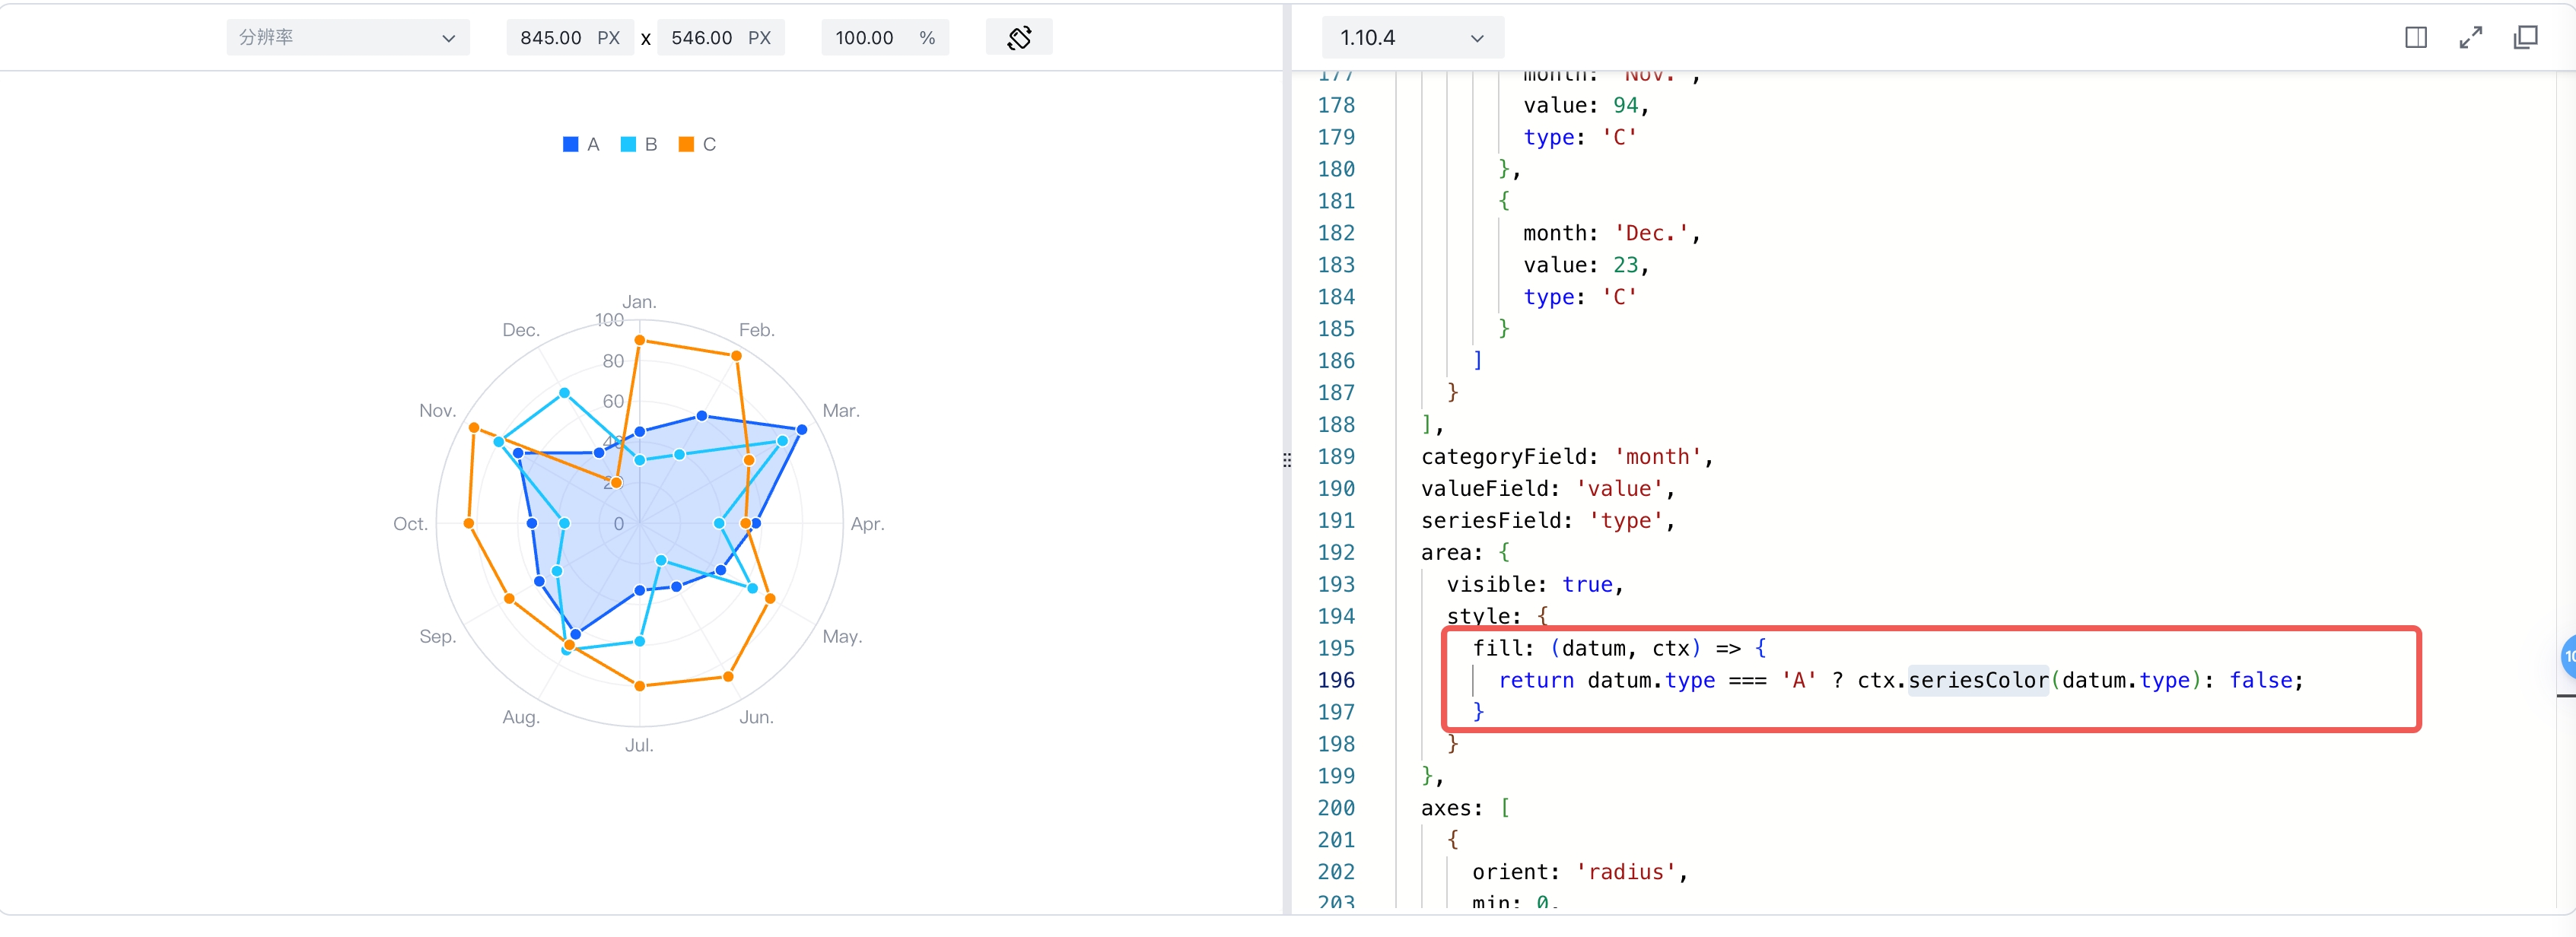
As shown in the figure, the radar chart has multiple groups. Can different fill colors be set for different groups?

Solution
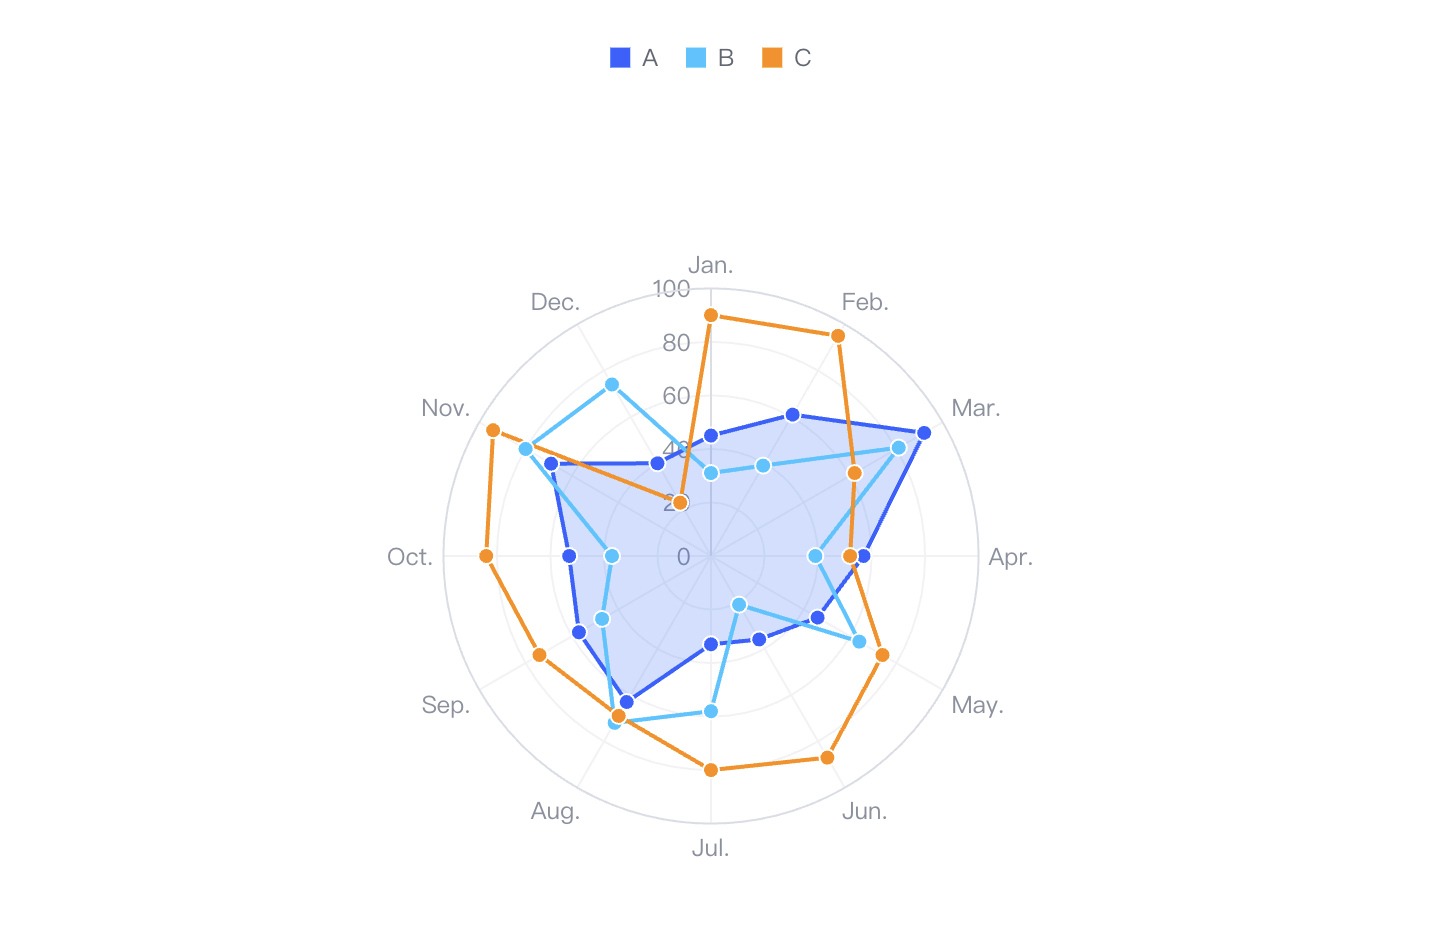
All VChart graphical elements support functional styles, which allow you to define custom functions to return different fill colors based on the data in the style.

Code Examples
const spec = {
  type: 'radar',
  data: [
    {
      values: [
        {
          month: 'Jan.',
          value: 45,
          type: 'A'
        },
        {
          month: 'Feb.',
          value: 61,
          type: 'A'
        },
        {
          month: 'Mar.',
          value: 92,
          type: 'A'
        },
        {
          month: 'Apr.',
          value: 57,
          type: 'A'
        },
        {
          month: 'May.',
          value: 46,
          type: 'A'
        },
        {
          month: 'Jun.',
          value: 36,
          type: 'A'
        },
        {
          month: 'Jul.',
          value: 33,
          type: 'A'
        },
        {
          month: 'Aug.',
          value: 63,
          type: 'A'
        },
        {
          month: 'Sep.',
          value: 57,
          type: 'A'
        },
        {
          month: 'Oct.',
          value: 53,
          type: 'A'
        },
        {
          month: 'Nov.',
          value: 69,
          type: 'A'
        },
        {
          month: 'Dec.',
          value: 40,
          type: 'A'
        },
        {
          month: 'Jan.',
          value: 31,
          type: 'B'
        },
        {
          month: 'Feb.',
          value: 39,
          type: 'B'
        },
        {
          month: 'Mar.',
          value: 81,
          type: 'B'
        },
        {
          month: 'Apr.',
          value: 39,
          type: 'B'
        },
        {
          month: 'May.',
          value: 64,
          type: 'B'
        },
        {
          month: 'Jun.',
          value: 21,
          type: 'B'
        },
        {
          month: 'Jul.',
          value: 58,
          type: 'B'
        },
        {
          month: 'Aug.',
          value: 72,
          type: 'B'
        },
        {
          month: 'Sep.',
          value: 47,
          type: 'B'
        },
        {
          month: 'Oct.',
          value: 37,
          type: 'B'
        },
        {
          month: 'Nov.',
          value: 80,
          type: 'B'
        },
        {
          month: 'Dec.',
          value: 74,
          type: 'B'
        },
        {
          month: 'Jan.',
          value: 90,
          type: 'C'
        },
        {
          month: 'Feb.',
          value: 95,
          type: 'C'
        },
        {
          month: 'Mar.',
          value: 62,
          type: 'C'
        },
        {
          month: 'Apr.',
          value: 52,
          type: 'C'
        },
        {
          month: 'May.',
          value: 74,
          type: 'C'
        },
        {
          month: 'Jun.',
          value: 87,
          type: 'C'
        },
        {
          month: 'Jul.',
          value: 80,
          type: 'C'
        },
        {
          month: 'Aug.',
          value: 69,
          type: 'C'
        },
        {
          month: 'Sep.',
          value: 74,
          type: 'C'
        },
        {
          month: 'Oct.',
          value: 84,
          type: 'C'
        },
        {
          month: 'Nov.',
          value: 94,
          type: 'C'
        },
        {
          month: 'Dec.',
          value: 23,
          type: 'C'
        }
      ]
    }
  ],
  categoryField: 'month',
  valueField: 'value',
  seriesField: 'type',
  area: {
    visible: true,
    style: {
      fill: (datum, ctx) => {
        return datum.type === 'A' ? ctx.seriesColor(datum.type): false;
      }
    }
  },
  axes: [
    {
      orient: 'radius',
      min: 0,
      domainLine: {
        visible: true
      },
      label: {
        visible: true
      },
      grid: {
        smooth: true
      }
    },
    {
      orient: 'angle',
      tick: {
        visible: false
      },
      grid: {
        style: {
          lineDash: [0]
        }
      }
    }
  ],
  legends: {
    visible: true,
    orient: 'top'
  }
};

const vchart = new VChart(spec, { dom: CONTAINER_ID });
vchart.renderSync();

// Just for the convenience of console debugging, DO NOT COPY!
window['vchart'] = vchart;</br>
Result Presentation

