Question title
How to configure different colors for a wire
Problem description
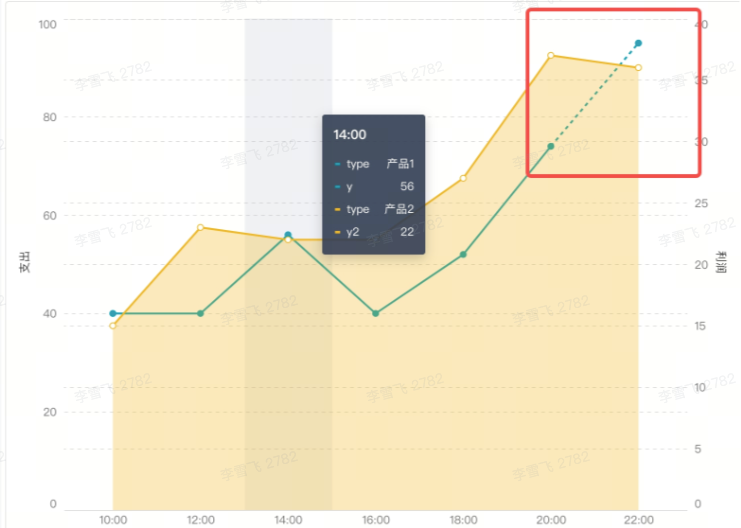
Part of the line is predicted data, and it is hoped that the dashed line and color will be different when predicting data.

Solution
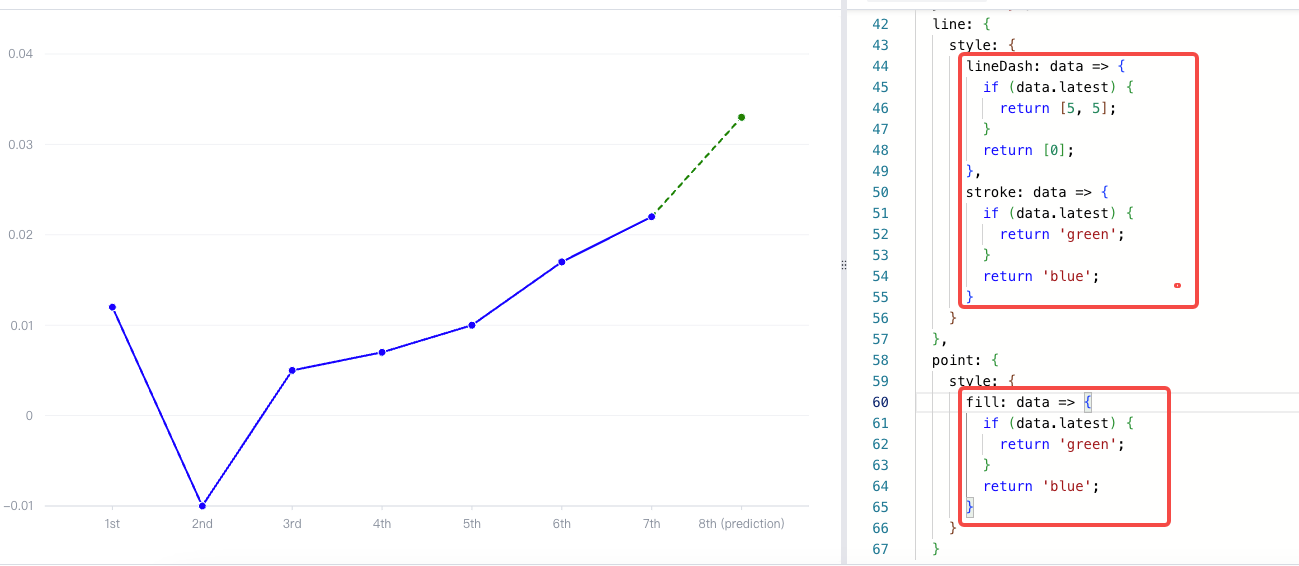
VChart lines can return different styles to different data on a line through a function. When there is a situation of inconsistent styles, we will draw the line segment from the previous data to the current data as the style corresponding to the current data when drawing
Code example
const spec = {
  type: 'line',
  data: {
    values: [
      {
        x: '1st',
        y: 0.012
      },
      {
        x: '2nd',
        y: -0.01
      },
      {
        x: '3rd',
        y: 0.005
      },
      {
        x: '4th',
        y: 0.007
      },
      {
        x: '5th',
        y: 0.01
      },
      {
        x: '6th',
        y: 0.017
      },
      {
        x: '7th',
        y: 0.022
      },
      {
        x: '8th (prediction)',
        y: 0.033,
        latest: true
      }
    ]
  },
  xField: 'x',
  yField: 'y',
  line: {
    style: {
      lineDash: data => {
        if (data.latest) {
          return [5, 5];
        }
        return [0];
      },
      stroke: data => {
        if (data.latest) {
          return 'green';
        }
        return 'blue';
      }
    }
  },
  point: {
    style: {
      fill: data => {
        if (data.latest) {
          return 'green';
        }
        return 'blue';
      }
    }
  }
};
const vchart = new VChart(spec, { dom: CONTAINER_ID });
vchart.renderSync();

// Just for the convenience of console debugging, DO NOT COPY!
window['vchart'] = vchart;</br>
Results show

Related Documents
Demo:https://codesandbox.io/p/sandbox/vchart-disabletriggerevent-forked-mxqfr3?file=%2Fsrc%2Findex.js%3A59%2C13
Tutorial:
- Initialize VChart: https://visactor.io/vchart/api/API/vchart
- Line style configuration: https://www.visactor.io/vchart/option/lineChart#line.style.stroke
Github:https://github.com/VisActor/VChart/
