How to customize the axis scale value of a gauge chart?
Question Description
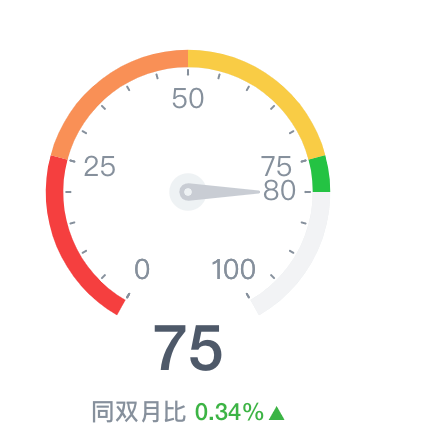
How does VChart configure the scale value of the gauge chart? As shown in the figure below, I only want 0, 25, 50, 75, 100.

Solution
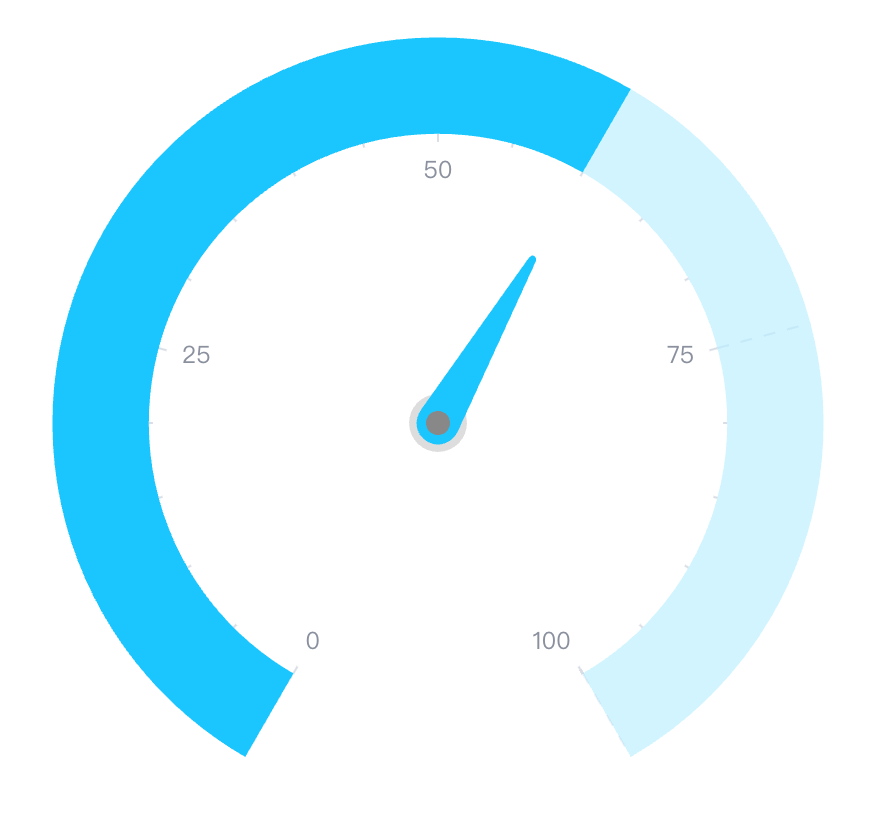
You can refer to the following demo to change the spec of the angle axis of the gauge chart, and solve the problem by configuring the maximum / minimum value and step size of the axis tick.
Code Example
Result

Quote
github:https://github.com/VisActor/VChart
Demo page: https://www.visactor.io/vchart/demo/gauge-chart/basic-gauge
