Question title
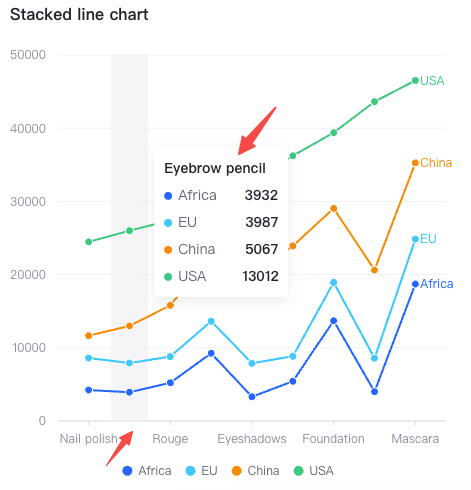
How to make all the labels of the x-axis display
Problem description
May I ask why some of the text on the x-axis of the chart is not displayed? How can it be displayed?

Solution
The discrete lower axis in VChart defaults to a sampling algorithm based on label width. Therefore, when label overlap may occur, some labels are hidden according to the strategy. The relevant configuration items are as follows:
axes: {
    sampling: boolean
}</br>
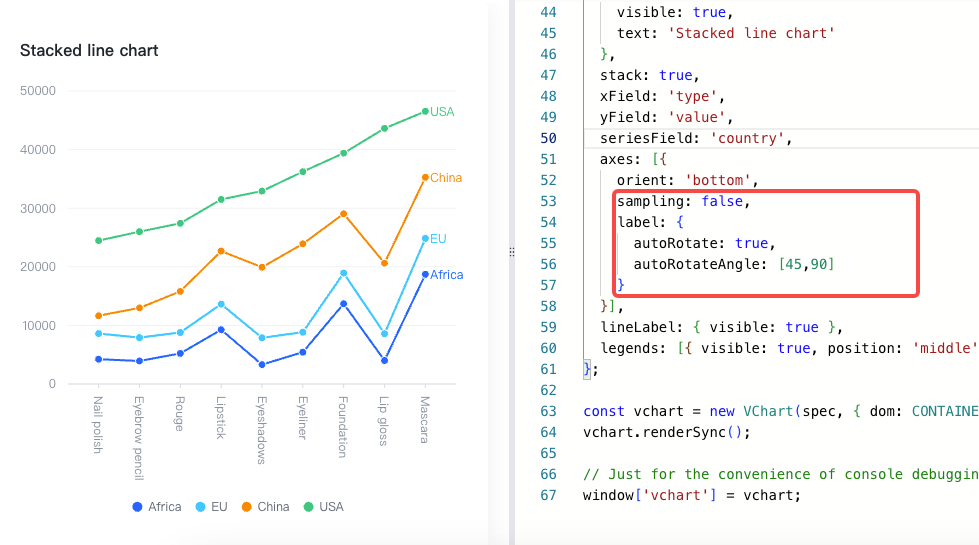
After turning off the sampling, in order to show the effect optimization, we also have a set of anti-overlap strategies for graphics. The configuration items are as follows
export interface AxisLabelOverlap {
    autoRotate?: boolean;
    autoRotateAngle?: number[];
    autoHide?: boolean;
    autoHideMethod?: 'parity' | 'greedy' | CustomMethod;
    ...others
}

axes: {
    label: {
        ...AxisLabelOverlap
    }
}</br>
So you can configure the following two things:
- Set sampling: false to forcibly display all tags
- Set anti-overlap policies. For example, automatic rotation, which displays more labels. If it is not particularly dense, all labels can be displayed.
Code example
const spec = {
  type: 'line',
  data: {
    values: [
      { type: 'Nail polish', country: 'Africa', value: 4229 },
      { type: 'Nail polish', country: 'EU', value: 4376 },
      { type: 'Nail polish', country: 'China', value: 3054 },
      { type: 'Nail polish', country: 'USA', value: 12814 },
      { type: 'Eyebrow pencil', country: 'Africa', value: 3932 },
      { type: 'Eyebrow pencil', country: 'EU', value: 3987 },
      { type: 'Eyebrow pencil', country: 'China', value: 5067 },
      { type: 'Eyebrow pencil', country: 'USA', value: 13012 },
      { type: 'Rouge', country: 'Africa', value: 5221 },
      { type: 'Rouge', country: 'EU', value: 3574 },
      { type: 'Rouge', country: 'China', value: 7004 },
      { type: 'Rouge', country: 'USA', value: 11624 },
      { type: 'Lipstick', country: 'Africa', value: 9256 },
      { type: 'Lipstick', country: 'EU', value: 4376 },
      { type: 'Lipstick', country: 'China', value: 9054 },
      { type: 'Lipstick', country: 'USA', value: 8814 },
      { type: 'Eyeshadows', country: 'Africa', value: 3308 },
      { type: 'Eyeshadows', country: 'EU', value: 4572 },
      { type: 'Eyeshadows', country: 'China', value: 12043 },
      { type: 'Eyeshadows', country: 'USA', value: 12998 },
      { type: 'Eyeliner', country: 'Africa', value: 5432 },
      { type: 'Eyeliner', country: 'EU', value: 3417 },
      { type: 'Eyeliner', country: 'China', value: 15067 },
      { type: 'Eyeliner', country: 'USA', value: 12321 },
      { type: 'Foundation', country: 'Africa', value: 13701 },
      { type: 'Foundation', country: 'EU', value: 5231 },
      { type: 'Foundation', country: 'China', value: 10119 },
      { type: 'Foundation', country: 'USA', value: 10342 },
      { type: 'Lip gloss', country: 'Africa', value: 4008 },
      { type: 'Lip gloss', country: 'EU', value: 4572 },
      { type: 'Lip gloss', country: 'China', value: 12043 },
      { type: 'Lip gloss', country: 'USA', value: 22998 },
      { type: 'Mascara', country: 'Africa', value: 18712 },
      { type: 'Mascara', country: 'EU', value: 6134 },
      { type: 'Mascara', country: 'China', value: 10419 },
      { type: 'Mascara', country: 'USA', value: 11261 }
    ]
  },
  title: {
    visible: true,
    text: 'Stacked line chart'
  },
  stack: true,
  xField: 'type',
  yField: 'value',
  seriesField: 'country',
  axes: [{
    orient: 'bottom',
    sampling: false,
    label: {
      autoRotate: true,
      autoRotateAngle: [45,90]
    }
  }],
  lineLabel: { visible: true },
  legends: [{ visible: true, position: 'middle', orient: 'bottom' }]
};

const vchart = new VChart(spec, { dom: CONTAINER_ID });
vchart.renderSync();

// Just for the convenience of console debugging, DO NOT COPY!
window['vchart'] = vchart;</br>
Results show

Related Documents
Demo:https://codesandbox.io/p/sandbox/vchart-disabletriggerevent-forked-n5653c?file=%2Fsrc%2Findex.js%3A14%2C18
Tutorial:
- Initialize VChart: https://visactor.io/vchart/api/API/vchart
- Axis sampling: https://www.visactor.io/vchart/option/barChart-axes-band#sampling
- Axis label anti-overlap: https://www.visactor.io/vchart/option/barChart-axes-band#label.autoRotate
Github:https://github.com/VisActor/VChart/
