How can chart tooltips be configured to display dimensions and measures as single or multiple rows?
Question Description
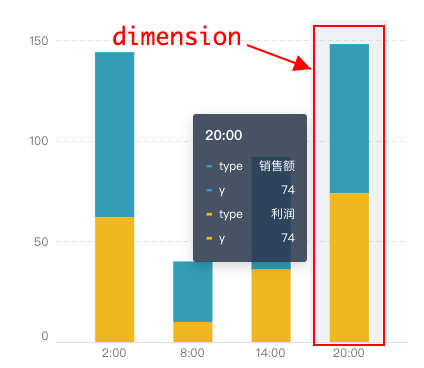
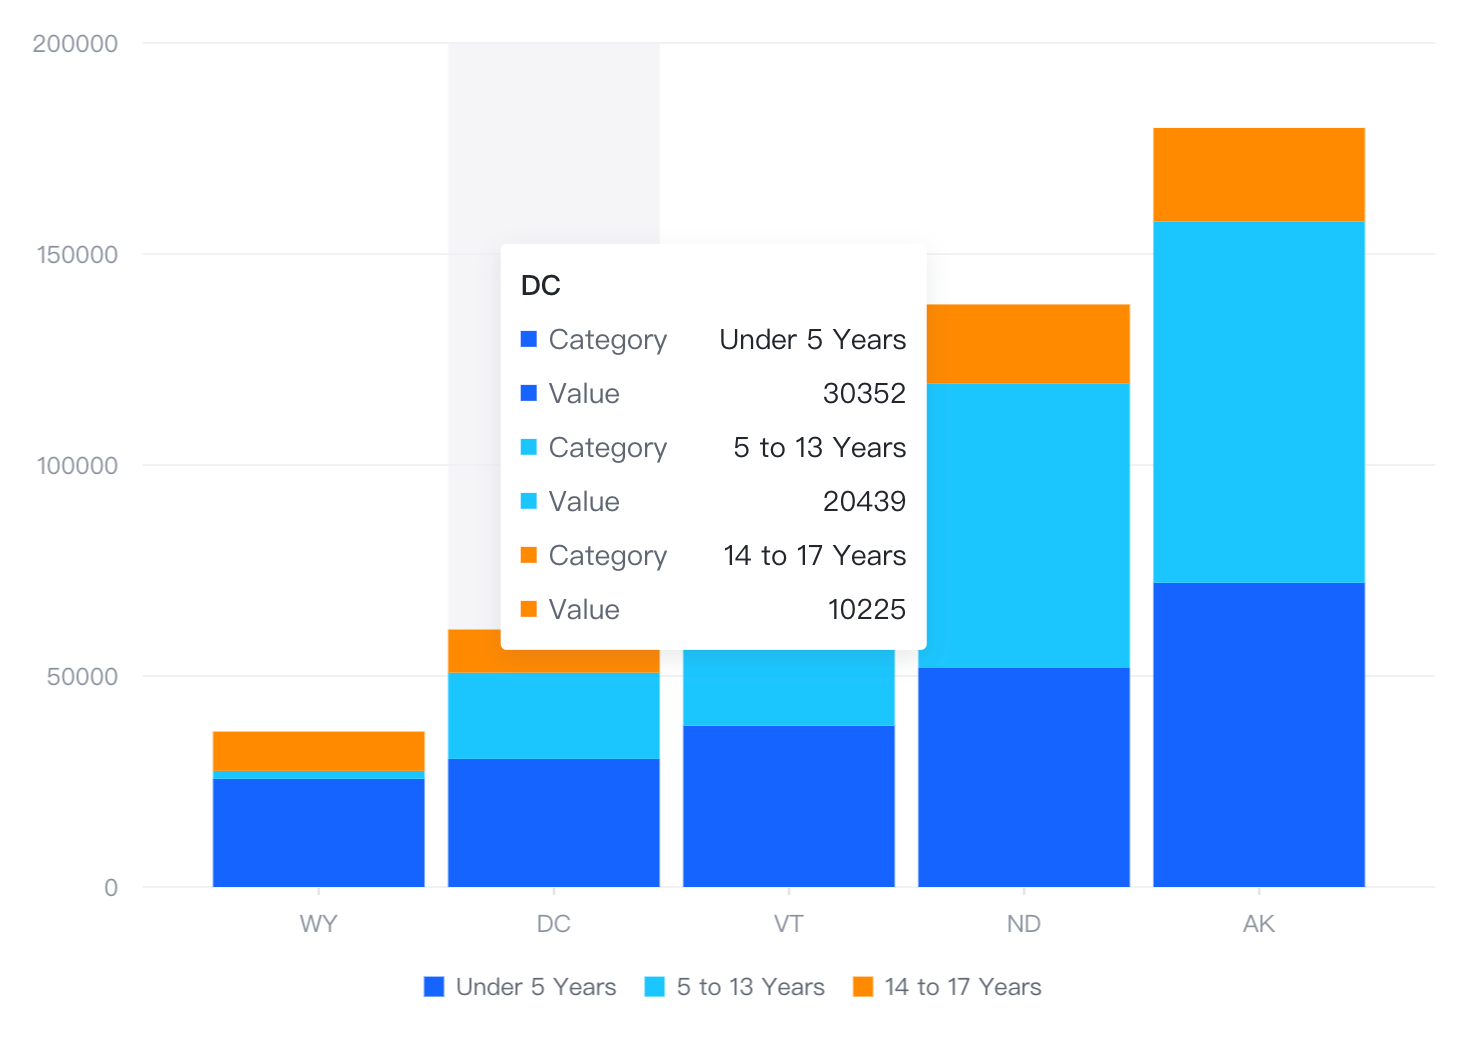
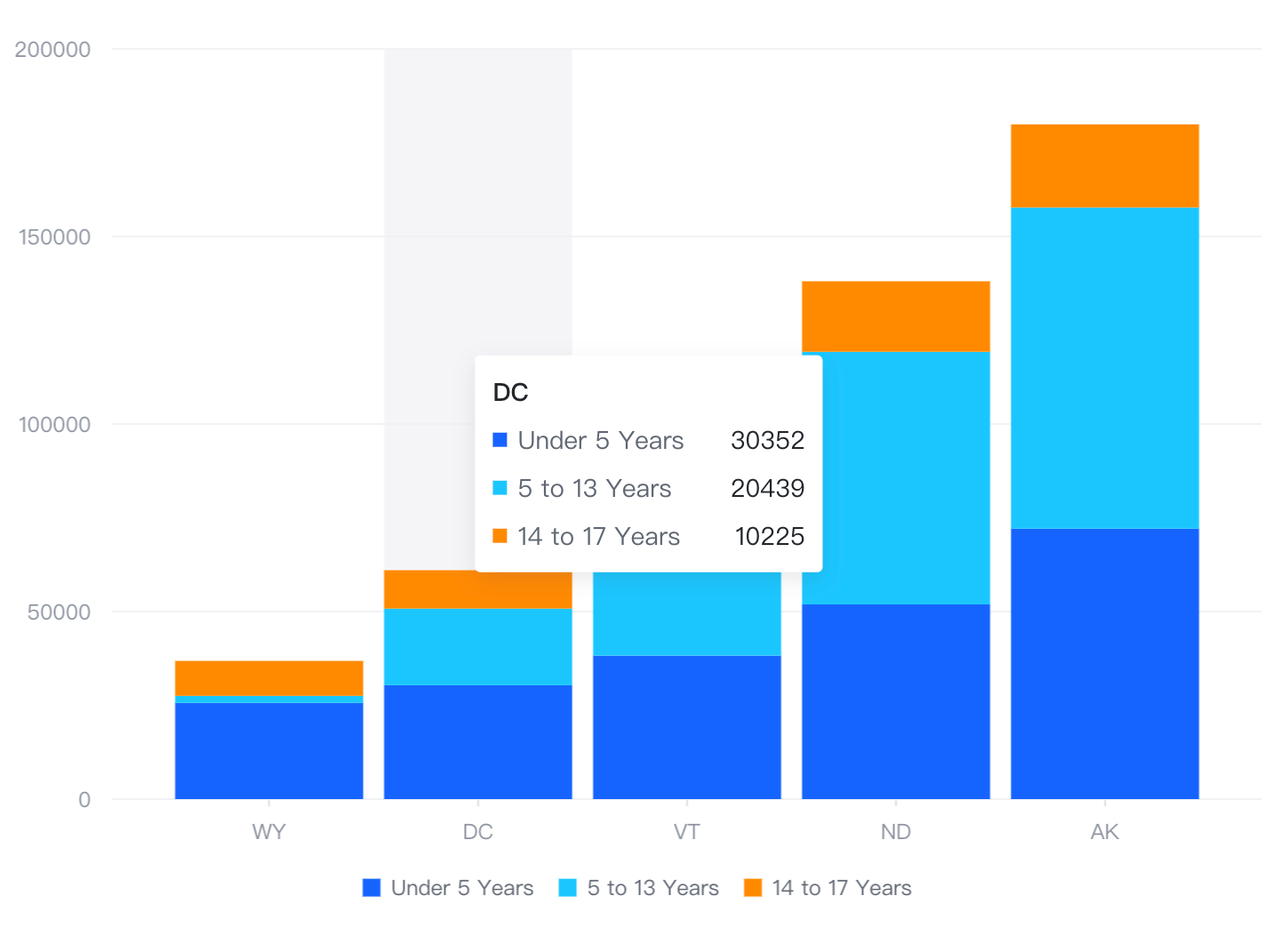
How can VChart configure the following two tooltip display effects?
One is the category (type) and the value (y) occupying one row respectively:

One is that the category (type) and value (y) match and merge together on one line:

Solution
You can refer to the following demo to change the tooltip spec.
Code Example
The category (type) and the value (y) occupy one row respectively:
One is that the category (type) and value (y) match and merge together on one line:
Result


Quote
github:https://github.com/VisActor/VChart
Demo page: https://www.visactor.io/vchart/demo/tooltip/custom-tooltip
