Question Title
How to use HTML to render axis labels?
Problem Description
For the labels of the axis, how to use custom HTML rendering? Can I also implement custom jump links?

Solution
VChart axis labels support absolute positioning with HTML. To achieve this:
- Step 1: VChart needs to enable the relevant plugin through
enableHtmlAttribute: true.
const vchart = new VChart(spec, { dom: CONTAINER_ID, enableHtmlAttribute: true });
vchart.renderSync();</br>
- Step 2: When configuring the axis labels, return HTML type labels through the
formatMethod. - Step 3: Implement custom URL jumps through the
<a>tag and set the mouse event of opening the tag topointerEvents: 'auto'.
axes: [
    {
      orient: 'bottom',
      sampling: false,
      label: {
        style: {
          forceBoundsWidth: 40
        },
        formatMethod: (label, a) => {
          return {
            type: 'html',
            text: {
              pointerEvents: 'auto',
              id: `x-label-${label}`,
              style: {
                width: '40px',
                overflow: 'hidden'
              },
              dom: `<a href="https://visactor.com/vchart/demo/line-chart/dash-line">${label}</a>`
            }
          };
        }
      }
    }
  ],</br>
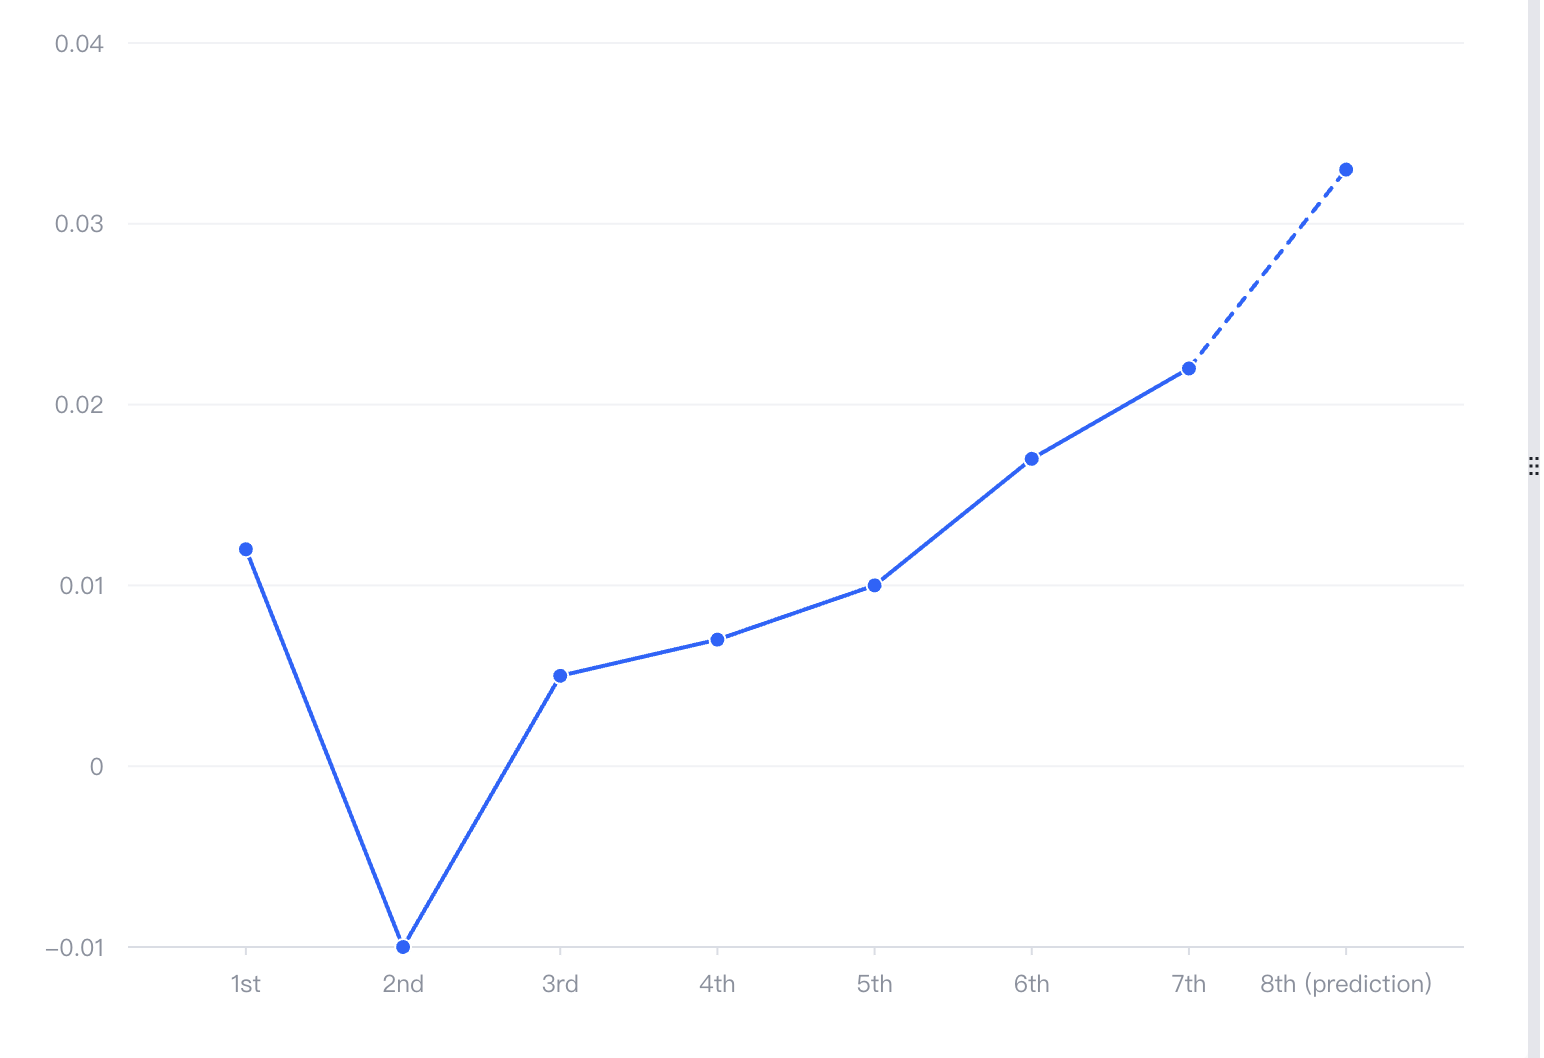
Code Examples
const spec = {
  type: 'line',
  data: {
    values: [
      {
        x: '1st',
        y: 0.012
      },
      {
        x: '2nd',
        y: -0.01
      },
      {
        x: '3rd',
        y: 0.005
      },
      {
        x: '4th',
        y: 0.007
      },
      {
        x: '5th',
        y: 0.01
      },
      {
        x: '6th',
        y: 0.017
      },
      {
        x: '7th',
        y: 0.022
      },
      {
        x: '8th (prediction)',
        y: 0.033,
        latest: true
      }
    ]
  },
  xField: 'x',
  yField: 'y',
  axes: [
    {
      orient: 'bottom',
      sampling: false,
      label: {
        style: {
          forceBoundsWidth: 40
        },
        formatMethod: (label, a) => {
          return {
            type: 'html',
            text: {
              pointerEvents: 'auto',
              id: `x-label-${label}`,
              style: {
                width: '40px',
                overflow: 'hidden'
              },
              dom: `<a href="https://visactor.com/vchart/demo/line-chart/dash-line">${label}</a>`
            }
          };
        }
      }
    }
  ],
  line: {
    style: {
      lineDash: data => {
        if (data.latest) {
          return [5, 5];
        }
        return [0];
      }
    }
  }
};

const vchart = new VChart(spec, { dom: CONTAINER_ID, enableHtmlAttribute: true });
vchart.renderSync();

// Just for the convenience of console debugging, DO NOT COPY!
window['vchart'] = vchart;</br>
