Title
How to control the layout spacing of charts and components within charts
Description
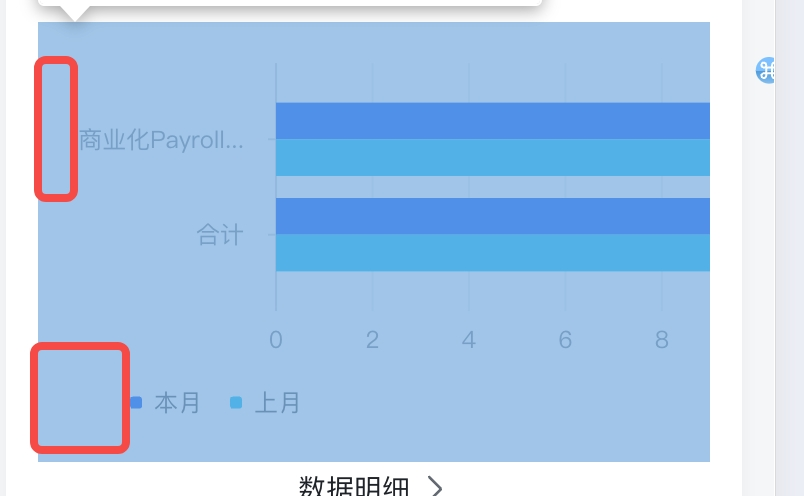
How to control the layout spacing of charts and components within charts, as shown in the figure below, you want to adjust the spacing at the red box mark so that the chart axis and legend can be aligned on the left

Solution
You can use the padding property provided on VChart. If you want to configure the padding of the chart, you can directly configure it at the first level of the spec, as follows:
const spec = {
  padding: {
    left: 0,
  }
}</br>
If you want to configure the padding of a component, you can directly configure it under the properties of the corresponding component. VChart provides the padding property for all elements on the chart. The specific usage can be found on the configuration page.
Code Example
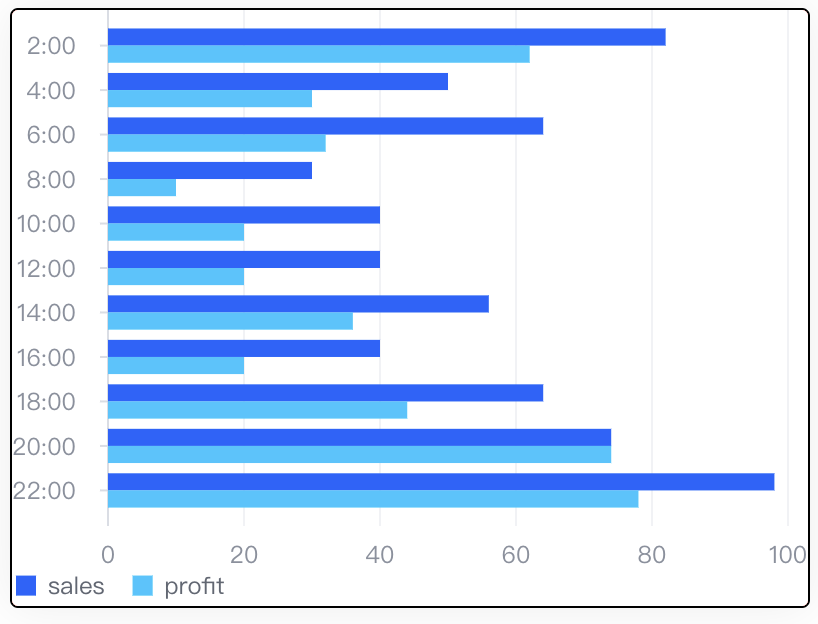
The following code configures padding on axes, legends, and charts, leaving 0 blank space on the left side of the chart.
const spec = {
  type: 'bar',
  data: [
    {
      id: 'barData',
      values: [
        {
          x: '2:00',
          y: 82,
          type: 'sales'
        },
        {
          x: '4:00',
          y: 50,
          type: 'sales'
        },
        {
          x: '6:00',
          y: 64,
          type: 'sales'
        },
        {
          x: '8:00',
          y: 30,
          type: 'sales'
        },
        {
          x: '10:00',
          y: 40,
          type: 'sales'
        },
        {
          x: '12:00',
          y: 40,
          type: 'sales'
        },
        {
          x: '14:00',
          y: 56,
          type: 'sales'
        },
        {
          x: '16:00',
          y: 40,
          type: 'sales'
        },
        {
          x: '18:00',
          y: 64,
          type: 'sales'
        },
        {
          x: '20:00',
          y: 74,
          type: 'sales'
        },
        {
          x: '22:00',
          y: 98,
          type: 'sales'
        },
        {
          x: '2:00',
          y: 62,
          type: 'profit'
        },
        {
          x: '4:00',
          y: 30,
          type: 'profit'
        },
        {
          x: '6:00',
          y: 32,
          type: 'profit'
        },
        {
          x: '8:00',
          y: 10,
          type: 'profit'
        },
        {
          x: '10:00',
          y: 20,
          type: 'profit'
        },
        {
          x: '12:00',
          y: 20,
          type: 'profit'
        },
        {
          x: '14:00',
          y: 36,
          type: 'profit'
        },
        {
          x: '16:00',
          y: 20,
          type: 'profit'
        },
        {
          x: '18:00',
          y: 44,
          type: 'profit'
        },
        {
          x: '20:00',
          y: 74,
          type: 'profit'
        },
        {
          x: '22:00',
          y: 78,
          type: 'profit'
        }
      ]
    }
  ],
  direction: 'horizontal',
  xField: 'y',
  yField: ['x', 'type'],
  seriesField: 'type',
  legends: {
    visible: true,
    orient: 'bottom',
    position: 'left',
    padding: {
      left: 0
    }
  },
  axes: [
    {
      orient: 'left',
      paddingInner: 0,
      padding: {
        left: 0
      }
    }
  ],
  padding: {
    left: 0
  }
};

const vchart = new VChart(spec, { dom: CONTAINER_ID });
vchart.renderSync();

// Just for the convenience of console debugging, DO NOT COPY!
window['vchart'] = vchart;</br>
Results

