Title
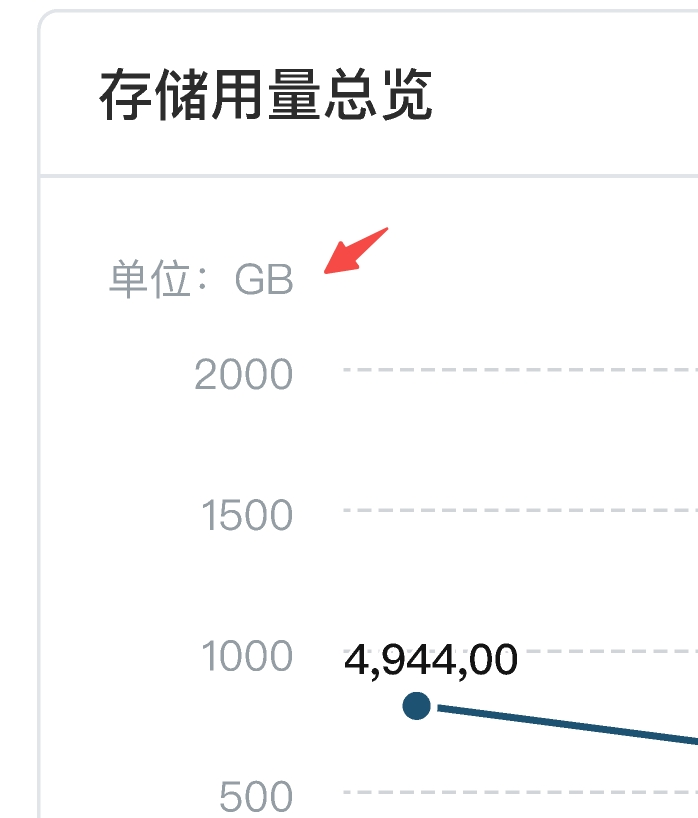
How to configure the display of axis units on the axes of a line chart?
Problem Description
I want to configure the unit display on the Y-axis. Which parameters need to be configured?

Solution
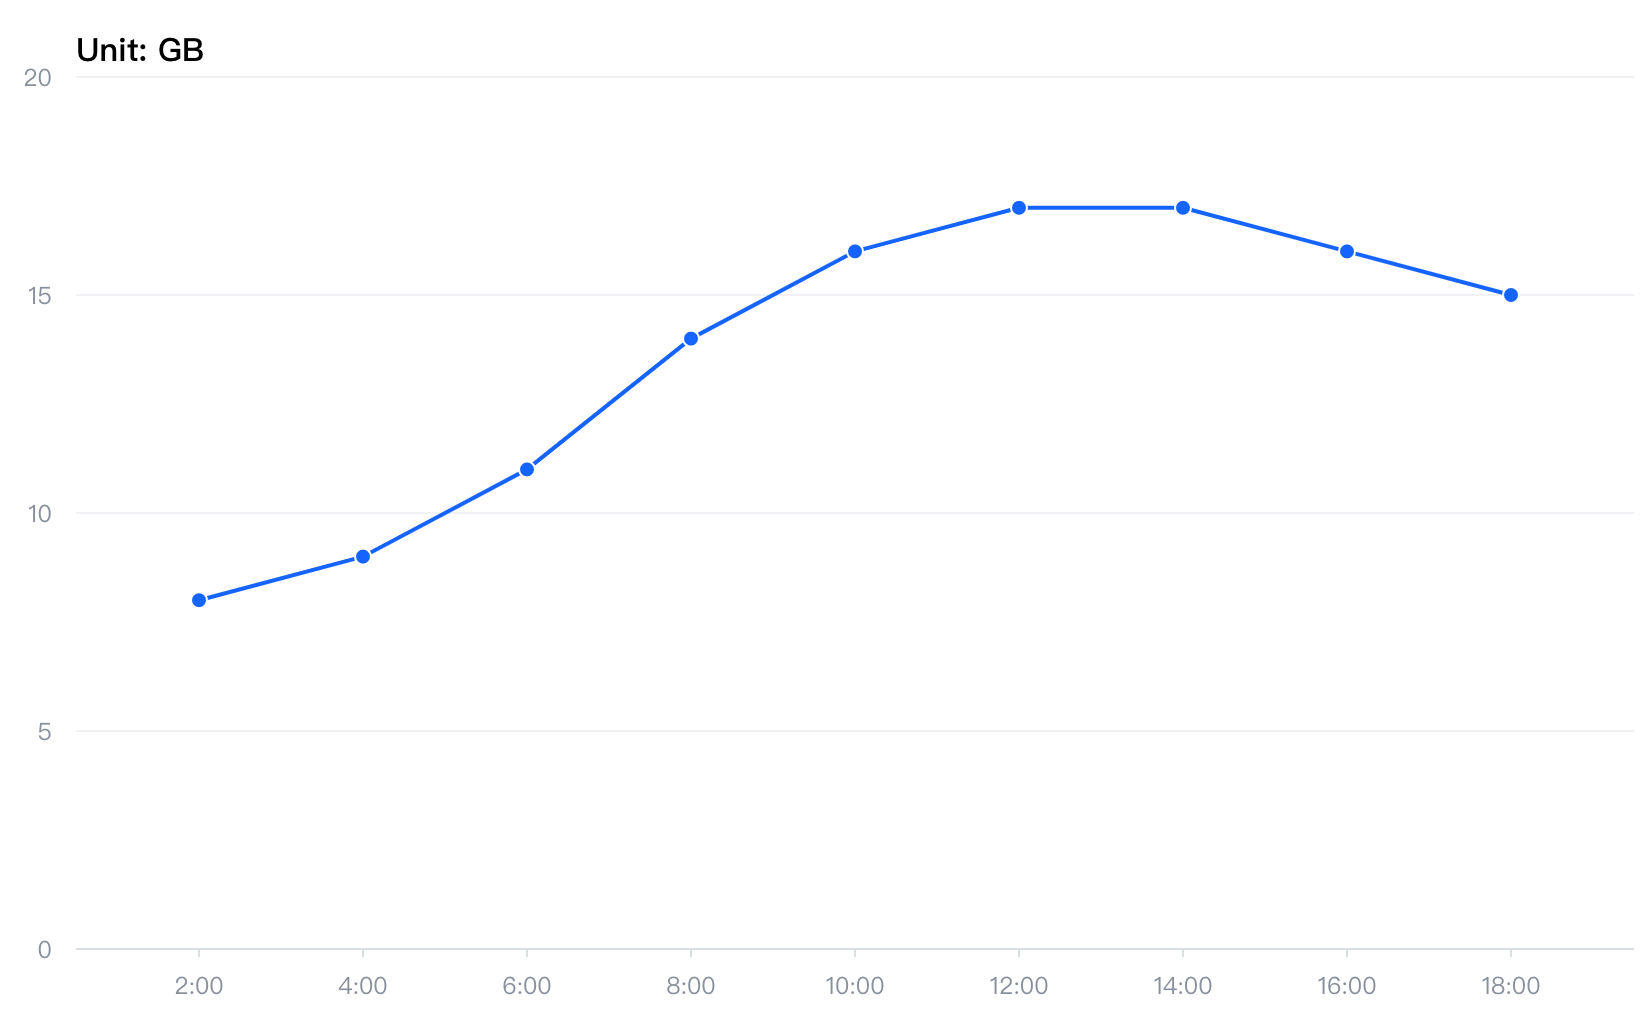
You can set the unit configuration in the axis configuration item to enable the display of axis units. The text content displayed in the axis unit and the axis unit style can be adjusted through the unit configuration item.
    {
      orient: 'left',
      unit: {
        visible: true,
        text: 'Unit: GB',
        style: { fontSize: 16, fontWeight: 'bold', fill: '#000' }
      }
    }</br>
Code Example
const spec = {
  type: 'line',
  data: {
    values: [
      {
        time: '2:00',
        value: 8
      },
      {
        time: '4:00',
        value: 9
      },
      {
        time: '6:00',
        value: 11
      },
      {
        time: '8:00',
        value: 14
      },
      {
        time: '10:00',
        value: 16
      },
      {
        time: '12:00',
        value: 17
      },
      {
        time: '14:00',
        value: 17
      },
      {
        time: '16:00',
        value: 16
      },
      {
        time: '18:00',
        value: 15
      }
    ]
  },
  xField: 'time',
  yField: 'value',
  axes: [
    { orient: 'bottom' },
    {
      orient: 'left',
      unit: {
        visible: true,
        text: 'Unit: GB',
        style: { fontSize: 16, fontWeight: 'bold', fill: '#000' }
      }
    }
  ]
};

const vchart = new VChart(spec, { dom: CONTAINER_ID });
vchart.renderSync();

// Just for the convenience of console debugging, DO NOT COPY!
window['vchart'] = vchart;</br>
Results

