Title
How to modify the tag graphic of the tooltip content item?
Description
I want to change the shape in the tooltip to linear for line charts. Is there a good implementation?

Solution
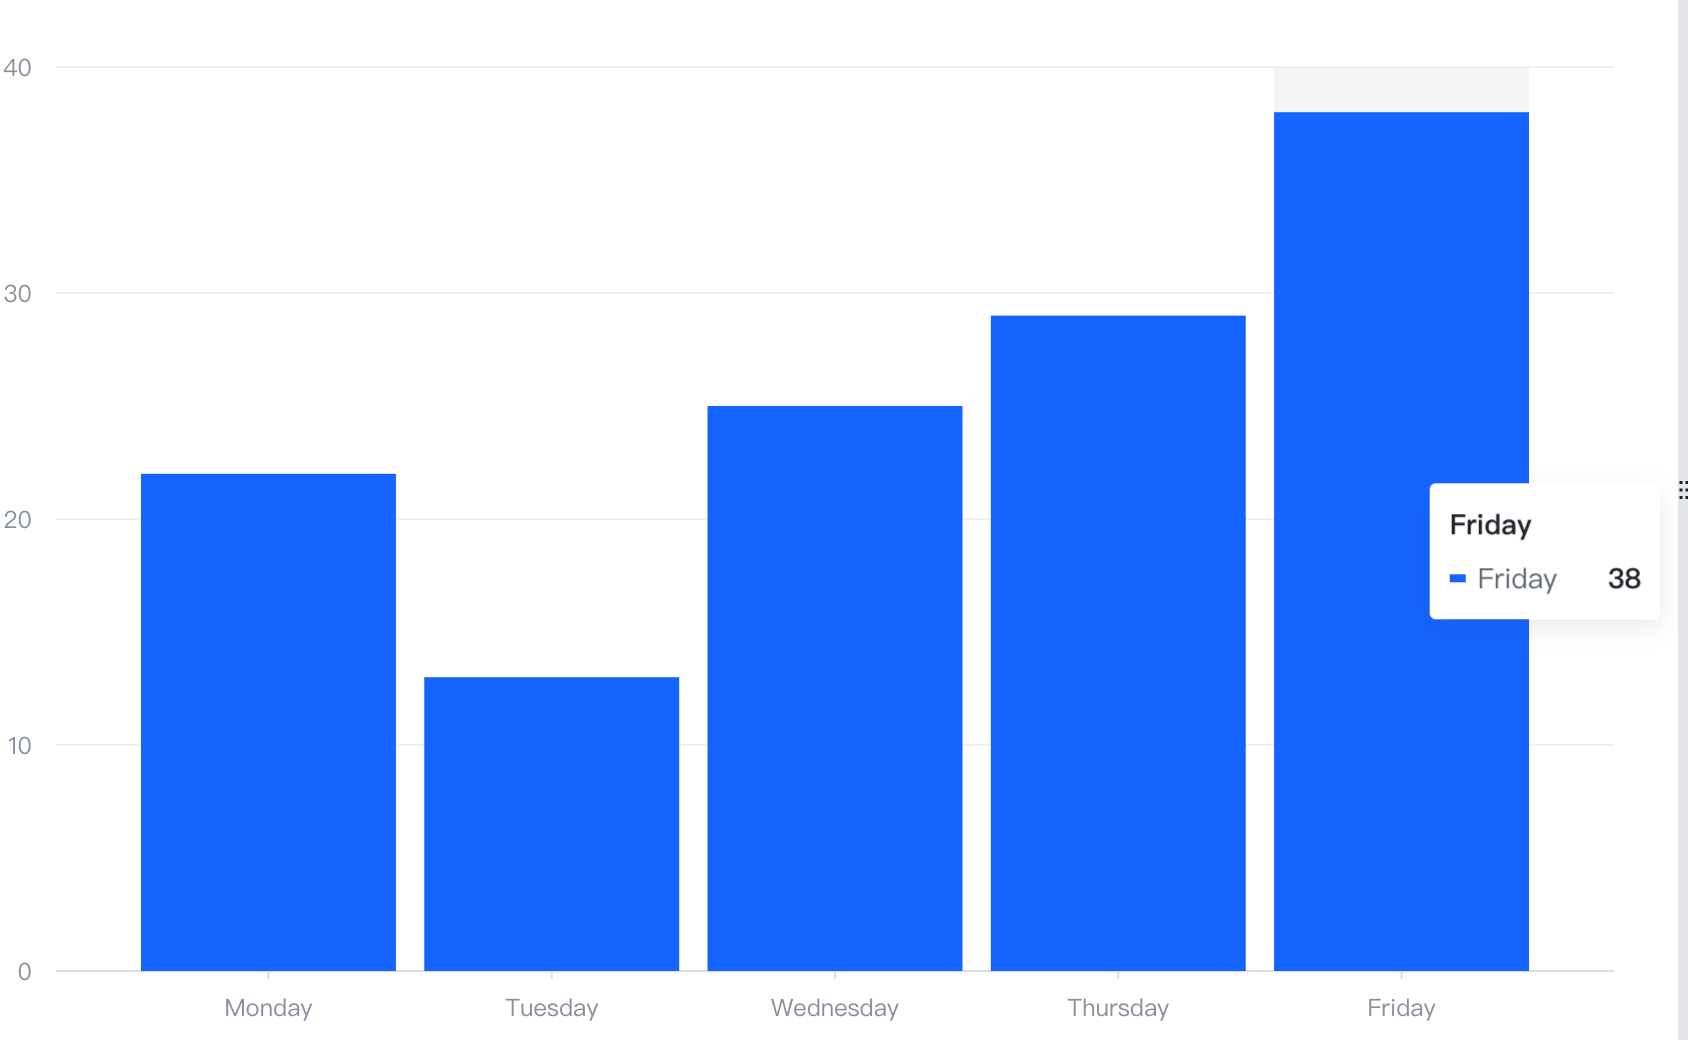
Modify shapeType to 'rect ' .
Code Example
const spec = {
    type: 'bar',
    data: [
      {
        id: 'barData',
        values: [
          { month: 'Monday', sales: 22 },
          { month: 'Tuesday', sales: 13 },
          { month: 'Wednesday', sales: 25 },
          { month: 'Thursday', sales: 29 },
          { month: 'Friday', sales: 38 }
        ]
      }
    ],
    tooltip: {
      mark: {
        content:
        [{ key: datum => datum['month'], value: datum => datum['sales'], shapeType: 'rect' }]
      }
    },
    xField: 'month',
    yField: 'sales'
  };
  const vchart = new VChart(spec, { dom: CONTAINER_ID });
  vchart.renderSync();</br>
Results show

