Title
Is there an api for exporting pictures from charts?
Description
Can charts be directly converted into high definition images and saved? Is there a relevant API?
Solution
You have two ways to save a chart as an image:
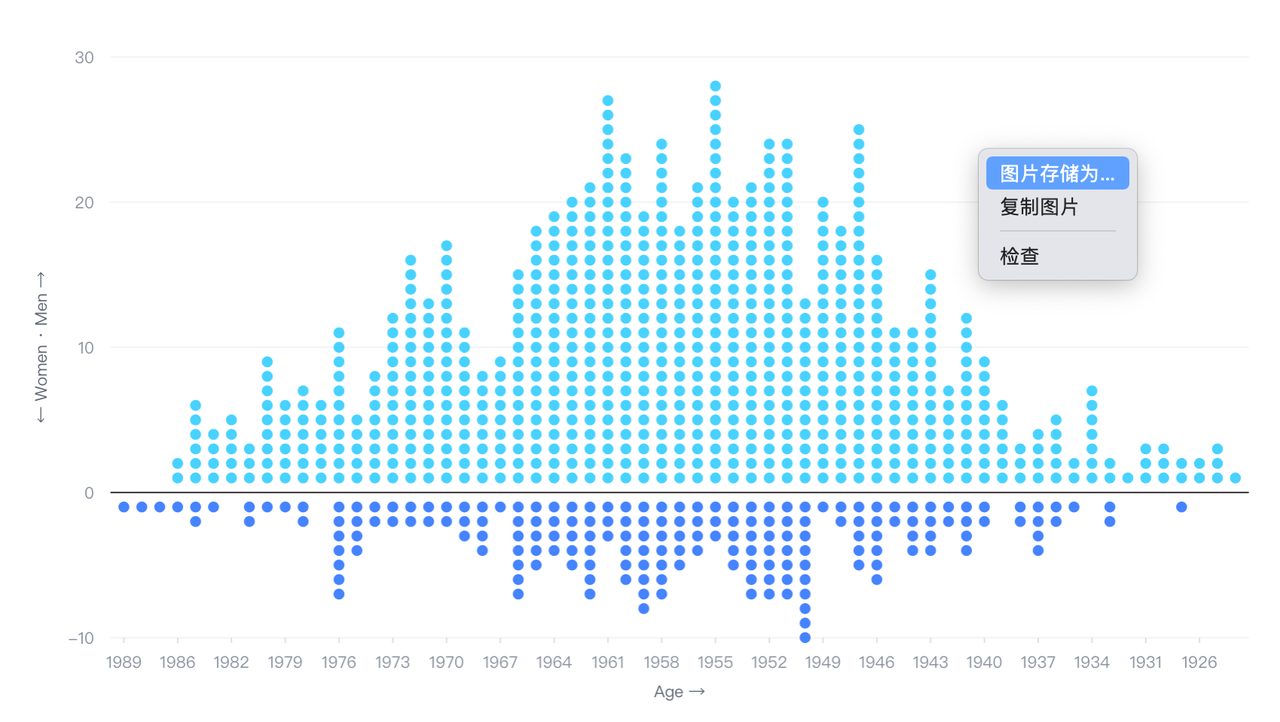
Right-click directly on the chart to save or copy

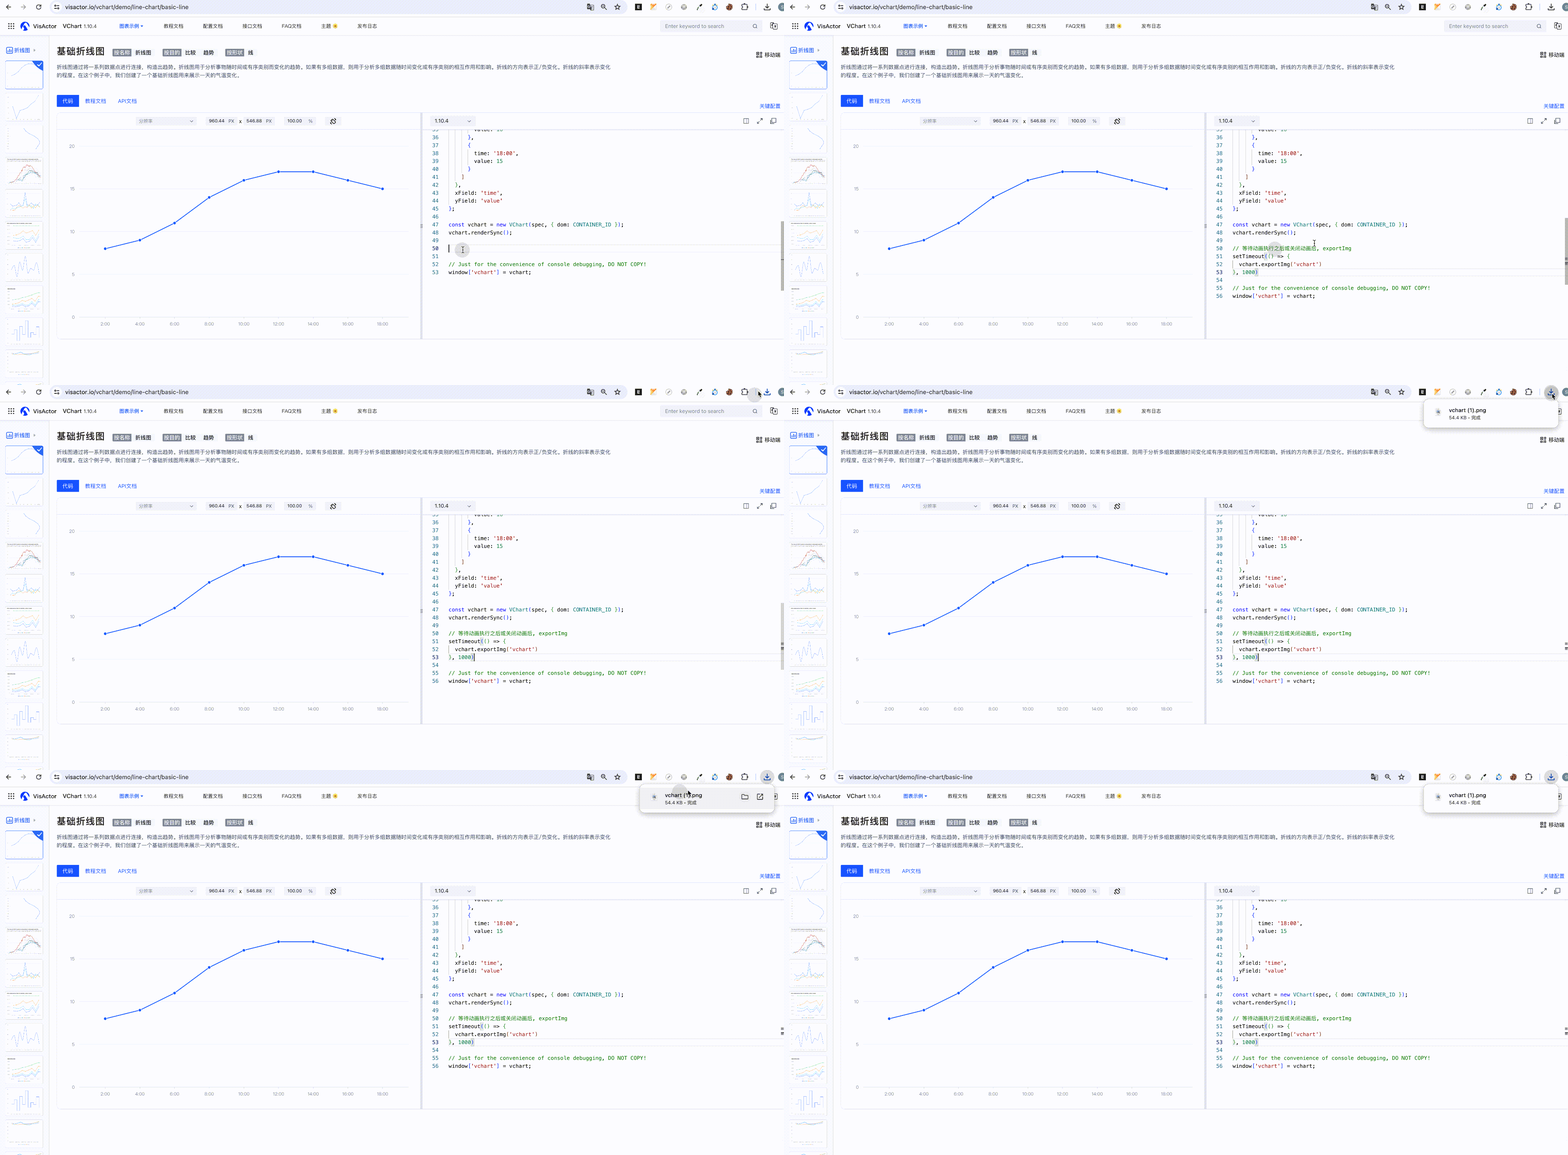
- If you need to get pictures in a software project, we have different interfaces for different code environments
getDataURL
asynchronous methodReturns a data URI that contains the image display.
getDataURL: () => Promise<any>;</br>
exportImg
asynchronous method Export chart images, only support browser side, and parameters at the same time name Pictures can be named.
/**
 * **Asynchronous method** Export chart pictures, only supports browser side.
 * @param name the saved image name
 * @returns
 */
exportImg: (name?: string) => Promise<void>;</br>
exportCanvas
Exporting canvas with chart content is only supported on the browser side. You can use this canvas for secondary processing, such as adding watermarks, etc.
/**
 * Export the canvas with the chart content drawn
 * @returns HTMLCanvasElement
 * @since 1.5.2
 */
exportCanvas: () => HTMLCanvasElement | undefined;</br>
getImageBuffer
Currently only the node environment is supported for node-side image export.
getImageBuffer: () => void;</br>
Code Example
const spec = {
  type: 'line',
  data: {
    values: [
      {
        time: '2:00',
        value: 8
      },
      {
        time: '4:00',
        value: 9
      },
      {
        time: '6:00',
        value: 11
      },
      {
        time: '8:00',
        value: 14
      },
      {
        time: '10:00',
        value: 16
      },
      {
        time: '12:00',
        value: 17
      },
      {
        time: '14:00',
        value: 17
      },
      {
        time: '16:00',
        value: 16
      },
      {
        time: '18:00',
        value: 15
      }
    ]
  },
  xField: 'time',
  yField: 'value'
};

const vchart = new VChart(spec, { dom: CONTAINER_ID });
vchart.renderSync();

// After waiting for the animation to execute or after closing the animation, exportImg
setTimeout(() => {
  vchart.exportImg('vchart')
}, 1000)

// Just for the convenience of console debugging, DO NOT COPY!
window['vchart'] = vchart;</br>
Results
Online demo:https://codesandbox.io/p/sandbox/exportimg-2zvg62?file=%2Fsrc%2Findex.ts%3A58%2C26

Related Documentation
Related api:https://www.visactor.io/vchart/api/API/vchart
github:https://github.com/VisActor/VChart
