How can line and bar charts be displayed at the same time?
Question Description
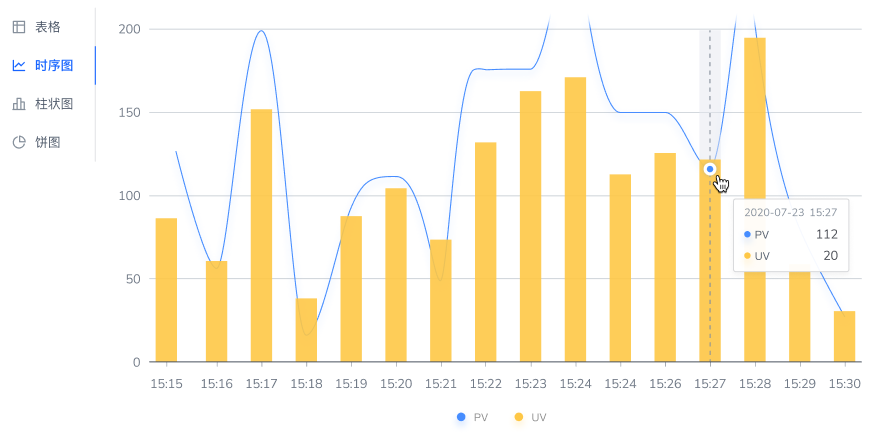
As shown in the picture, I want to add a chart like this to my product, pv is shown in line chart uv is shown in bar chart, how should I implement it?

Solution
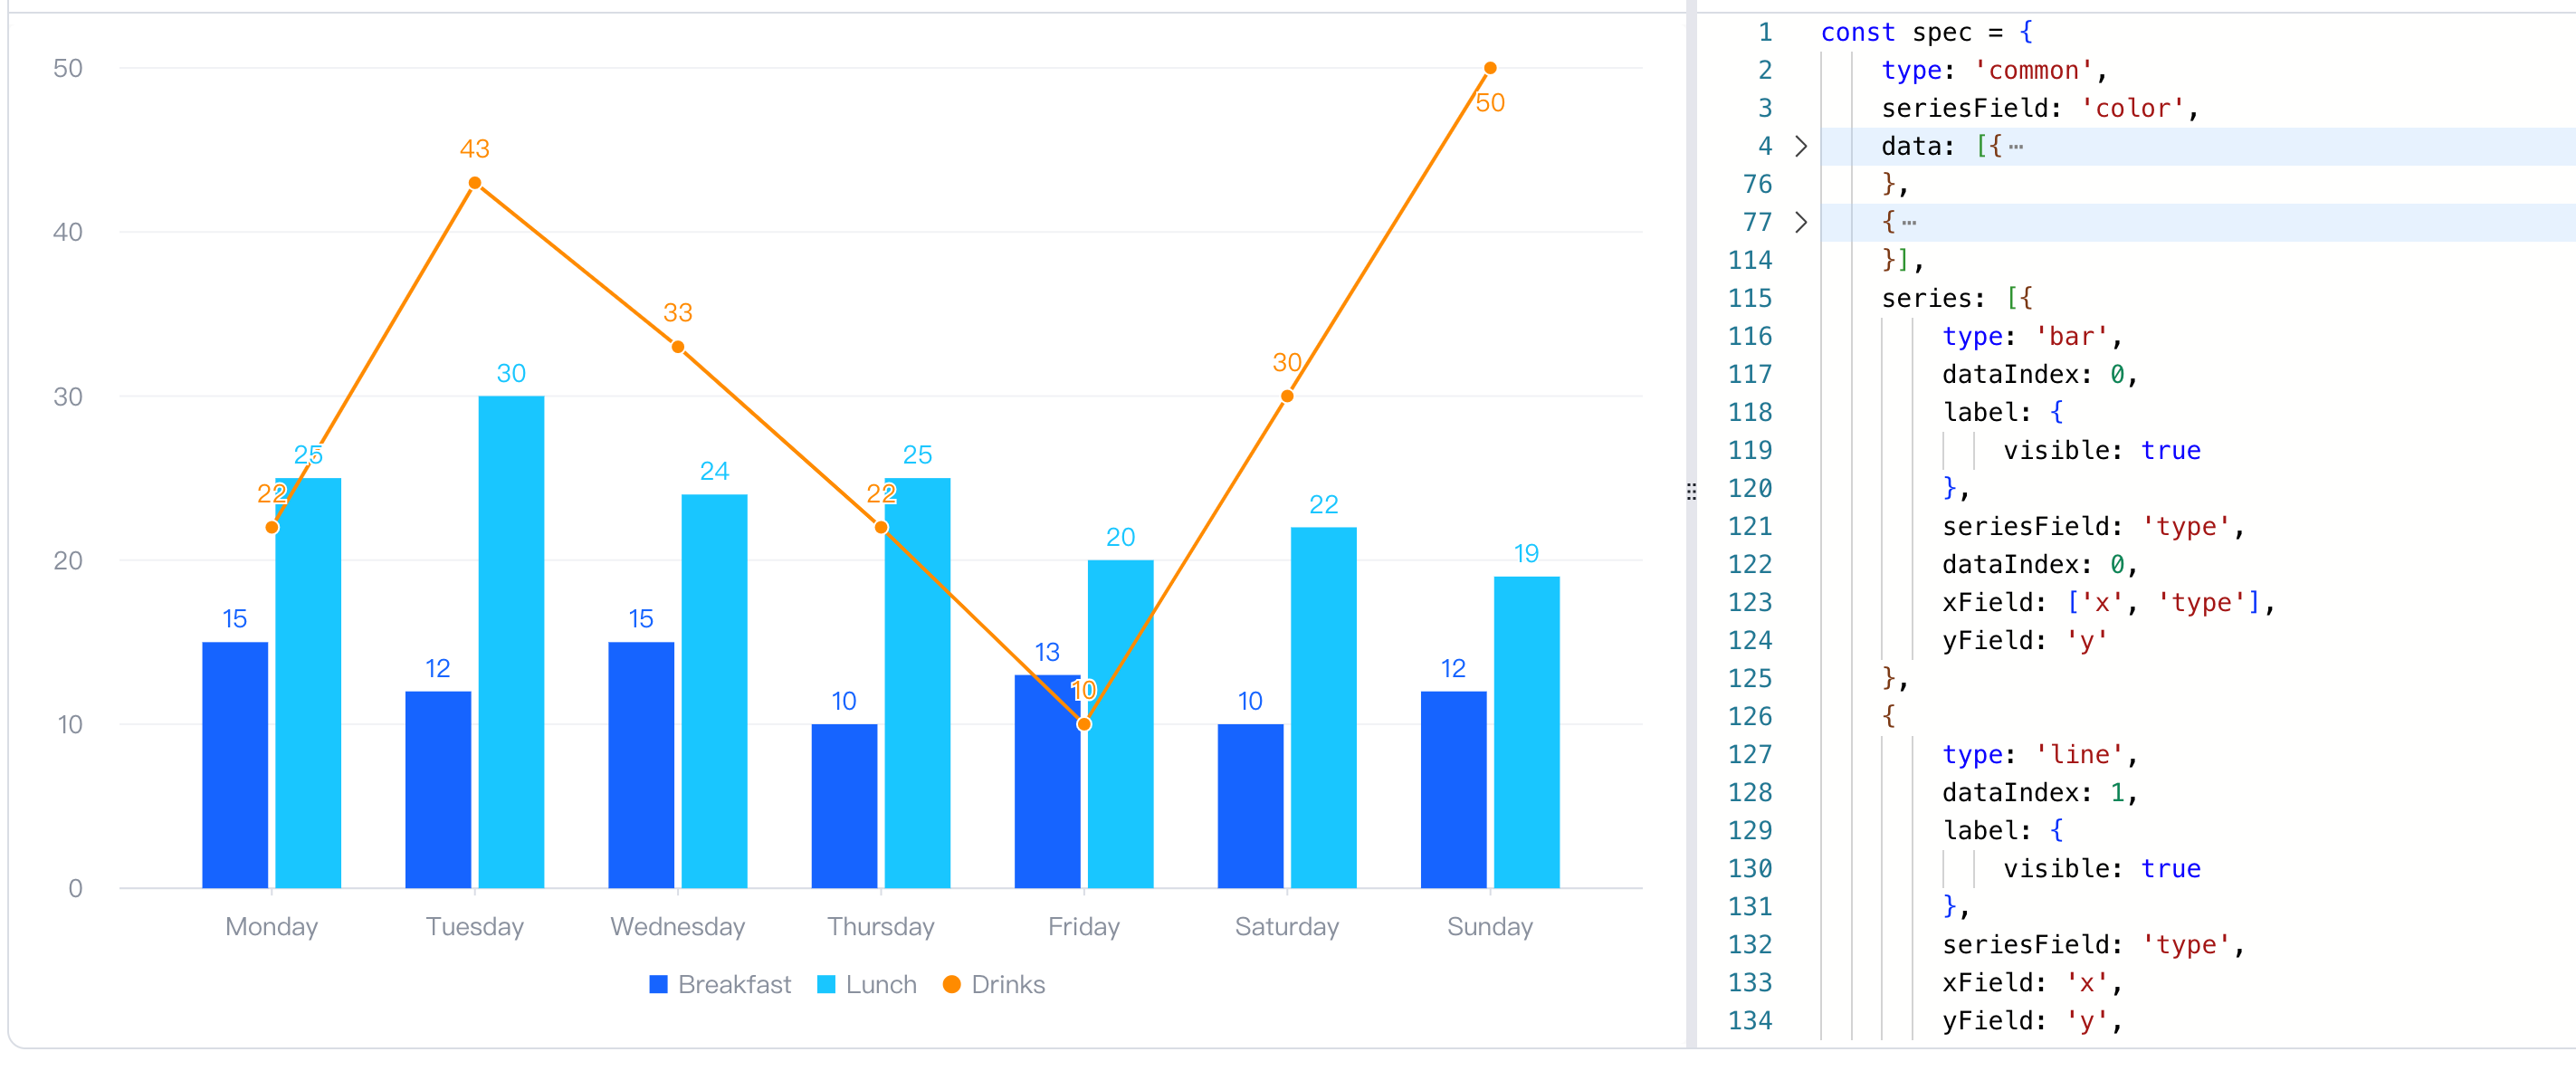
At first, I thought you were trying to make a dual-axis chart, and upon closer inspection I realized that you weren't. A dual-axis chart will have one axis on the left and right sides of the chart, and what you really need is a combined chart, which renders multiple series in a single coordinate system. Not all chart libraries support multi-series plotting. Here I use VChart as an example: Just specify the two series as bar and line, and choose common for the chart type.
Code Example
const spec = {
  type: 'common',
  seriesField: 'color',
  data: [
    {
      id: 'id0',
      values: [
        {
          x: 'Monday',
          type: 'Breakfast',
          y: 15
        },
        {
          x: 'Monday',
          type: 'Lunch',
          y: 25
        },
        {
          x: 'Tuesday',
          type: 'Breakfast',
          y: 12
        },
        {
          x: 'Tuesday',
          type: 'Lunch',
          y: 30
        },
        {
          x: 'Wednesday',
          type: 'Breakfast',
          y: 15
        },
        {
          x: 'Wednesday',
          type: 'Lunch',
          y: 24
        },
        {
          x: 'Thursday',
          type: 'Breakfast',
          y: 10
        },
        {
          x: 'Thursday',
          type: 'Lunch',
          y: 25
        },
        {
          x: 'Friday',
          type: 'Breakfast',
          y: 13
        },
        {
          x: 'Friday',
          type: 'Lunch',
          y: 20
        },
        {
          x: 'Saturday',
          type: 'Breakfast',
          y: 10
        },
        {
          x: 'Saturday',
          type: 'Lunch',
          y: 22
        },
        {
          x: 'Sunday',
          type: 'Breakfast',
          y: 12
        },
        {
          x: 'Sunday',
          type: 'Lunch',
          y: 19
        }
      ]
    },
    {
      id: 'id1',
      values: [
        {
          x: 'Monday',
          type: 'Drinks',
          y: 22
        },
        {
          x: 'Tuesday',
          type: 'Drinks',
          y: 43
        },
        {
          x: 'Wednesday',
          type: 'Drinks',
          y: 33
        },
        {
          x: 'Thursday',
          type: 'Drinks',
          y: 22
        },
        {
          x: 'Friday',
          type: 'Drinks',
          y: 10
        },
        {
          x: 'Saturday',
          type: 'Drinks',
          y: 30
        },
        {
          x: 'Sunday',
          type: 'Drinks',
          y: 50
        }
      ]
    }
  ],
  series: [
    {
      type: 'bar',
      dataIndex: 0,
      label: {
        visible: true
      },
      seriesField: 'type',
      dataIndex: 0,
      xField: ['x', 'type'],
      yField: 'y'
    },
    {
      type: 'line',
      dataIndex: 1,
      label: {
        visible: true
      },
      seriesField: 'type',
      xField: 'x',
      yField: 'y',
      stack: false
    }
  ],
  axes: [
    {
      orient: 'left'
    },
    {
      orient: 'bottom',
      label: {
        visible: true
      },
      type: 'band'
    }
  ],
  legends: {
    visible: true,
    orient: 'bottom'
  }
};
Result

Demo: https://visactor.io/vchart/demo/combination/single-region?keyword=commonChart
Quote
Common Chart option: https://visactor.io/vchart/option/commonChart
github: https://github.com/VisActor/VChart
Series tutorials: https://visactor.io/vchart/guide/tutorial_docs/Chart_Concepts/Series/Composition_and_Effect_of_Series
