Title
When using stacked bar charts, how to get all data in the same dimension as the clicked bar in the click event?
Description
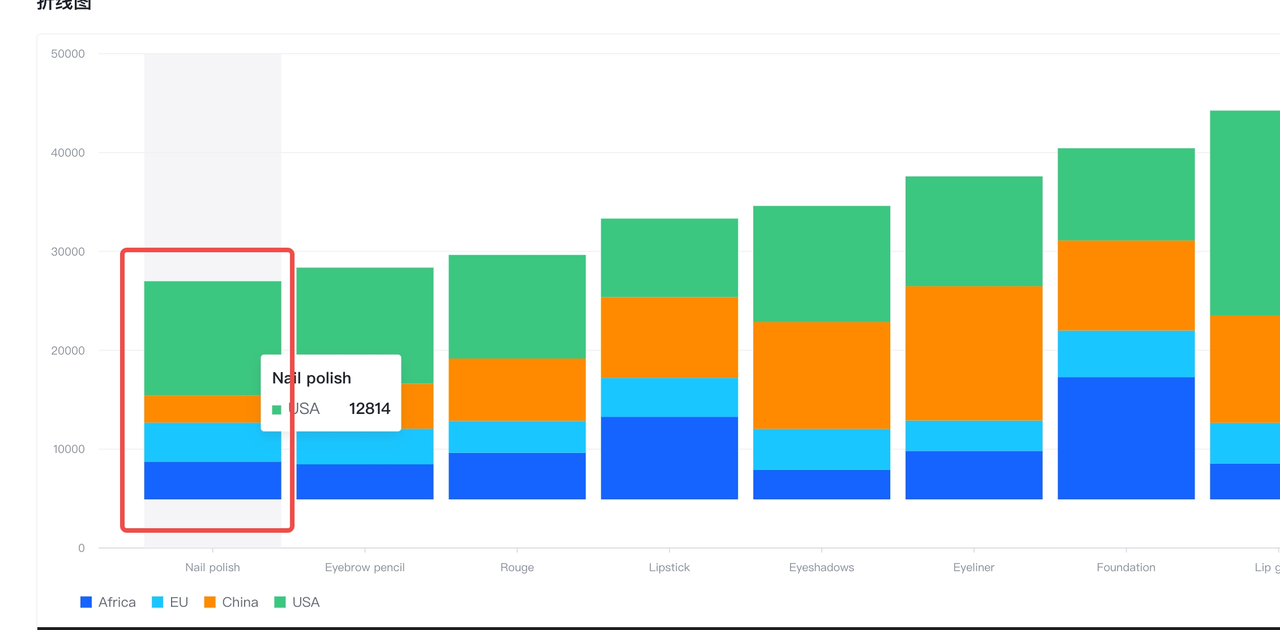
When using a stacked bar chart, how to get all the data in the same dimension as the clicked bar in the click event? For example, clicking on the first bar returns four pieces of data represented by the blue, cyan, red, and green legends.

Solution
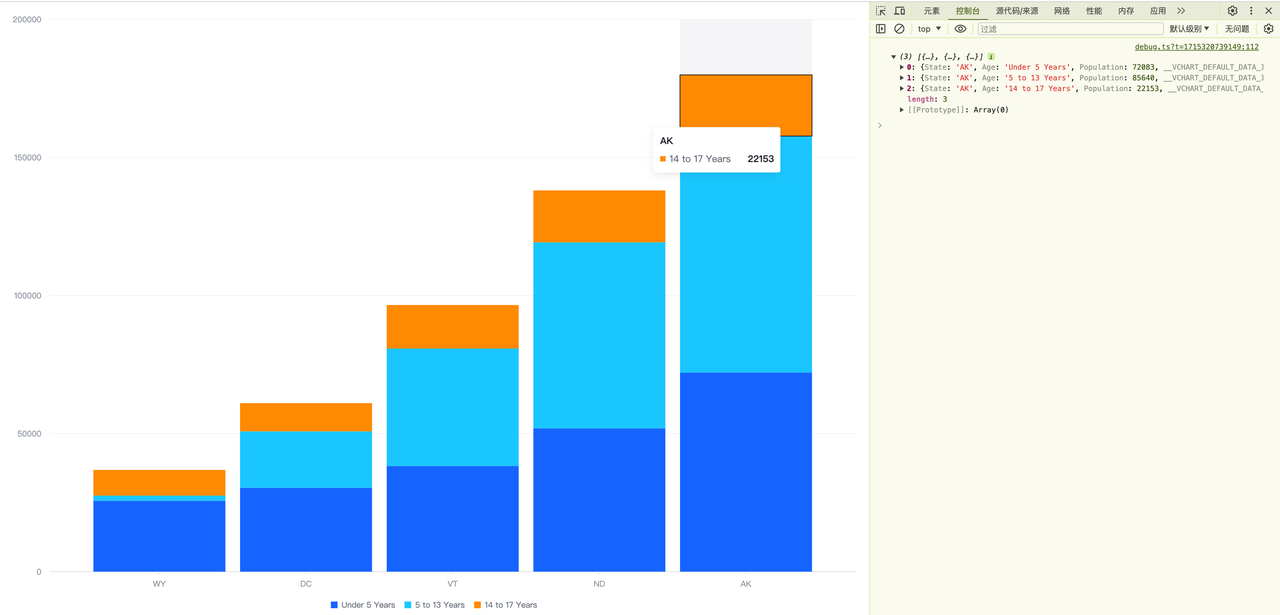
In VChart, you can first obtain the x-axis dimension information of the clicked column by listening to the click event of the column, then obtain the data of the current chart through the API or directly using the original data source (if you can get it), and then filter out the column data with the same x-axis dimension information. As follows:
// Listen to the click event of the bar primitive
vchart.on('click', { markName: 'bar', level: 'mark' }, (e: any) => {
  const datum = e.datum as any; // Get information about the clicked column
  const chartSpec = e.chart?.getSpec(); // If you can't get the current spec, you can get the original spec in this way.
  const xDimensionValue = datum[chartSpec.xField];
  const chartData = e.chart.chartData.getSeriesData().latestData; // If you can get the original data source, you can also get the original data source directly.
  const filterData = chartData.filter(chartDatum => chartDatum[chartSpec.xField] === xDimensionValue);

  console.log(filterData);
});
</br>
Code Example
const spec = {
  type: 'bar',
  data: [
    {
      id: 'barData',
      values: [
        {
          State: 'WY',
          Age: 'Under 5 Years',
          Population: 25635
        },
        {
          State: 'WY',
          Age: '5 to 13 Years',
          Population: 1890
        },
        {
          State: 'WY',
          Age: '14 to 17 Years',
          Population: 9314
        },
        {
          State: 'DC',
          Age: 'Under 5 Years',
          Population: 30352
        },
        {
          State: 'DC',
          Age: '5 to 13 Years',
          Population: 20439
        },
        {
          State: 'DC',
          Age: '14 to 17 Years',
          Population: 10225
        },
        {
          State: 'VT',
          Age: 'Under 5 Years',
          Population: 38253
        },
        {
          State: 'VT',
          Age: '5 to 13 Years',
          Population: 42538
        },
        {
          State: 'VT',
          Age: '14 to 17 Years',
          Population: 15757
        },
        {
          State: 'ND',
          Age: 'Under 5 Years',
          Population: 51896
        },
        {
          State: 'ND',
          Age: '5 to 13 Years',
          Population: 67358
        },
        {
          State: 'ND',
          Age: '14 to 17 Years',
          Population: 18794
        },
        {
          State: 'AK',
          Age: 'Under 5 Years',
          Population: 72083
        },
        {
          State: 'AK',
          Age: '5 to 13 Years',
          Population: 85640
        },
        {
          State: 'AK',
          Age: '14 to 17 Years',
          Population: 22153
        }
      ]
    }
  ],
  xField: 'State',
  yField: 'Population',
  seriesField: 'Age',
  stack: true,
  legends: {
    visible: true
  },
  bar: {
    // The state style of bar
    state: {
      hover: {
        stroke: '#000',
        lineWidth: 1
      }
    }
  }
};

const vchart = new VChart(spec, { dom: 'chart' });
vchart.renderSync();


// 监听 bar 图元的 click 事件
vchart.on('click', { markName: 'bar', level: 'mark' }, (e: any) => {
  const datum = e.datum as any; // 获取被点击的柱子的信息
  const chartSpec = e.chart?.getSpec(); // 如果你无法获取当前的 spec,可以通过该方式获取原始 spec
  const xDimensionValue = datum[chartSpec.xField];
  const chartData = e.chart.chartData.getSeriesData().latestData; // 如果可以拿到原始数据,也可以直接拿原始数据
  const filterData = chartData.filter(chartDatum => chartDatum[chartSpec.xField] === xDimensionValue);

  console.log(filterData);
});</br>
Results

