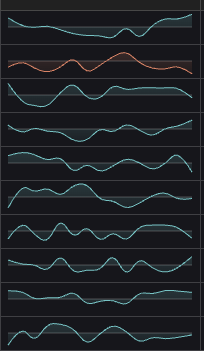
What table components support displaying mini-charts within cells?
Question Description
I would like to have a separate column in the sales statistics table to display mini-line charts that reflect the displayed growth trends, similar to the daily candlestick list in stock charts.

Solution
VTable can configure the columnType as "sparkline" to display cells as mini-charts. The specific style of the mini-charts can be set using sparklineSpec. The advantage is that the integration of charts and tables creates a seamless experience without a sense of detachment, providing optimal performance and user experience.
Code Example
Results

