!!!###!!!title=12.How to achieve color gradient effect on table component?——VisActor/VTable FAQ documents!!!###!!!

How to achieve color gradient effect on table component?

Question Description

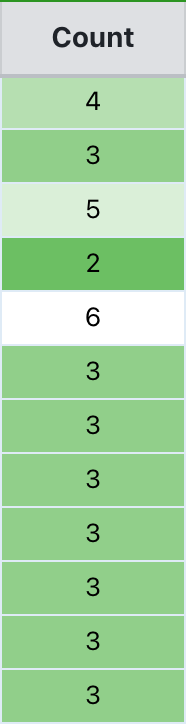
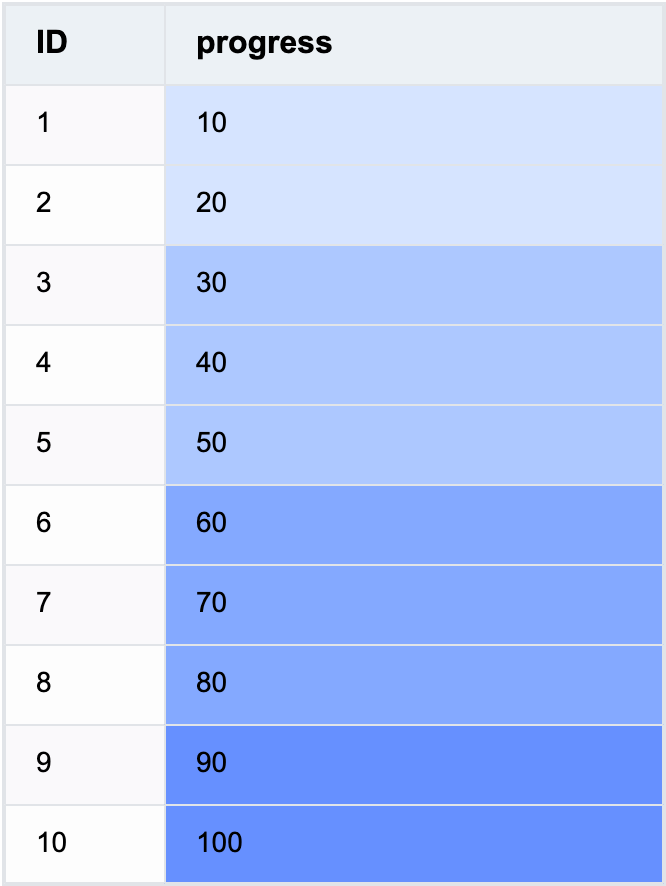
The background of the cells on the table is displayed in different colors according to different data, realizing a color scale effect. How to achieve this effect on VTable?

Solution

You can achieve the color scale effect by setting bgColor in style as a function in columns and returning different color values based on different data:

const BG_COLOR = (args: TYPES.StylePropertyFunctionArg): string => {
  const num = args.value;
  if (Number(num) > 80) {
    return '#6690FF';
  }
  if (Number(num) > 50) {
    return '#84A9FF';
  }
  if (Number(num) > 20) {
    return '#ADC8FF';
  }
  return '#D6E4FF';
};

const columns = [
  {
    style: {
      bgColor: BG_COLOR
    }
  }
];

Code Example

const BG_COLOR = (args: TYPES.StylePropertyFunctionArg): string => {
  const num = args.value;
  if (Number(num) > 80) {
    return '#6690FF';
  }
  if (Number(num) > 50) {
    return '#84A9FF';
  }
  if (Number(num) > 20) {
    return '#ADC8FF';
  }
  return '#D6E4FF';
};

const columns = [
  {
    field: 'id',
    title: 'ID',
    width: 80
  },
  {
    field: 'value',
    title: 'progress',
    style: {
      bgColor: BG_COLOR
    },
    width: 250
  }
];
const option: TYPES.ListTableConstructorOptions = {
  records,
  columns
};
new ListTable(document.getElementById('container'), option);

Results

Online demo

Quote