It is not only a fully functional graph visualization library, but also an explorer of data relationships.
!!!###!!!title=8.How to insert sparklines in table?——VisActor/VTable FAQ documents!!!###!!!
VTable Usage Issue: How to insert sparklines in table?
Question Description
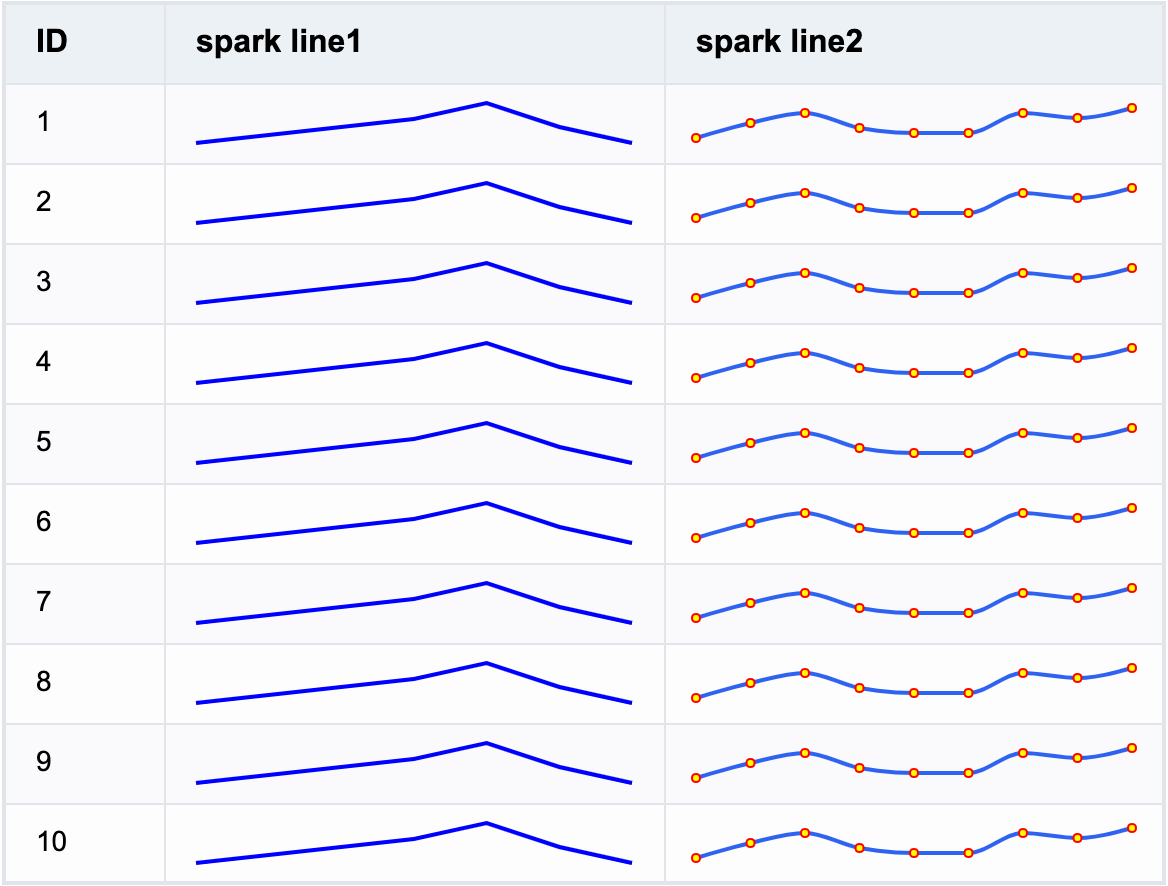
A mini-line chart reflecting the dynamics of a set of data needs to be displayed in a cell in a column of the table. How to achieve this effect in VTable?
Solution
In VTable, you can specify the column to be a sparkline type cell by setting cellType to sparkline in columns.
If the chart is more complex, you can use the PivotChart module to configure the API of VChart.
sparkLine data
The data specified by the sparkline type cell can be an array of numbers (the number will default to y field in the sparkline, and x field will be automatically filled in order), or it can be an array of x, y objects:
sparkline style
In columns, in addition to configuring the cellType as sparkline, you can also configure the sparkline style spec through sparklineSpec (if not configured using default style), and the spec rules refer to VChart: