
Easy To Use By Default
VGRAMMAR
Simple syntax, complete interface, rich components, easy development.

Usage Scenario Introduction

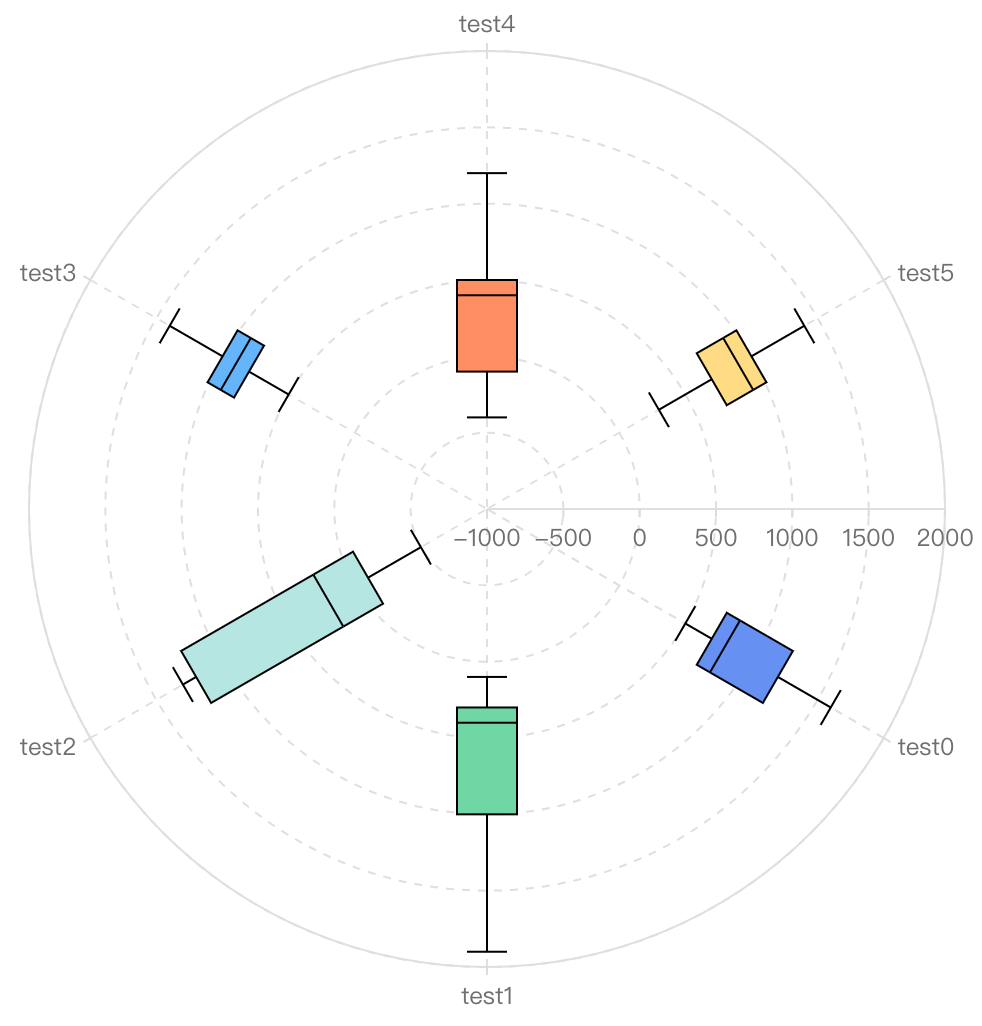
Boxplot
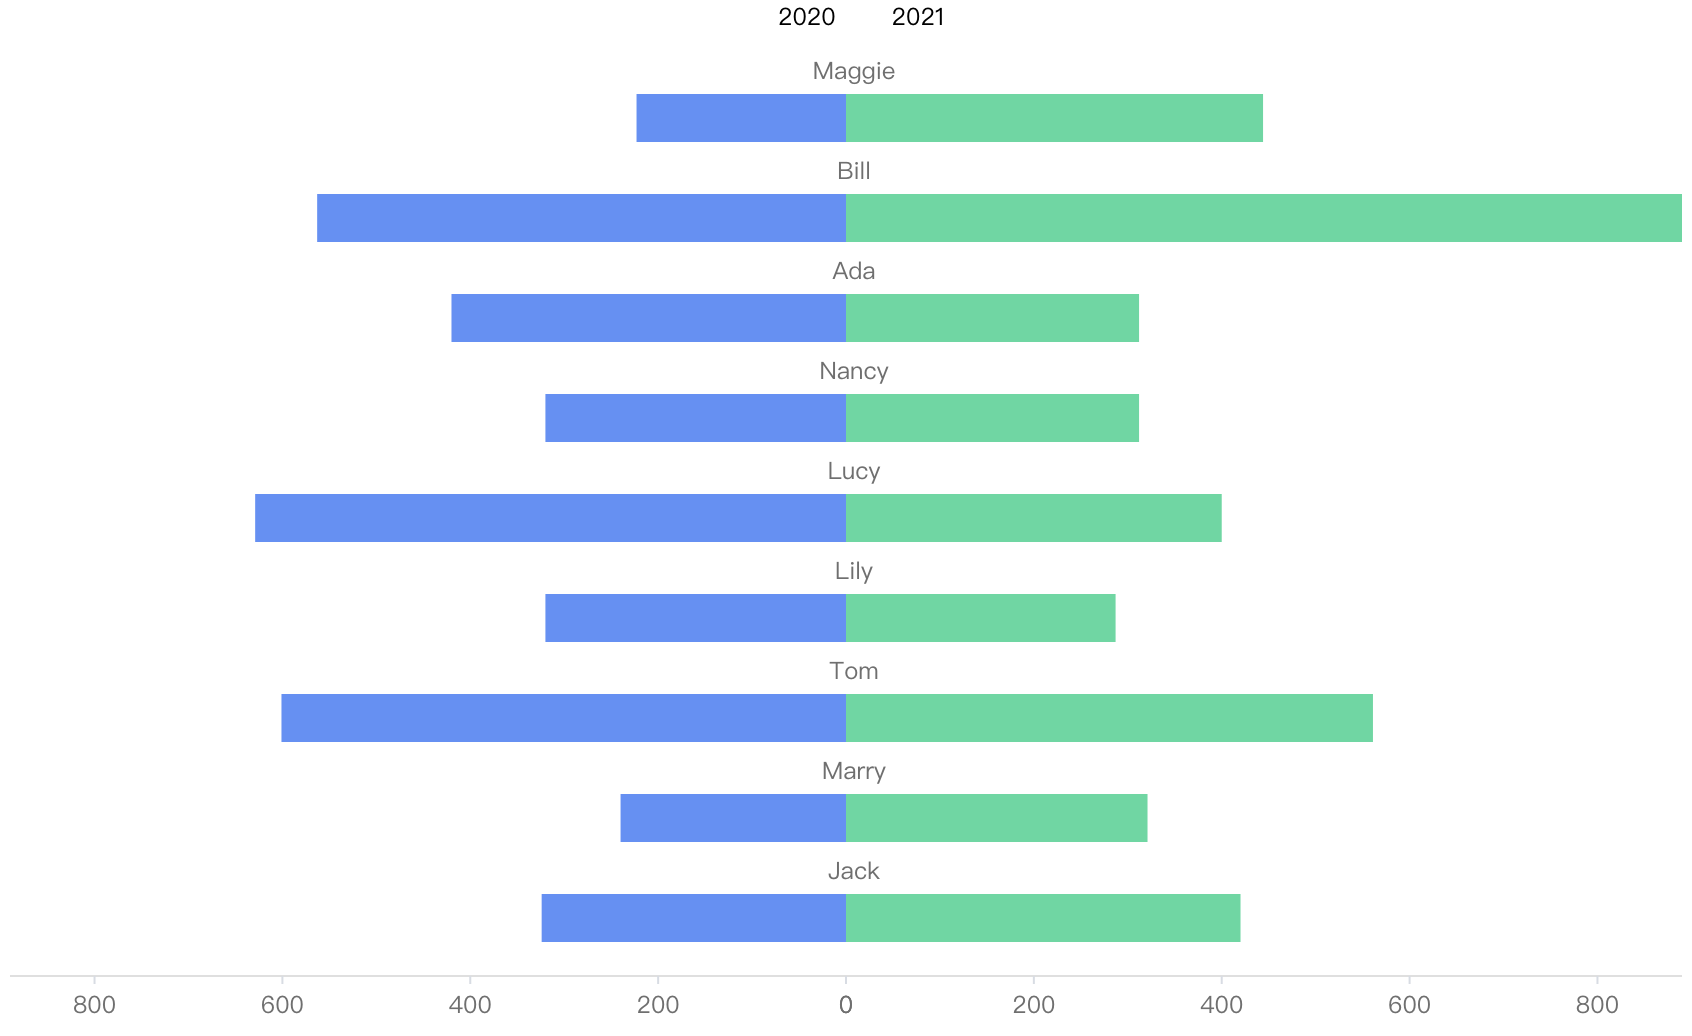
Bidirection Rect
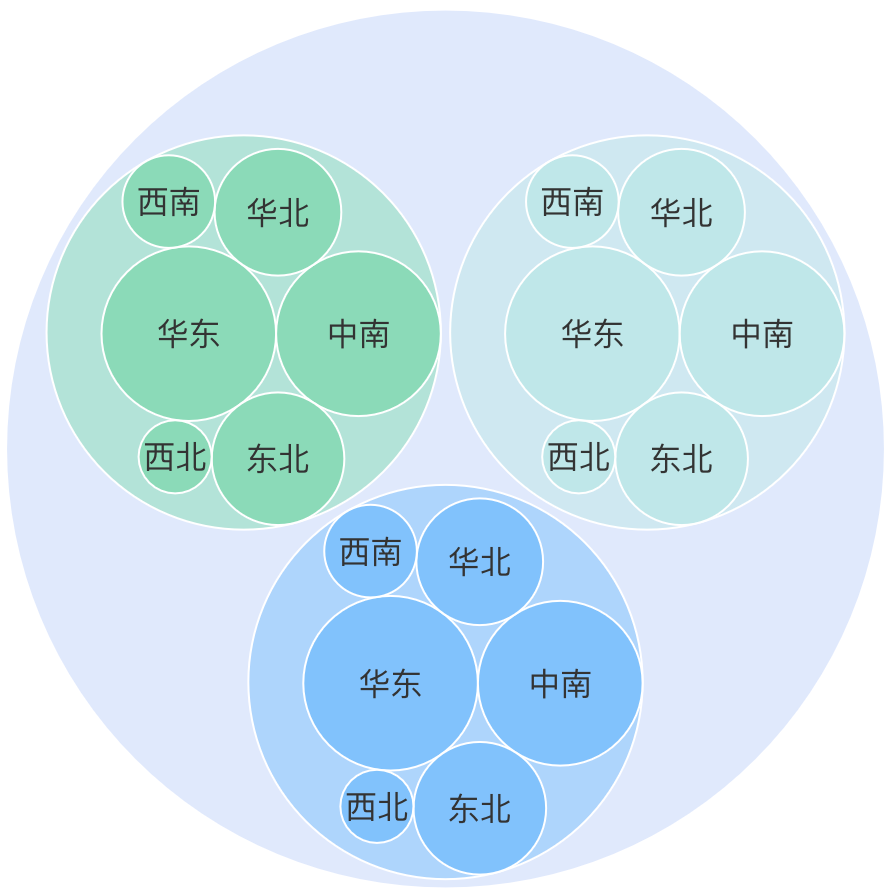
Circle Packing
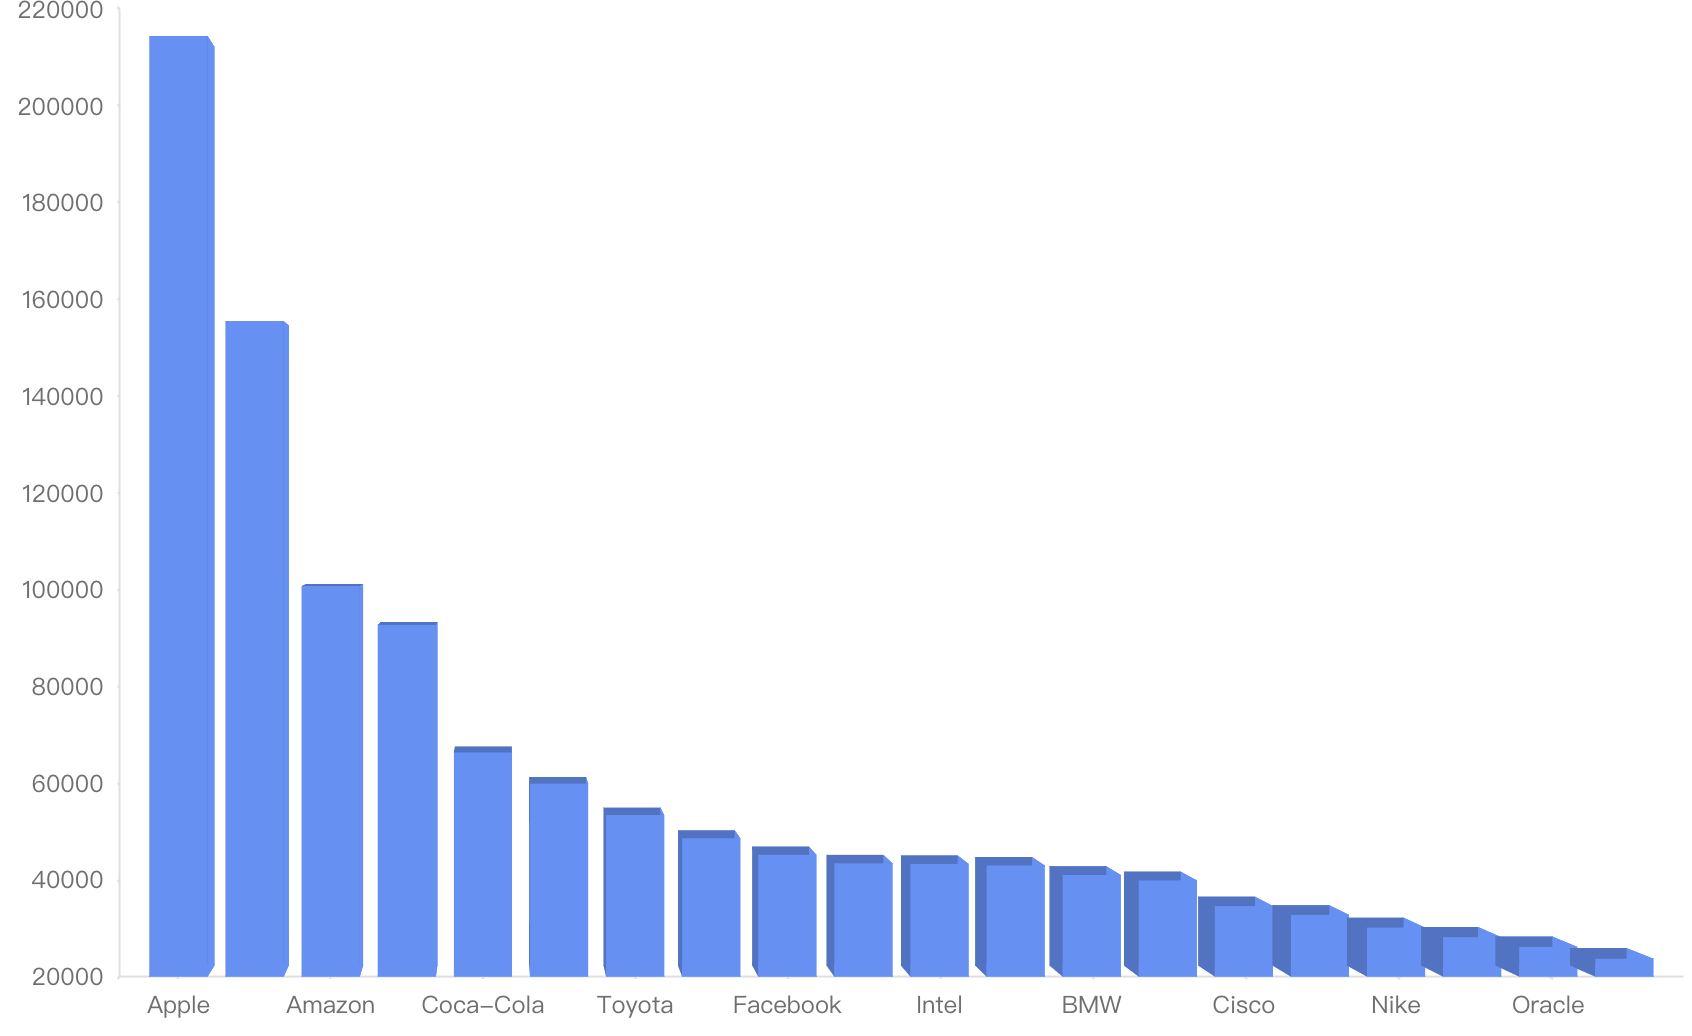
3D Rect Mark
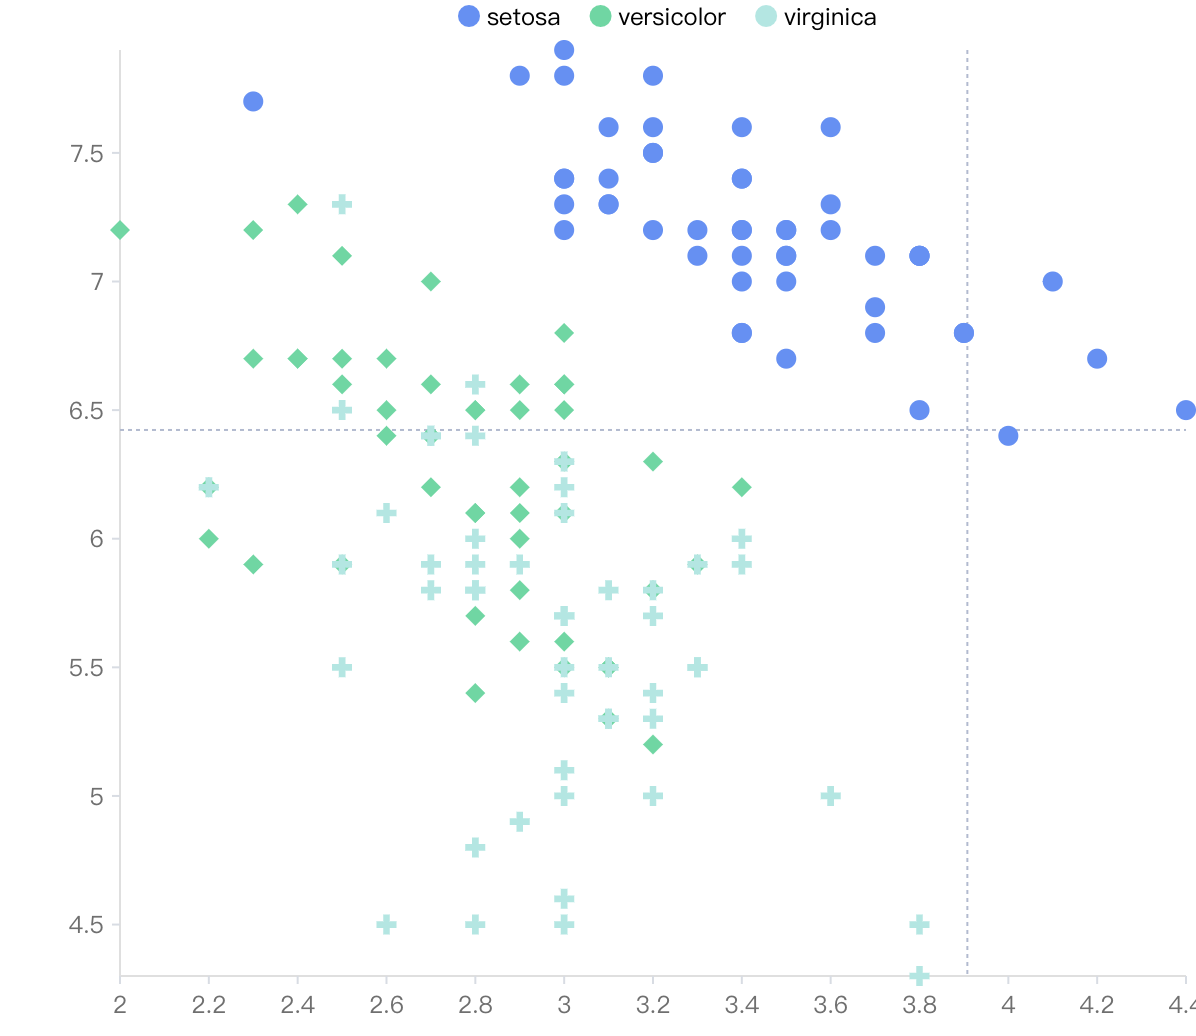
Symbol Mark
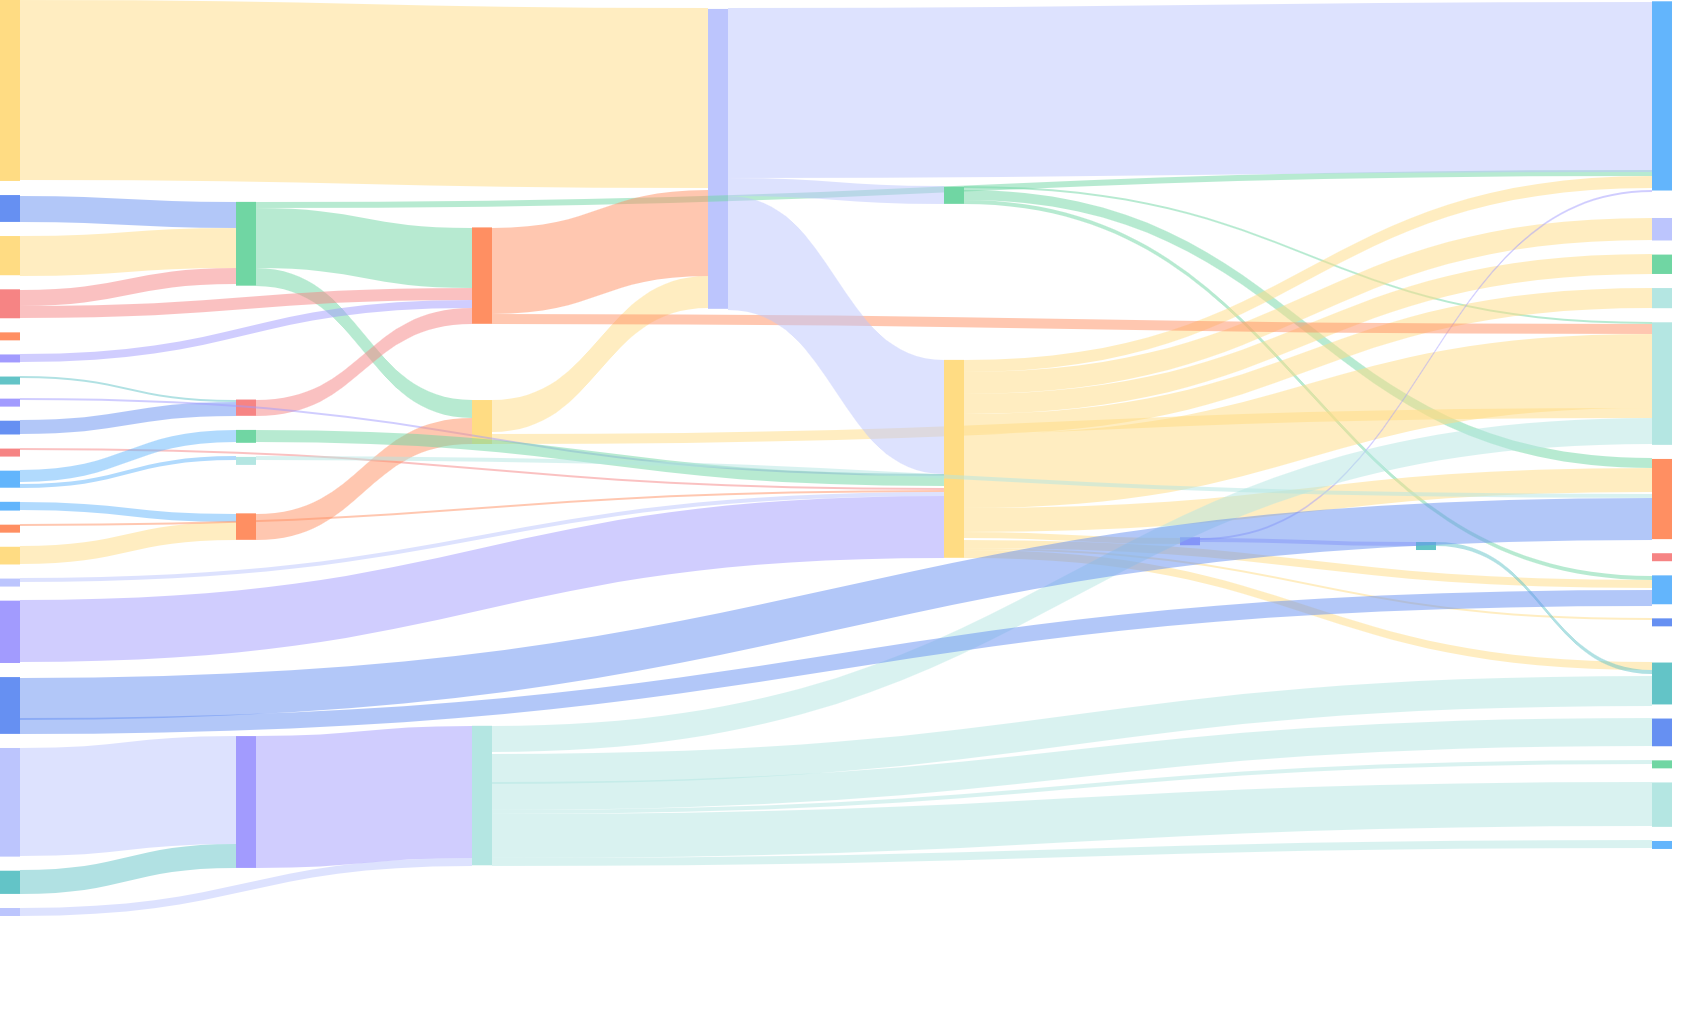
Sankey
They all use
VisActor

Not only an out-of-the-box multi-terminal chart library, but also a vivid and flexible data storyteller.
Not only a high-performance multi-dimensional data analysis form, but also a grid artist created between rows and columns.
It is not only a visual grammar that generates thousands of charts, but also a data magician who turns boring into magic.
Not only a visual rendering engine with rich functions, but also a handy pen.
Simple syntax, complete interface, rich components, easy development.
Usage Scenario Introduction
Boxplot
Bidirection Rect
Circle Packing
3D Rect Mark
Symbol Mark
Sankey
They all use
VisActor
 Volcano Engine
 Lark
Lark TikTok
 CapCut
 Medium
 Observable
 Discord