
v2 Upgrade Guide
Changes
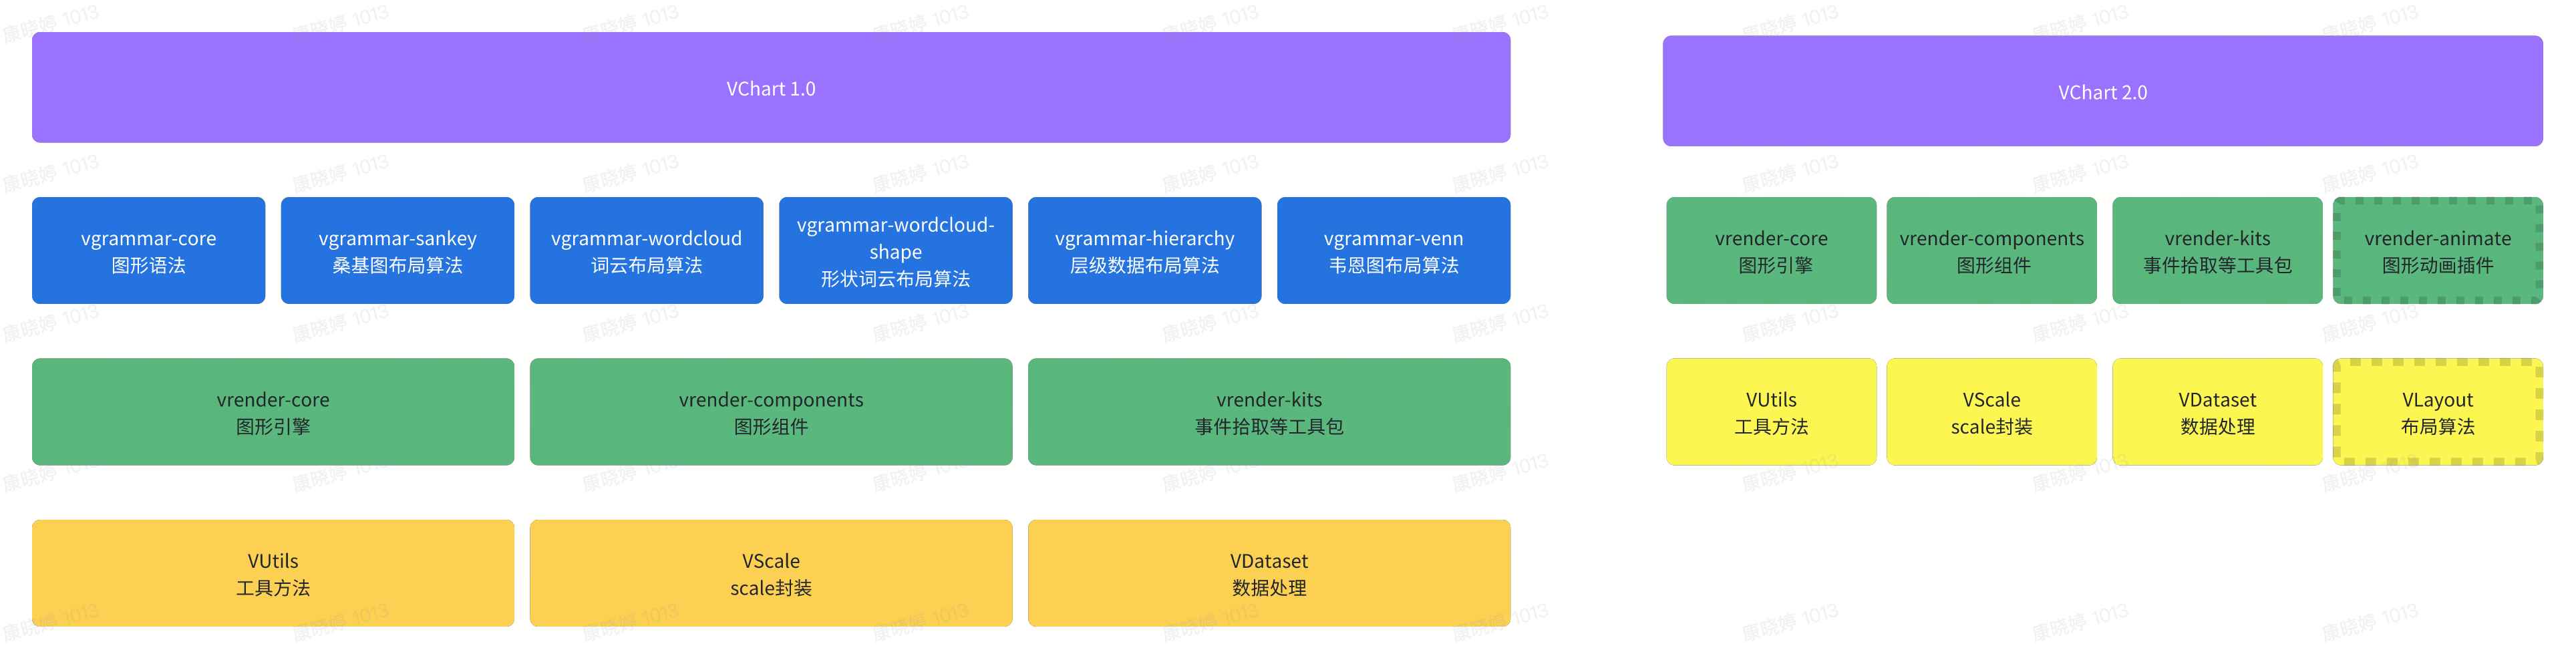
Architecture Change: VChart No Longer Depends on VGrammar
Some Charts Moved to @visactor/vchart-extension
bar3d
- Before
import VChart from '@visactor/vchart';
const spec = {
  type: 'bar3d'
  // ...
};

const vchart = new VChart.default(spec, {
  dom: BUGSERVER_CONTAINER_ID,
  animation: false,
  disableDirtyBounds: true,
  options3d: {
    enable: true
  }
});

await vchart.renderAsync();
- 2.0.0
import VChart from '@visactor/vchart';
import { registerBar3dChart } from '@viscator/vchart-extension';

registerBar3dChart();
const spec = {
  type: 'bar3d'
  // ...
};

// 3d charts are now configured by default with { options3d: {enable: true } }
const vchart = new VChart.default(spec, { dom: BUGSERVER_CONTAINER_ID, animation: false, disableDirtyBounds: true });

await vchart.renderAsync();
funnel3d
- Before
import VChart from '@visactor/vchart';
const spec = {
  type: 'funnel3d'
  // ...
};

const vchart = new VChart.default(spec, {
  dom: BUGSERVER_CONTAINER_ID,
  animation: false,
  disableDirtyBounds: true,
  options3d: {
    enable: true
  }
});

await vchart.renderAsync();
- 2.0.0
import VChart from '@visactor/vchart';
import { registerFunnel3dChart } from '@viscator/vchart-extension';

registerFunnel3dChart();
const spec = {
  type: 'funnel3d'
  // ...
};

// 3d charts are now configured by default with { options3d: {enable: true } }
const vchart = new VChart.default(spec, { dom: BUGSERVER_CONTAINER_ID, animation: false, disableDirtyBounds: true });

await vchart.renderAsync();
histogram3d
- Before
import VChart from '@visactor/vchart';
const spec = {
  type: 'histogram3d'
  // ...
};

const vchart = new VChart.default(spec, {
  dom: BUGSERVER_CONTAINER_ID,
  animation: false,
  disableDirtyBounds: true,
  options3d: {
    enable: true
  }
});

await vchart.renderAsync();
- 2.0.0
import VChart from '@visactor/vchart';
import { registerHistogram3dChart } from '@viscator/vchart-extension';

registerHistogram3dChart();
const spec = {
  type: 'histogram3d'
  // ...
};

// 3d charts are now configured by default with { options3d: {enable: true } }
const vchart = new VChart.default(spec, { dom: BUGSERVER_CONTAINER_ID, animation: false, disableDirtyBounds: true });

await vchart.renderAsync();
pie3d
- Before
import VChart from '@visactor/vchart';
const spec = {
  type: 'pie3d'
  // ...
};

const vchart = new VChart.default(spec, {
  dom: BUGSERVER_CONTAINER_ID,
  animation: false,
  disableDirtyBounds: true,
  options3d: {
    enable: true
  }
});

await vchart.renderAsync();
- 2.0.0
import VChart from '@visactor/vchart';
import { registerPie3dChart } from '@viscator/vchart-extension';

registerPie3dChart();
const spec = {
  type: 'pie3d'
  // ...
};

// 3d charts are now configured by default with { options3d: {enable: true } }
const vchart = new VChart.default(spec, { dom: BUGSERVER_CONTAINER_ID, animation: false, disableDirtyBounds: true });

await vchart.renderAsync();
rangeColumn3d
- Before
import VChart from '@visactor/vchart';
const spec = {
  type: 'rangeColumn3d'
  // ...
};

const vchart = new VChart.default(spec, {
  dom: BUGSERVER_CONTAINER_ID,
  animation: false,
  disableDirtyBounds: true,
  options3d: {
    enable: true
  }
});

await vchart.renderAsync();
- 2.0.0
import VChart from '@visactor/vchart';
import { registerRangeColumn3dChart } from '@viscator/vchart-extension';

registerRangeColumn3dChart();
const spec = {
  type: 'rangeColumn3d'
  // ...
};

// 3d charts are now configured by default with { options3d: {enable: true } }
const vchart = new VChart.default(spec, { dom: BUGSERVER_CONTAINER_ID, animation: false, disableDirtyBounds: true });

await vchart.renderAsync();
wordcloud3d
- Before
import VChart from '@visactor/vchart';
const spec = {
  type: 'wordcloud3d'
  // ...
};

const vchart = new VChart.default(spec, {
  dom: BUGSERVER_CONTAINER_ID,
  animation: false,
  disableDirtyBounds: true,
  options3d: {
    enable: true
  }
});

await vchart.renderAsync();
- 2.0.0
import VChart from '@visactor/vchart';
import { registerWordCloud3dChart, registerWordCloudShape3dChart } from '@viscator/vchart-extension';

registerWordCloud3dChart();
const spec = {
  type: 'wordcloud3d'
  // ...
};

// 3d charts are now configured by default with { options3d: {enable: true } }
const vchart = new VChart.default(spec, { dom: BUGSERVER_CONTAINER_ID, animation: false, disableDirtyBounds: true });

await vchart.renderAsync();
3D Charts in Cartesian Coordinate System
- Before
import VChart, { register3DPlugin } from '@visactor/vchart';

register3DPlugin();
const spec = {
  type: 'area',
  label: { visible: true },
  data: {
    values: [
      { type: 'Nail polish', country: 'Africa', value: 4229 },
      { type: 'Nail polish', country: 'EU', value: 4376 },
      { type: 'Nail polish', country: 'China', value: 3054 },
      { type: 'Nail polish', country: 'USA', value: 12814 },
      { type: 'Eyebrow pencil', country: 'Africa', value: 3932 },
      { type: 'Eyebrow pencil', country: 'EU', value: 3987 },
      { type: 'Eyebrow pencil', country: 'China', value: 5067 },
      { type: 'Eyebrow pencil', country: 'USA', value: 13012 },
      { type: 'Rouge', country: 'Africa', value: 5221 },
      { type: 'Rouge', country: 'EU', value: 3574 },
      { type: 'Rouge', country: 'China', value: 7004 },
      { type: 'Rouge', country: 'USA', value: 11624 },
      { type: 'Lipstick', country: 'Africa', value: 9256 },
      { type: 'Lipstick', country: 'EU', value: 4376 },
      { type: 'Lipstick', country: 'China', value: 9054 },
      { type: 'Lipstick', country: 'USA', value: 8814 },
      { type: 'Eyeshadows', country: 'Africa', value: 3308 },
      { type: 'Eyeshadows', country: 'EU', value: 4572 },
      { type: 'Eyeshadows', country: 'China', value: 12043 },
      { type: 'Eyeshadows', country: 'USA', value: 12998 },
      { type: 'Eyeliner', country: 'Africa', value: 5432 },
      { type: 'Eyeliner', country: 'EU', value: 3417 },
      { type: 'Eyeliner', country: 'China', value: 15067 },
      { type: 'Eyeliner', country: 'USA', value: 12321 },
      { type: 'Foundation', country: 'Africa', value: 13701 },
      { type: 'Foundation', country: 'EU', value: 5231 },
      { type: 'Foundation', country: 'China', value: 10119 },
      { type: 'Foundation', country: 'USA', value: 10342 },
      { type: 'Lip gloss', country: 'Africa', value: 4008 },
      { type: 'Lip gloss', country: 'EU', value: 4572 },
      { type: 'Lip gloss', country: 'China', value: 12043 },
      { type: 'Lip gloss', country: 'USA', value: 22998 },
      { type: 'Mascara', country: 'Africa', value: 18712 },
      { type: 'Mascara', country: 'EU', value: 6134 },
      { type: 'Mascara', country: 'China', value: 10419 },
      { type: 'Mascara', country: 'USA', value: 11261 }
    ]
  },
  title: {
    visible: true,
    text: 'Unstacked area chart of cosmetic products sales'
  },
  stack: false,
  xField: 'type',
  yField: 'value',
  zField: 'country',
  seriesField: 'country',
  legends: [{ visible: true, position: 'middle', orient: 'bottom' }],
  axes: [
    {
      orient: 'bottom',
      mode: '3d'
    },
    {
      orient: 'left',
      mode: '3d'
    },
    {
      orient: 'z',
      mode: '3d',
      label: { visible: true },
      type: 'band',
      grid: { visible: true },
      width: 600,
      height: 200,
      depth: 200
    }
  ],
  crosshair: {
    xField: { visible: false }
  }
};

const vchart = new VChart.default(spec, {
  dom: BUGSERVER_CONTAINER_ID,
  animation: false,
  disableDirtyBounds: true,
  options3d: {
    enable: true
  }
});

await vchart.renderAsync();
- 2.0.0
import VChart from '@visactor/vchart';
import { registerAxis3dPlugin } from '@visactor/vchart-extension';

registerAxis3dPlugin();

const spec = {
  type: 'area',
  label: { visible: true },
  data: {
    values: [
      { type: 'Nail polish', country: 'Africa', value: 4229 },
      { type: 'Nail polish', country: 'EU', value: 4376 },
      { type: 'Nail polish', country: 'China', value: 3054 },
      { type: 'Nail polish', country: 'USA', value: 12814 },
      { type: 'Eyebrow pencil', country: 'Africa', value: 3932 },
      { type: 'Eyebrow pencil', country: 'EU', value: 3987 },
      { type: 'Eyebrow pencil', country: 'China', value: 5067 },
      { type: 'Eyebrow pencil', country: 'USA', value: 13012 },
      { type: 'Rouge', country: 'Africa', value: 5221 },
      { type: 'Rouge', country: 'EU', value: 3574 },
      { type: 'Rouge', country: 'China', value: 7004 },
      { type: 'Rouge', country: 'USA', value: 11624 },
      { type: 'Lipstick', country: 'Africa', value: 9256 },
      { type: 'Lipstick', country: 'EU', value: 4376 },
      { type: 'Lipstick', country: 'China', value: 9054 },
      { type: 'Lipstick', country: 'USA', value: 8814 },
      { type: 'Eyeshadows', country: 'Africa', value: 3308 },
      { type: 'Eyeshadows', country: 'EU', value: 4572 },
      { type: 'Eyeshadows', country: 'China', value: 12043 },
      { type: 'Eyeshadows', country: 'USA', value: 12998 },
      { type: 'Eyeliner', country: 'Africa', value: 5432 },
      { type: 'Eyeliner', country: 'EU', value: 3417 },
      { type: 'Eyeliner', country: 'China', value: 15067 },
      { type: 'Eyeliner', country: 'USA', value: 12321 },
      { type: 'Foundation', country: 'Africa', value: 13701 },
      { type: 'Foundation', country: 'EU', value: 5231 },
      { type: 'Foundation', country: 'China', value: 10119 },
      { type: 'Foundation', country: 'USA', value: 10342 },
      { type: 'Lip gloss', country: 'Africa', value: 4008 },
      { type: 'Lip gloss', country: 'EU', value: 4572 },
      { type: 'Lip gloss', country: 'China', value: 12043 },
      { type: 'Lip gloss', country: 'USA', value: 22998 },
      { type: 'Mascara', country: 'Africa', value: 18712 },
      { type: 'Mascara', country: 'EU', value: 6134 },
      { type: 'Mascara', country: 'China', value: 10419 },
      { type: 'Mascara', country: 'USA', value: 11261 }
    ]
  },
  title: {
    visible: true,
    text: 'Unstacked area chart of cosmetic products sales'
  },
  stack: false,
  xField: 'type',
  yField: 'value',
  zField: 'country',
  seriesField: 'country',
  legends: [{ visible: true, position: 'middle', orient: 'bottom' }],
  axes: [
    {
      orient: 'bottom',
      mode: '3d'
    },
    {
      orient: 'left',
      mode: '3d'
    },
    {
      orient: 'z',
      mode: '3d',
      label: { visible: true },
      type: 'band',
      grid: { visible: true },
      width: 600,
      height: 200,
      depth: 200
    }
  ],
  crosshair: {
    xField: { visible: false }
  }
};

// 3d charts are now configured by default with { options3d: {enable: true } }
const vchart = new VChart.default(spec, { dom: BUGSERVER_CONTAINER_ID, animation: false, disableDirtyBounds: true });

await vchart.renderAsync();
pictogram Chart
Pictogram registration method is now imported from vchart-extension
- Before
import VChart, { registerPictogramChart } from '@visactor/vchart';

registerPictogramChart();
const spec = {
  type: 'pictogram'
  // ...
};

const vchart = new VChart.default(spec, { dom: BUGSERVER_CONTAINER_ID });

await vchart.renderAsync();
- 2.0.0
import VChart from '@visactor/vchart';
import { registerPictogramChart, getSVGSource } from '@visactor/vchart-extension';

registerPictogramChart();

const spec = {
  type: 'pictogram'
  // ...
};
const vchart = new VChart.default(spec, { dom: BUGSERVER_CONTAINER_ID });

await vchart.renderAsync();
Static method VChart.getSVG() has been removed
- Before
import VChart from '@visactor/vchart';
const mySvgSource = VChart.getSVG('name');
- 2.0.0
import { getSVGSource } from '@visactor/vchart-extension';

const mySvgSource = getSVGSource('name');
imageCloud Mark (New in 2.0)
Map-label Moved to @visactor/vchart-extension
- Before
const spec = {
  mapLabel: {
    visible: true,
    position: 'outer',
    seriesId: 'scatter',
    nameField: 'name',
    valueField: 'value',
    space: 6
    // ...
  }
};
- 2.0.0
import { registerMapLabel } from '@visactor/vchart-extension';

registerMapLabel();

const spec = {
  mapLabel: {
    visible: true,
    position: 'outer',
    seriesId: 'scatter',
    nameField: 'name',
    valueField: 'value',
    space: 6
    // ...
  }
};
API Updates for Advanced Usage
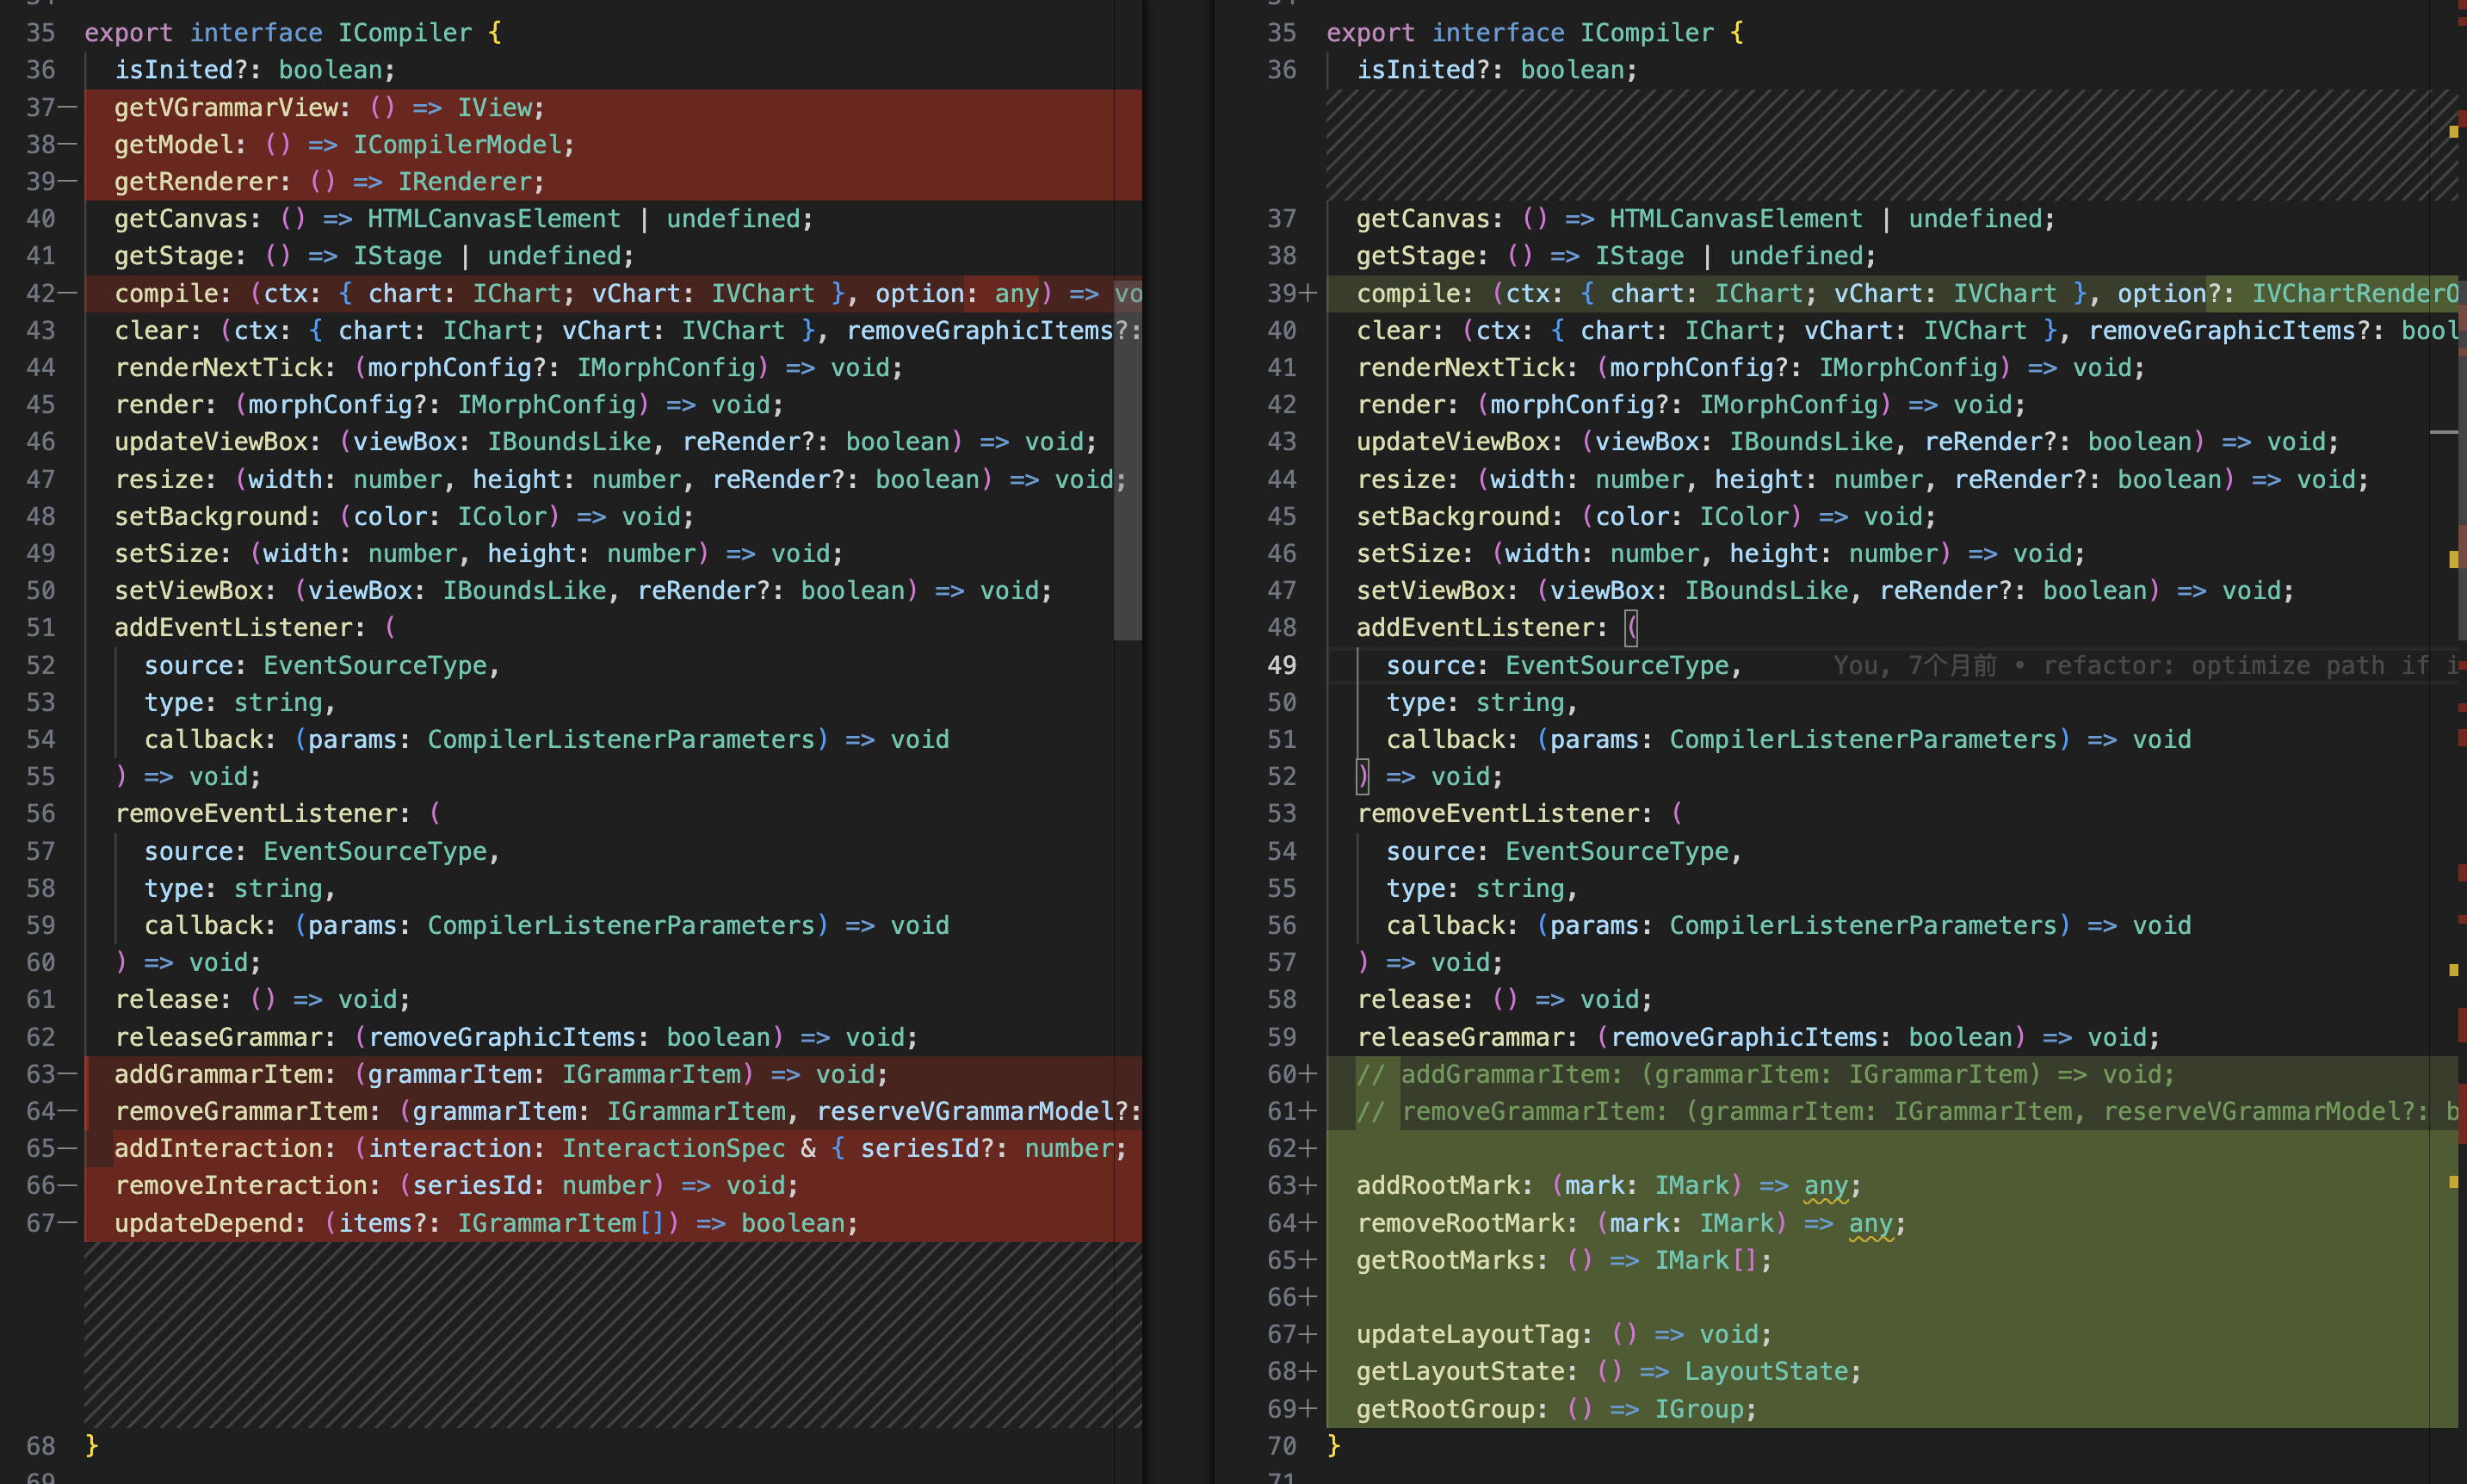
vgrammar View Related APIs Removed
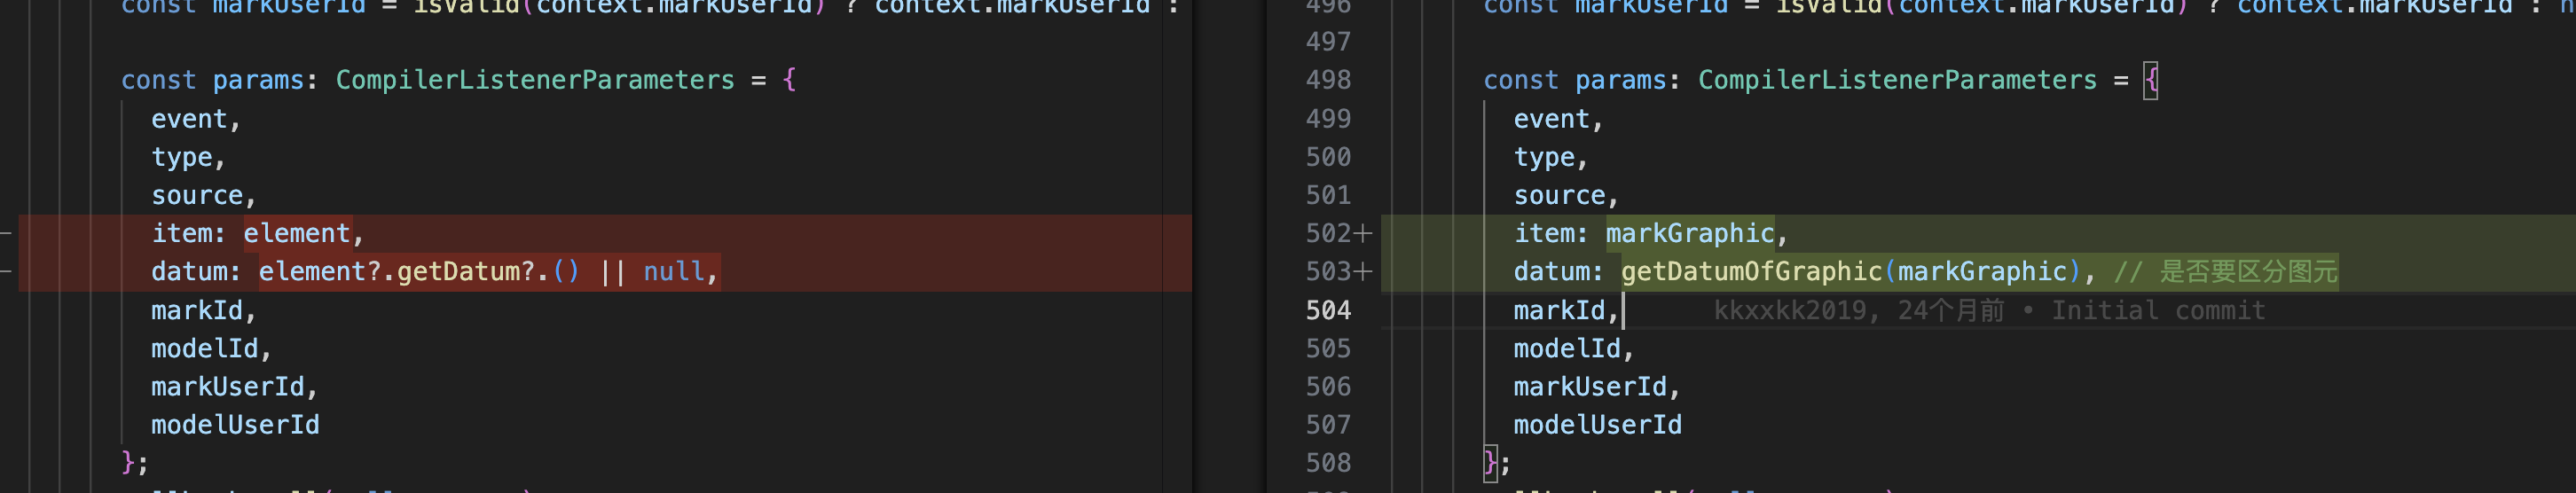
Event Callback Parameters
Change: The item in event parameters is now the graphic element that triggered the event, instead of a vgrammar element.
- Before
vchart.on('dimensionClick', (e) => {
  e.item.graphicItem.setAttributes({ fill: 'red' });
})
- 2.0.0
vchart.on('dimensionClick', (e) => {
  e.item?.setAttributes({ fill: 'red' });
})
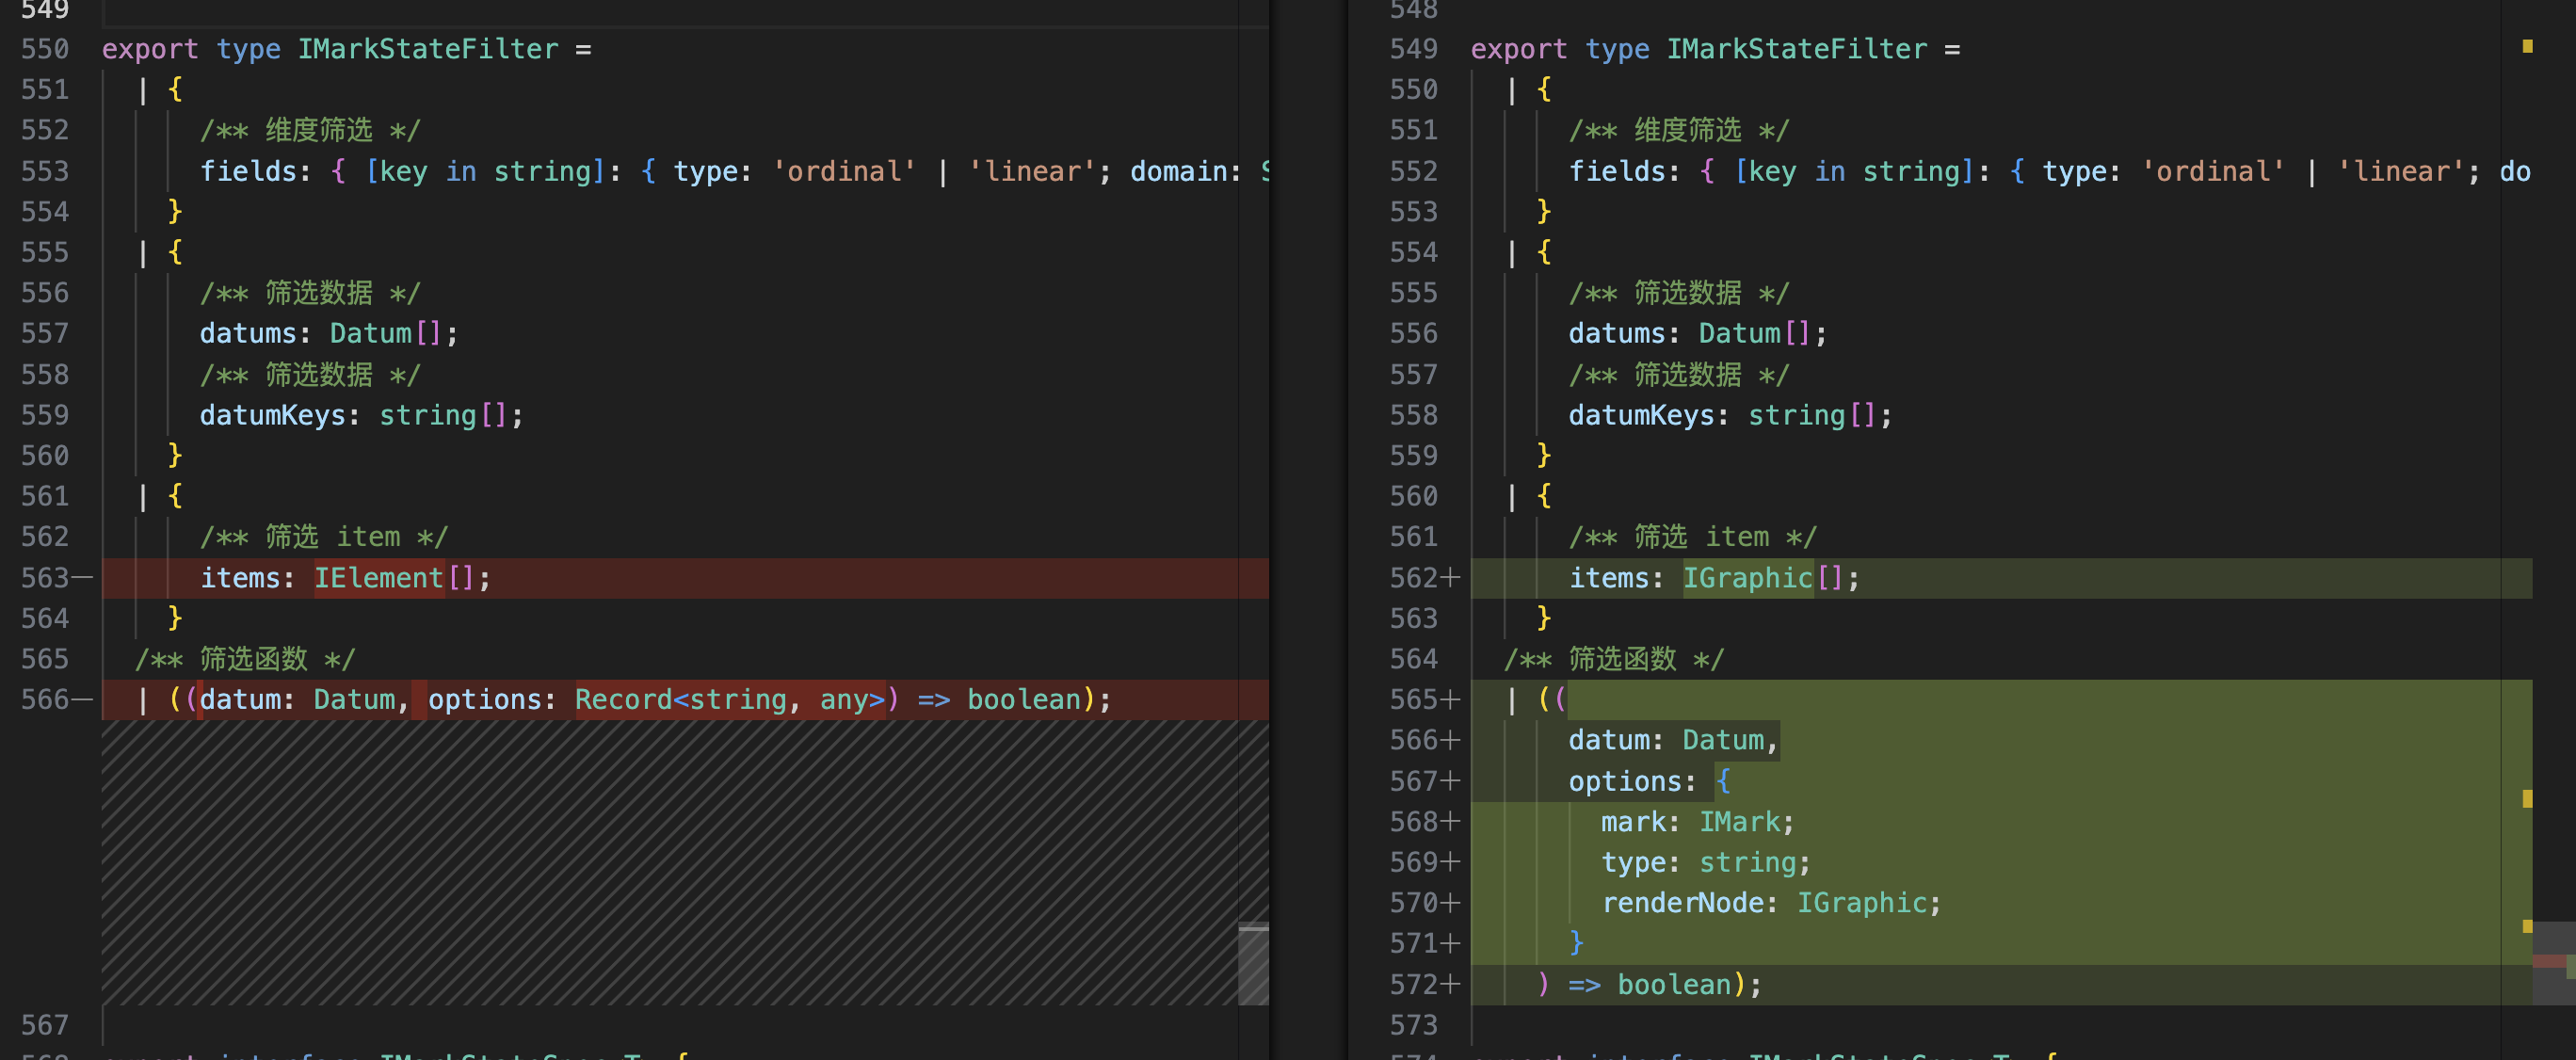
Custom State Parameter Changes
Change 1: Filtering by items now returns vrender graphics instead of vgrammar elements
Change 2: The second parameter returned by the custom filter function has been updated
Get the Graphic Corresponding to a Mark
- Before
const elements = mark.getProduct().elements;

elements.forEach(el => {
   const g = el.getGraphicItem();
   //
})
- 2.0.0
import type { IMarkGraphic } from '@visactor/vchart'

const graphics = mark.getGraphics();

graphics.forEach((g: IMarkGraphic) => {
  //
})
Registering Custom Graphic Components
- Before
import { Factory } from '@viscator/vgrammar-core';


Factory.registerGraphicComponent(AxisEnum.lineAxis, (attrs: any, options: VRenderComponentOptions) => {
  return new LineAxis(attrs, options) as unknown as IGroup;
});
- 2.0.0
import { Factory } from '@viscator/vchart';


Factory.registerGraphicComponent(AxisEnum.lineAxis, (attrs: any, options: VRenderComponentOptions) => {
  return new LineAxis(attrs, options) as unknown as IGroup;
});
ManualTicker
- Before
const ticker = new VRender.ManualTicker([]);
ticker.mode = "manual";
const chart = new VChart.default(spec, {
  dom: "app",
  animation: true,
  ticker,
});
- 2.0.0
const chart = new VChart.default(spec, {
  dom: "app",
  animation: true,
});
const stage = chart.getStage();
ticker = new VChart.ManualTicker(stage);
stage.ticker = ticker;
Custom Animation Interpolator
- Before
custom: (ratio, from, to, out) => {
  // modify out
},
- 2.0.0
custom: (ratio, from, to, out, graphic) => {
  // modify graphic.attribute
},
Changes Related to vrender 1.x
defaultTickerhas been removed