It is not only a fully functional graph visualization library, but also an explorer of data relationships.
!!!###!!!title=Data Development——VisActor/VMind Application Scenario!!!###!!!!!!###!!!description=In python Notebook scenarios such as data development, it is suitable to call VMind Open API to generate charts after SQL queries, and integrate intelligent visualization capabilities in Notebook with py-vchart rendering charts.<img src="https://lf9-dp-fe-cms-tos.byteorg.com/obj/bit-cloud/vmind/tutorials/Dorado-2.png" width="400"><img src="https://lf9-dp-fe-cms-tos.byteorg.com/obj/bit-cloud/vmind/tutorials/Dorado-3.png" width="450"><img src="https://lf9-dp-fe-cms-tos.byteorg.com/obj/bit-cloud/vmind/tutorials/Dorado-1.png" width="450">!!!###!!!
Data Development
In python Notebook scenarios such as data development, it is suitable to call VMind Open API to generate charts after SQL queries, and integrate intelligent visualization capabilities in Notebook with py-vchart rendering charts.
Sample Code
'''
In the Notebook scene, VMind Open API can be called to generate charts after SQL queries, and combined with py-vchart for chart rendering
VMind supports chart generation based on large language models and rules
The chart generation process will not pass detailed data to the large language model, so you can eat it with confidence
'''import requests
import pandas as pd
from pyvchart import render_chart
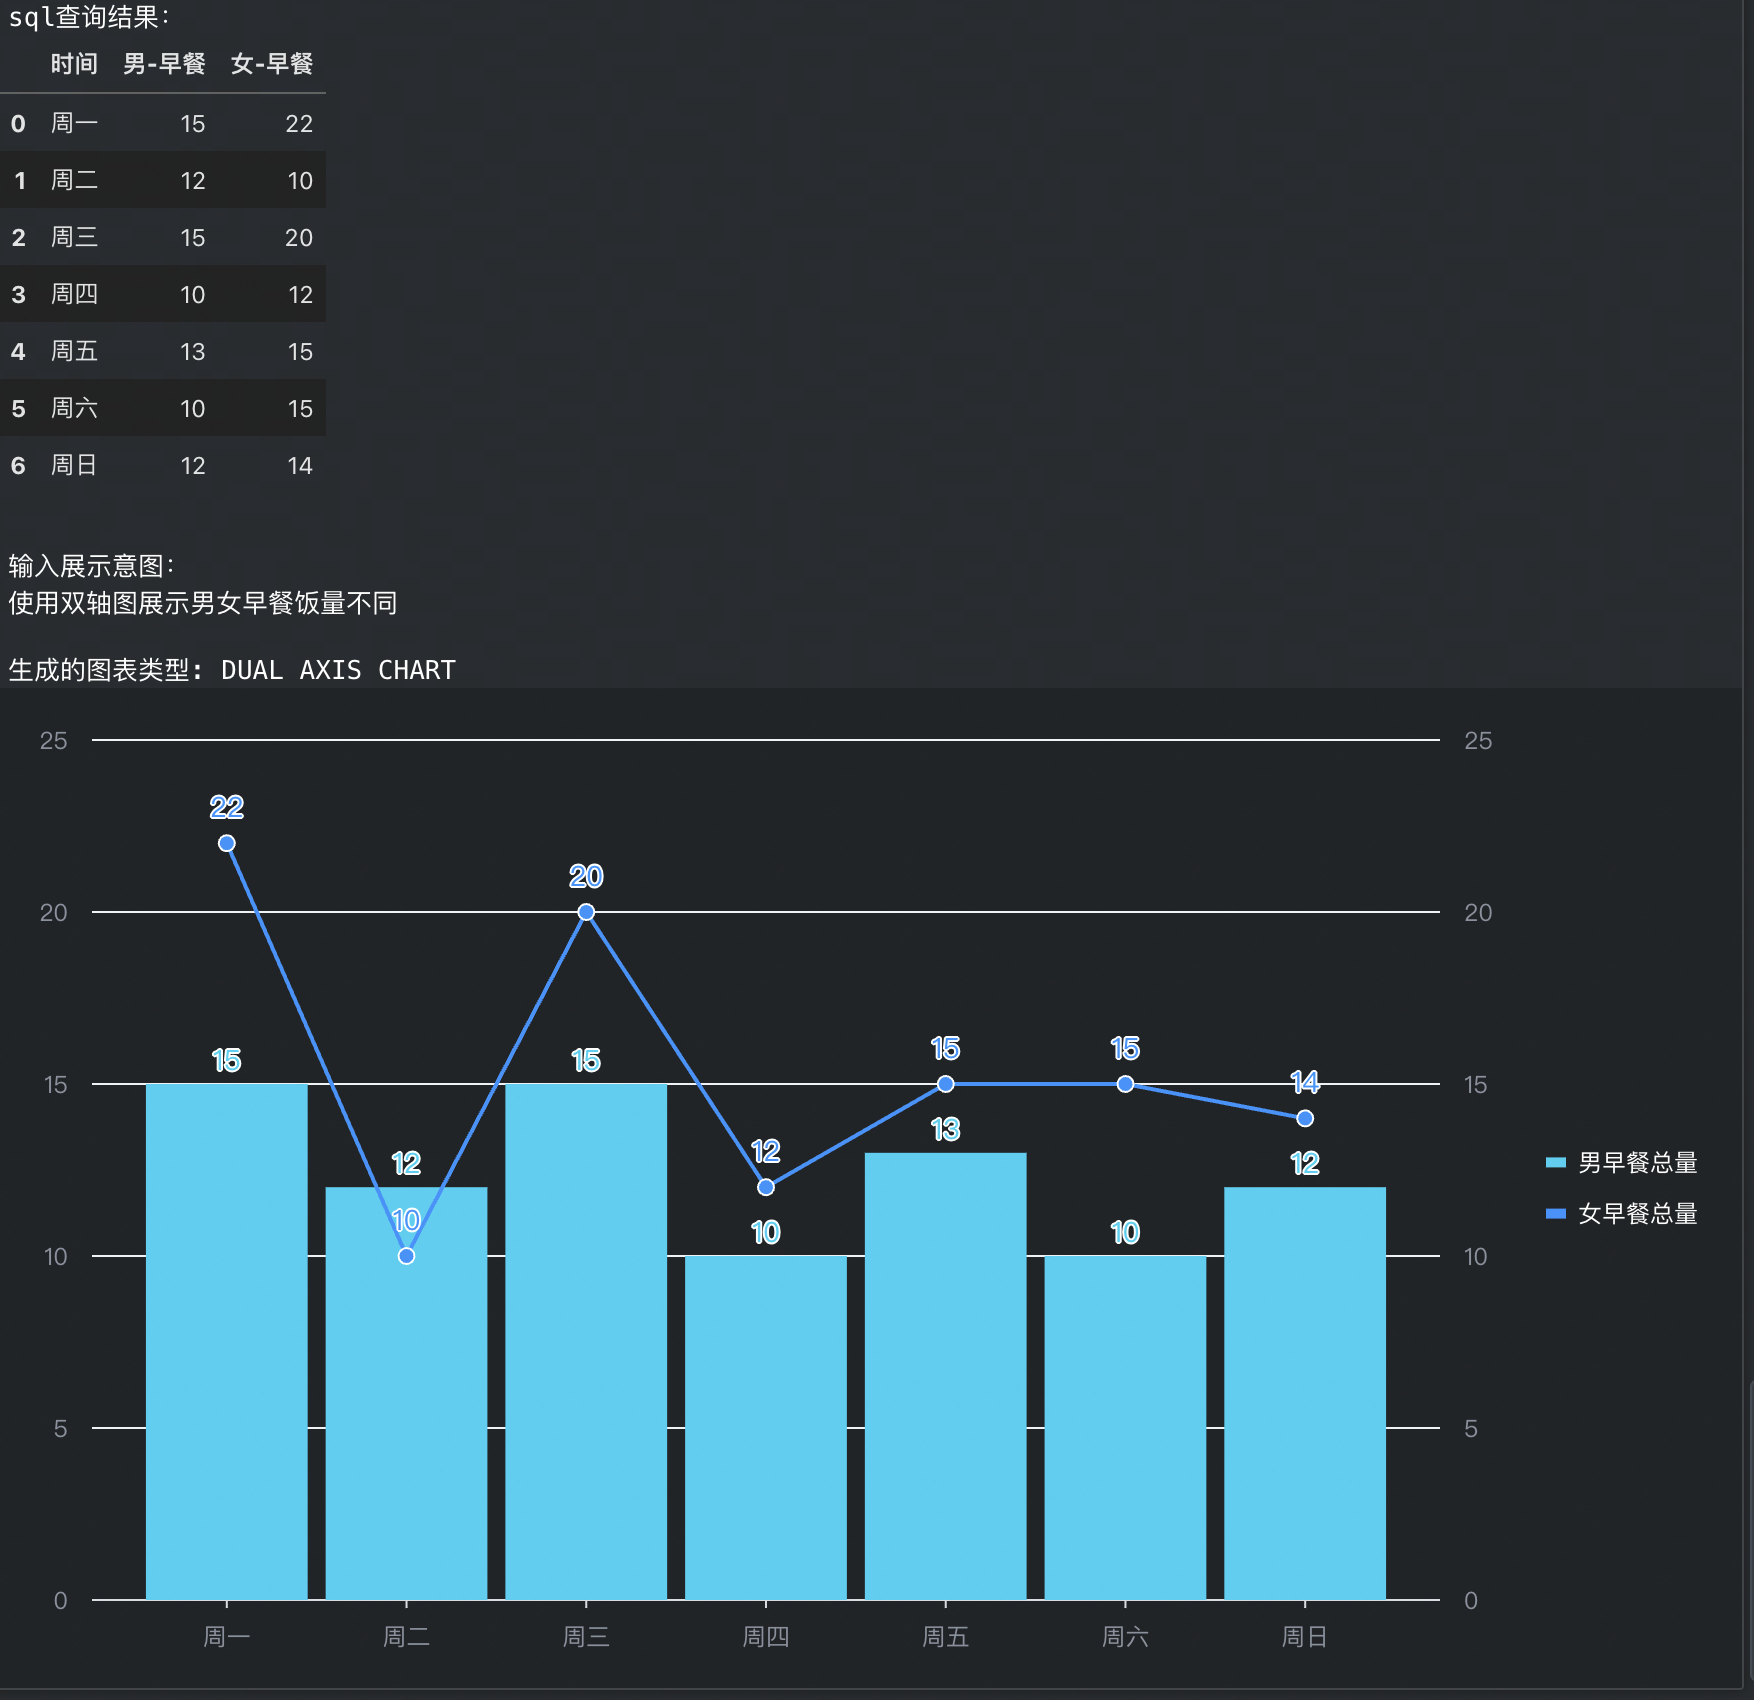
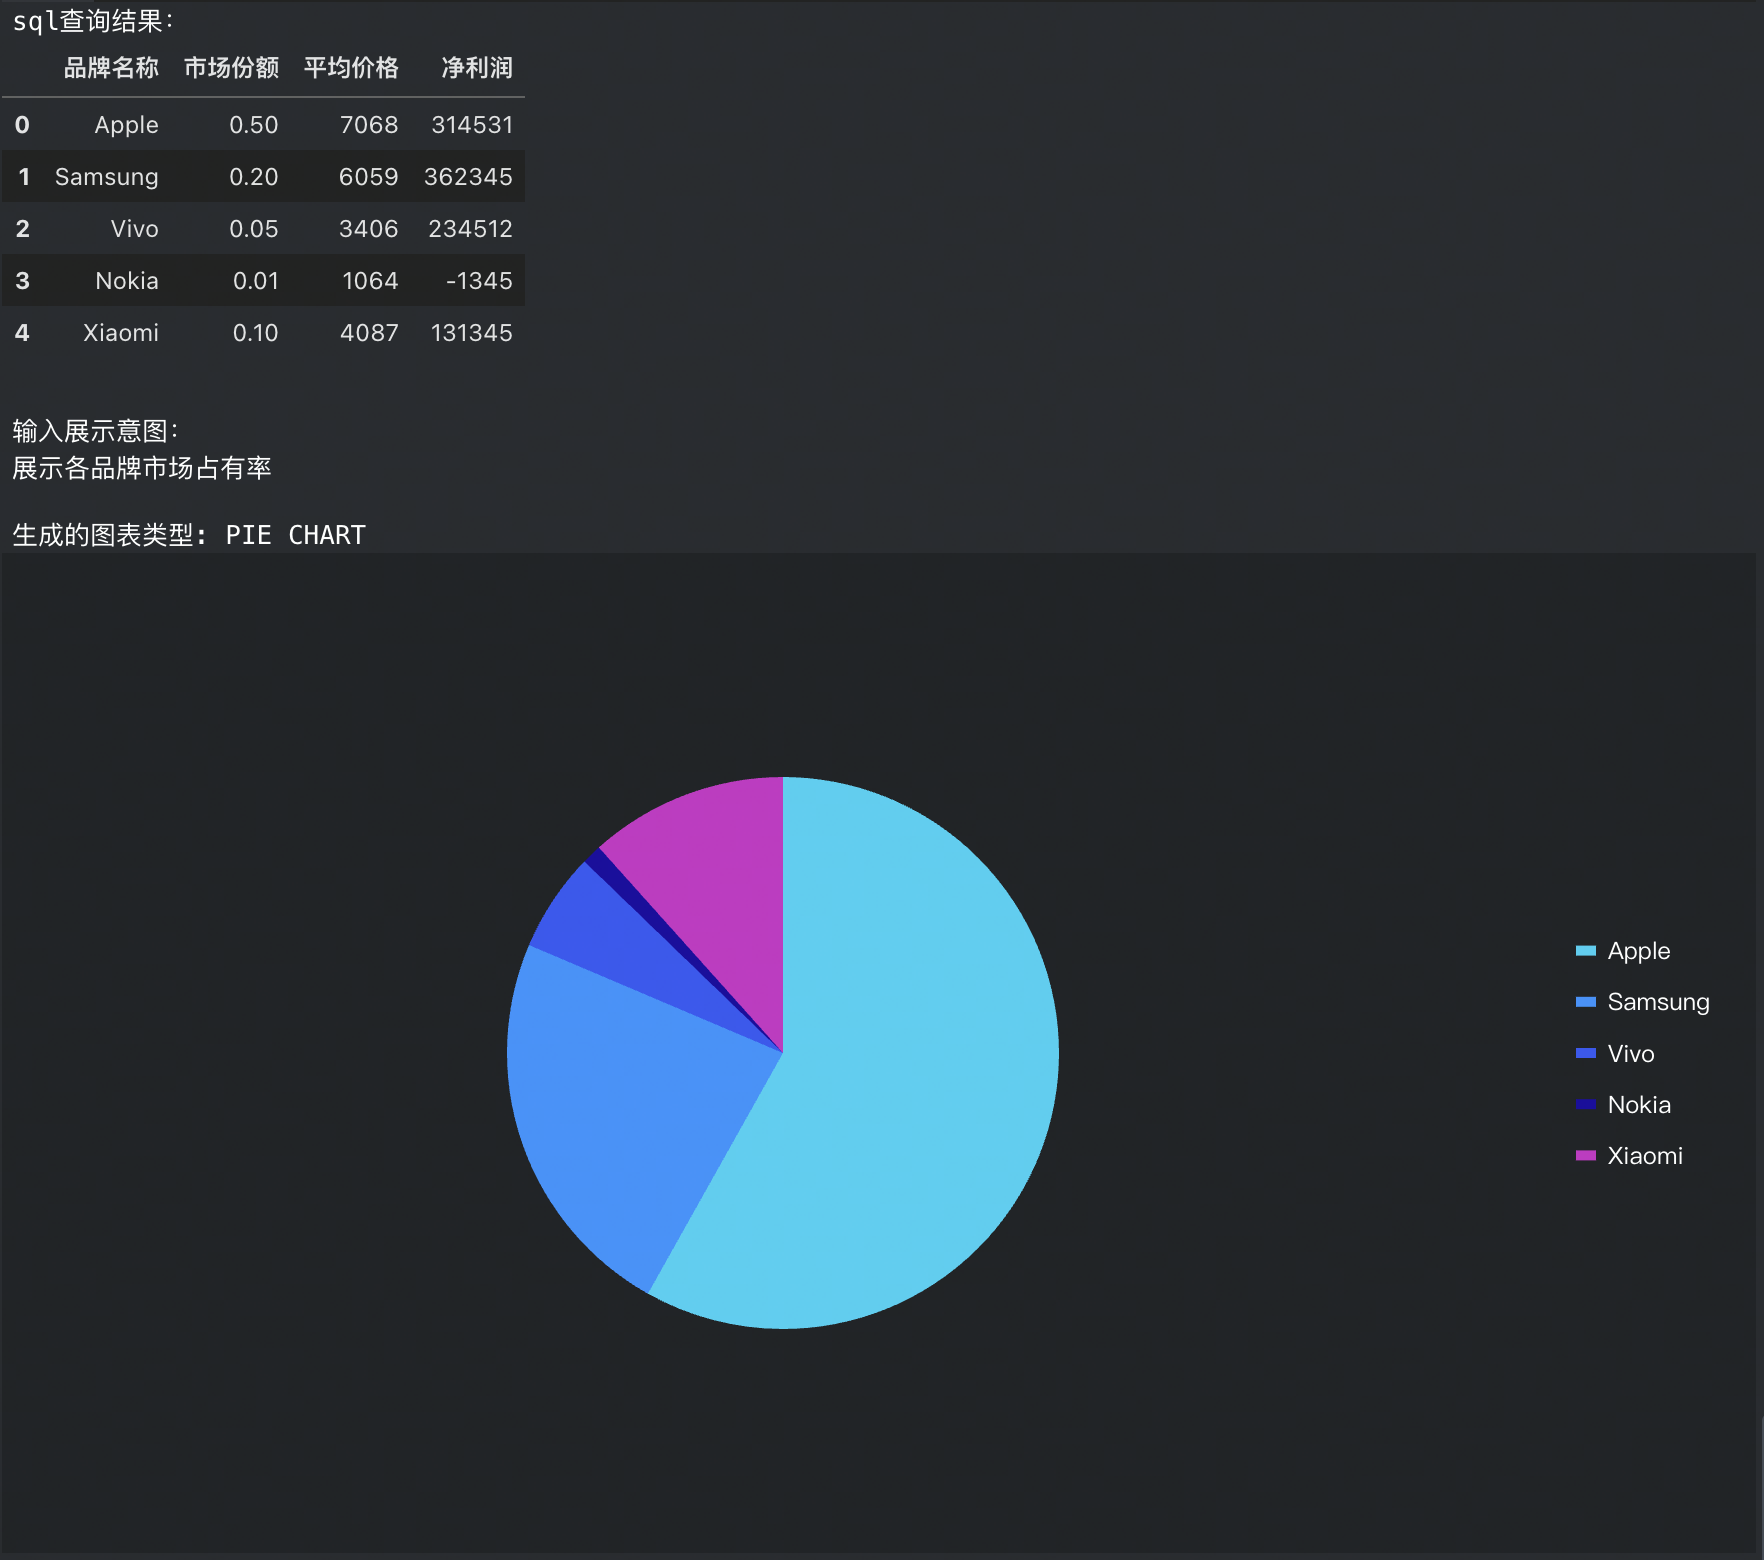
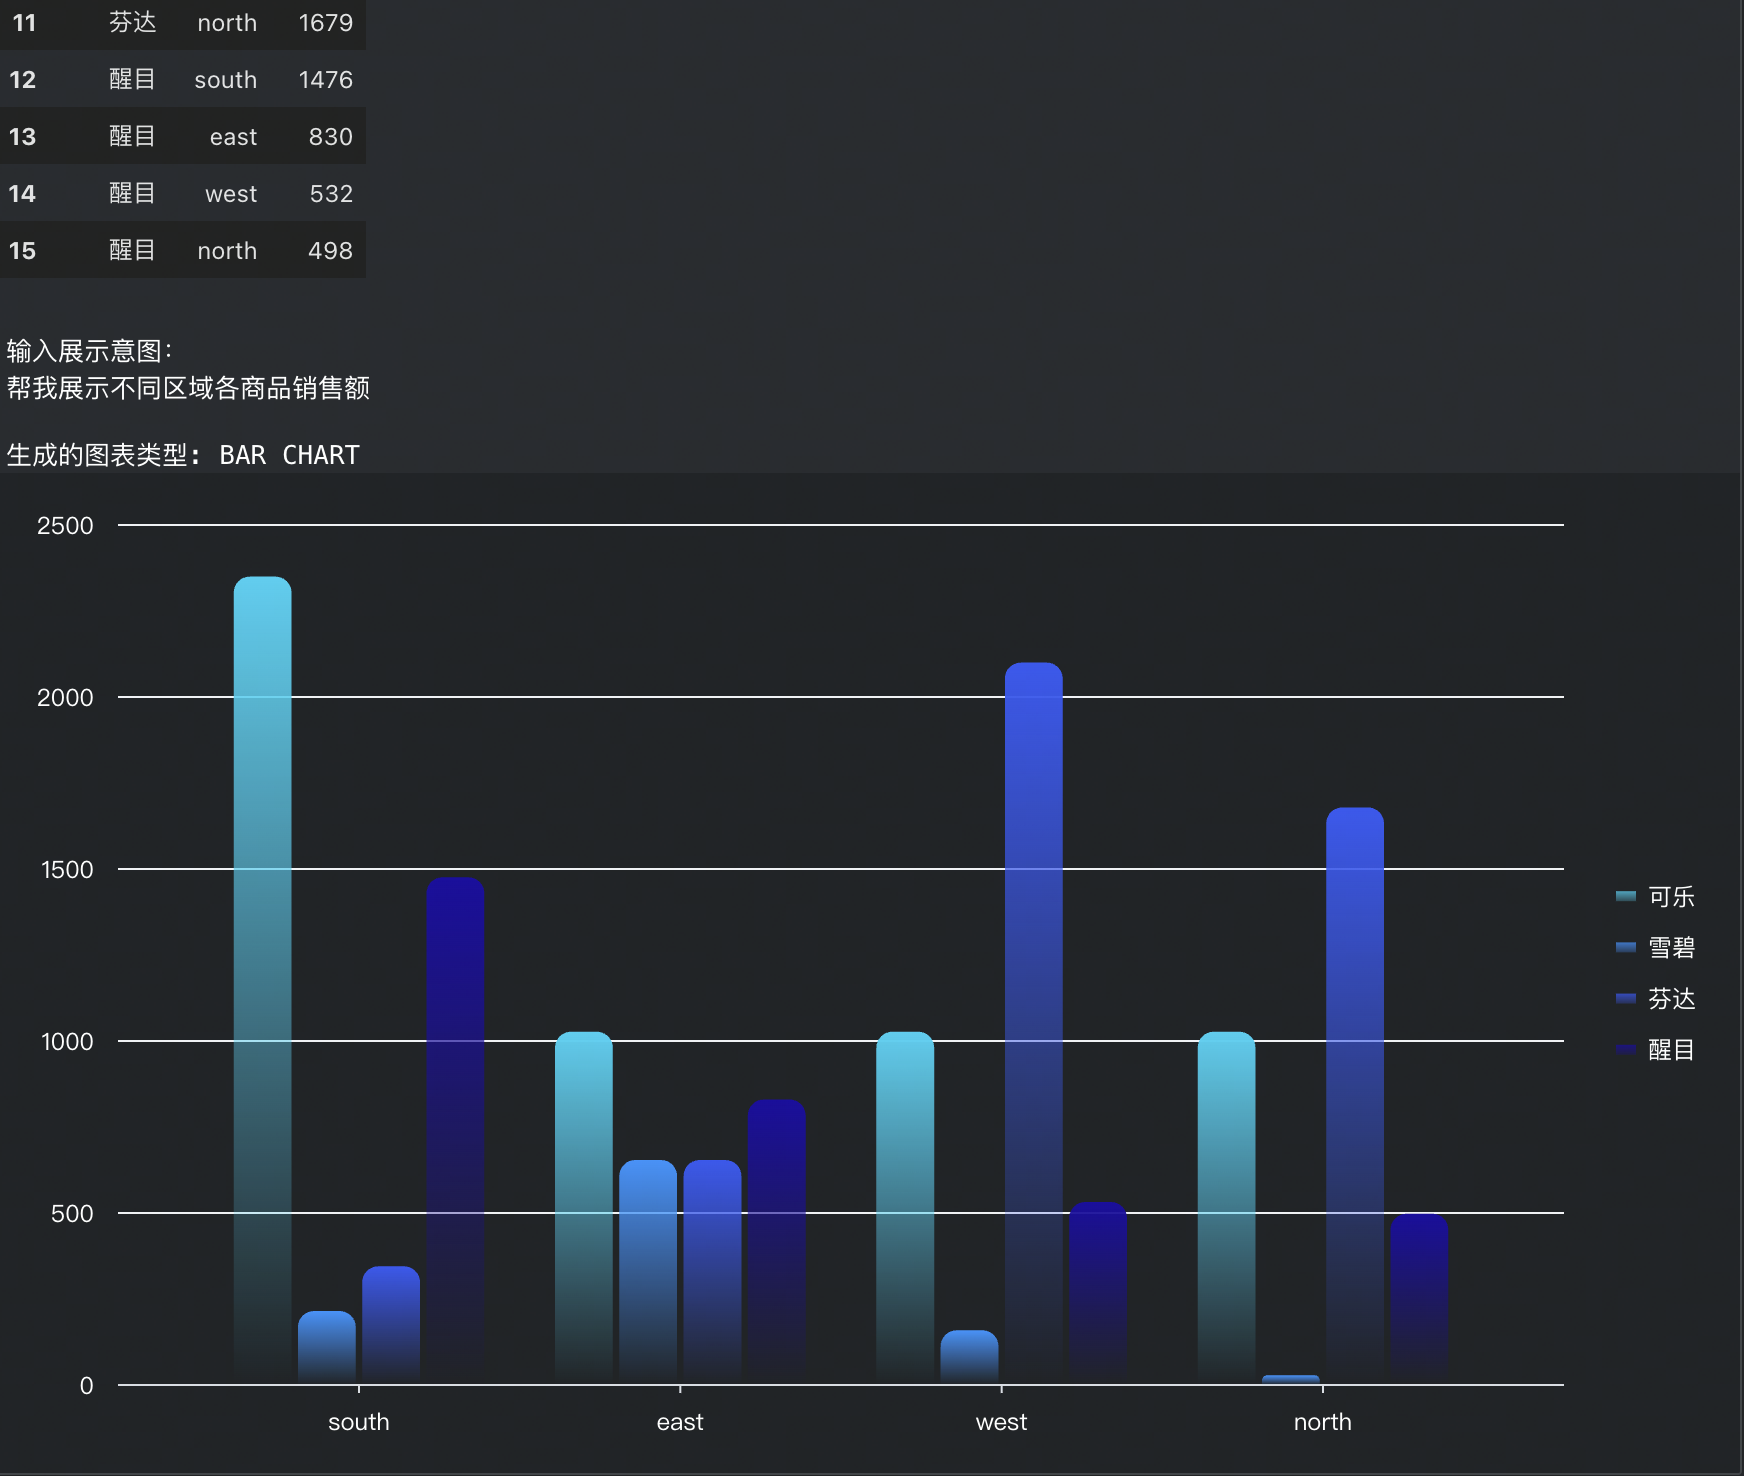
url = ""# VMind Open API url# Dataset queried:print('SQL query result: ')
display(sales_data_df)
sales_data_json =sales_data_df.to_json(orient="records", force_ascii=False)
userPrompt = "Help me display sales of various products in different regions"# User's presentation intentprint()
print('Display intent input: ')
print(userPrompt)
print()
body = {
"data": sales_data_json,
"userPrompt": userPrompt,
"model": "doubao"# Use the doubao model}
# Call VMind Open API to generate chartresponse = requests.post(url, headers=headers, json=body)
chart = response.json().get('chart')[0]
spec = chart.get('spec')
chartType = chart.get('chartType')
# print(spec)print('Generated chart type: '+chartType)
# Call py-vchart to render chartrender_chart(spec)