
Introduction
A vibrant visualization often involves the use of animation. Whether it's various types of charts or narrative works, well-organized and impactful animation can better assist users in grasping the underlying data insights within the visualization. Compared to static images, animation transforms complex data and concepts into more easily comprehensible visual forms, effectively showcasing changes, relationships, trends, and time-dependent information.
This article takes VisActor as an example to reveal the implementation principles behind its animation features.
Complex Animation
Currently, there have been numerous studies and various products developed by both academia and industry in the field of animation. However, why is there still no unified animation implementation in products with graphical libraries like Chart.js?

(demo:https://visactor.io/vchart/demo/storytelling/ranking-bar)
The above diagram depicts a common animated bar chart. From the content displayed in this animation, we can distinguish two essential elements that constitute animation within visualizations:
- Animation effects: Animation effects describe how the elements render changes in a specific stage of the animation. Animation effects include common visual channel interpolations, such as changes in color, width, and position of bars in a racing bar chart. Additionally, animation effects also encompass some special transformations, like the shape distortion of elements shown in the diagram below.
(demo:https://visactor.io/vrender/demo/examples/graphic-rect/morphing-animate)
- Animation sequencing: Once the animation effects for each stage are determined, the next consideration is how to combine these individual animation effects through animation sequencing to create complete and smooth animated content. For example, in the diagram below, a sequence of animation effects is shown, starting from the entrance, followed by updates, and ending with exit animations.
(demo:https://visactor.io/vgrammar/demo/animate/basic-animate)
In real-world business scenarios, both animation effects and animation sequencing manifest in various forms. From simple chart entrance animations to arbitrary animation effects between different narrative elements in storytelling works, the interplay between animation effects and animation sequencing gives rise to countless complex animation requirements.
Therefore, we need to provide a comprehensive explanation of animation and a powerful configuration approach to support free visual creation.
Animation Design
Animation Definition
Before discussing the animation design of VisActor, let's first briefly discuss the concept of graphic grammar. To systematically describe various types of charts and the data logic common to visual artworks, Leland Wilkinson proposed the concept of graphic grammar. From data to mapping, and then to specific visual channels, the design of graphic grammar incorporates vastly different forms of charts, such as bar charts and Sankey diagrams, into a unified framework. The chart library VChart and the grammar engine VGrammar in VisActor also provide support for visual creation based on the concept of graphic grammar.
For more descriptions about graphic grammar, you can refer to the influential work by Leland Wilkinson, 《The Grammar of Graphics》。
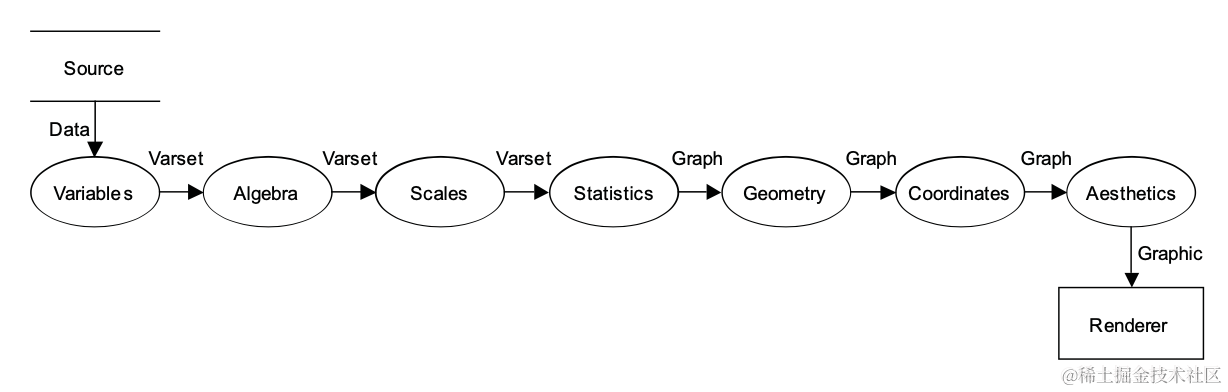
(The process of graphic grammar)
Although graphic grammar provides a comprehensive framework for the entire process from data variables to aesthetic representation, it does not explicitly explain the animation aspect within this process. The core of graphic grammar lies in establishing the connection between data and graphic rendering, while the relationship between animation and data is not as closely integrated.
- Some animation designs are purely driven by aesthetic considerations and may not have any practical data significance:
(demo:https://visactor.io/vchart/demo/gauge-chart/clock)
- Some animation designs, on the other hand, reflect the process of data changes:
(demo:https://visactor.io/vchart/demo/storytelling/ranking-bar)
In order to better explain the meaning of animation, in VisActor, animation is considered as a decoration during the rendering stage. The combination of animation configurations and the visual channels of graphic elements obtained from the execution of the graphic grammar process determines the result of the rendering stage. The representation of animation involves the interpolation calculation or special computation logic of visual channel attributes of specific graphic elements over a certain period of time. The animation configuration describes the triggering timing and duration of this calculation.
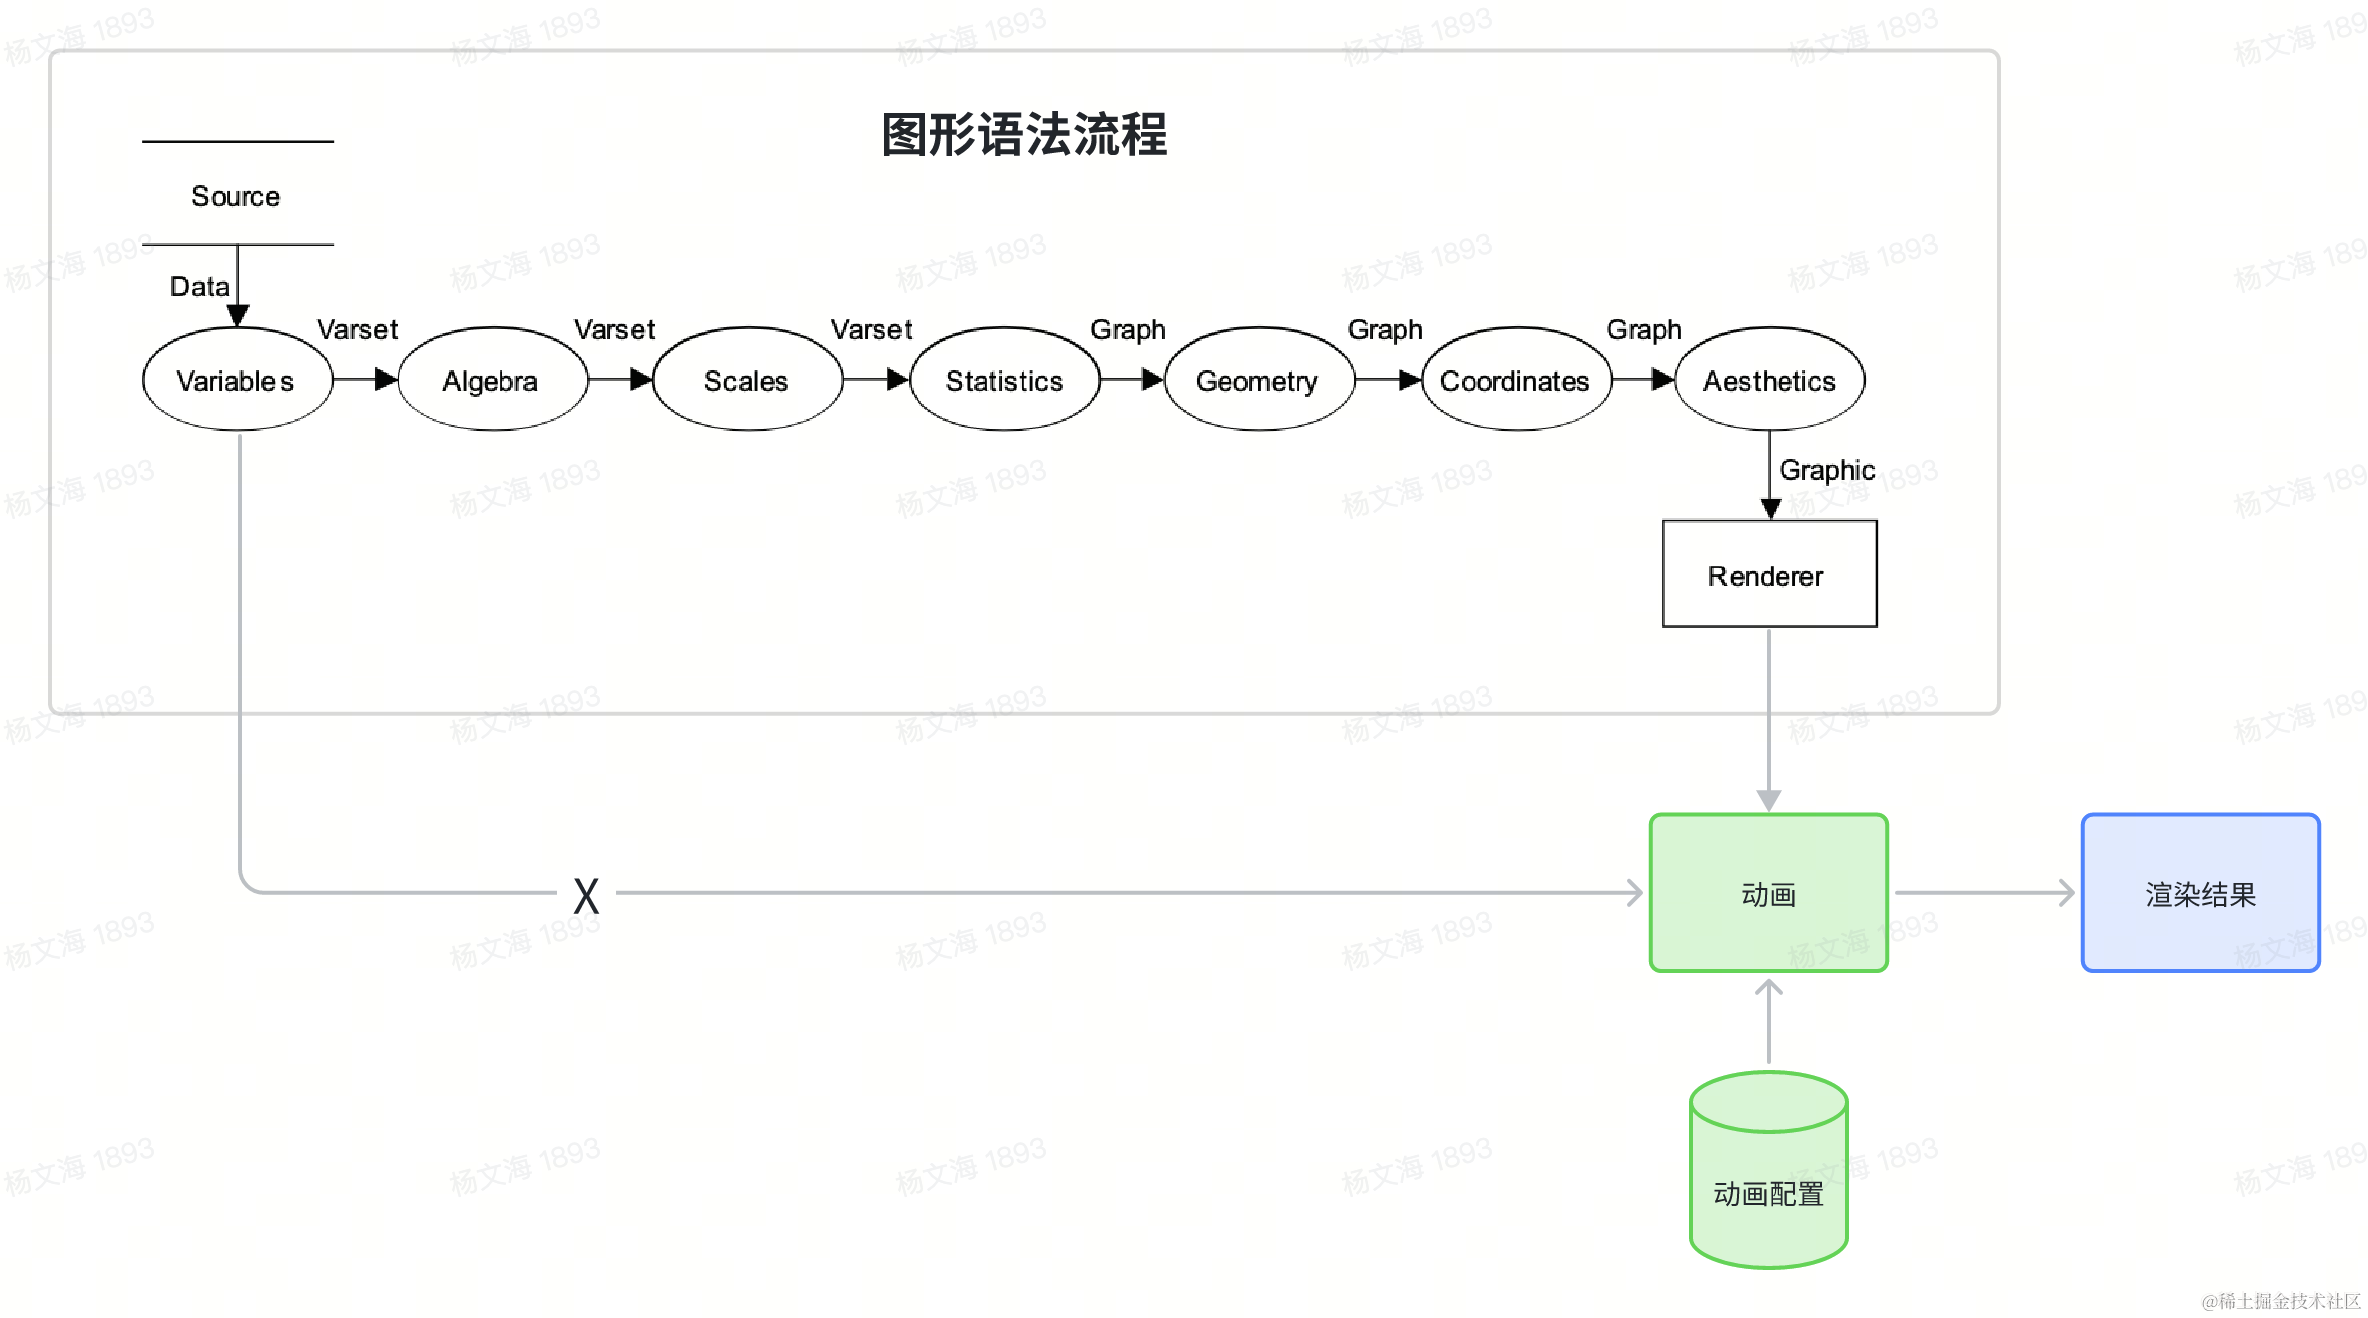
(The animation process in VGrammar)
Timing of Animation Trigger
The declaration of animations can be divided into two forms:
- Active declaration: Configuring how the declared element should be animated over a period of time (e.g., Canis).
- Passive declaration: Configuring which animation effect should be triggered when the element reaches a certain state.
In the context of chart libraries, animations are often accompanied by interactions or specific events, such as entry/exit/hover/select, which trigger corresponding animation effects. Therefore, passive declaration is more convenient for configuring animations. The animation configuration provided by VGrammar actually describes the execution logic of the rendering stage. Developers do not directly trigger the animation execution. Instead, they declare the animation execution logic and let the VGrammar logic trigger the corresponding animation calculation when the specific animation event is triggered.
From the perspective of element states, the timing of animation triggers can be categorized as follows:
- enter: Animation triggered when a new graphical element is added.
- exit: Animation triggered when a graphical element is removed.
- update: Animation is triggered when the visual channels of a graphical element are updated.
- state: Animation triggered when the interactive state of a graphical element changes. In common scenarios where interactions and animations are combined, the animation is manifested as an interpolation accompanying the change in the interactive state, such as hover animation. For this animation state, we handle it separately in the underlying rendering library to avoid expensive data flow calculations and improve performance.
- Animation triggered at any time: The animation configuration is immediately applied to the element. This form of animation is often more common in visual storytelling scenarios.
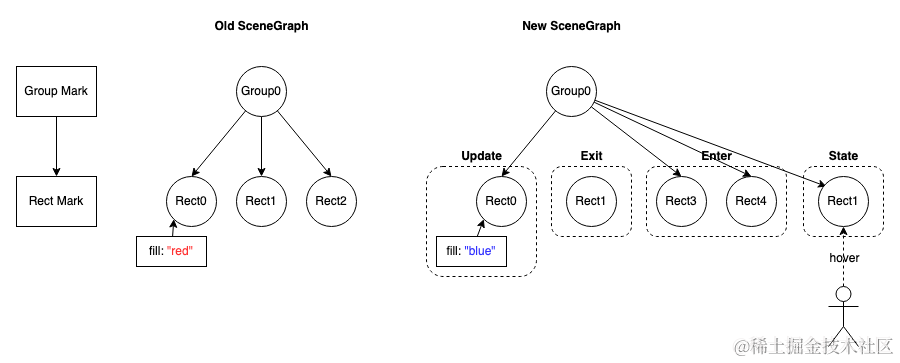
(Timing of Animation Trigger)
By separating animation from data flow, we have the freedom to define the timing of animation triggers and configure corresponding animation effects. For example, in VGrammar, we can configure the effects of various animation stages on rectangle elements. Please refer to the VGrammar tutorial at https://visactor.io/vgrammar/guide/guides/animation for more details.
    {
      type: 'rect',
      // other mark specs
      animation: {
        enter: {
          type: 'growHeightIn',
          duration: 2000,
          options: (datum, element, params) => {
            return { orient: 'negative' };
          }
        },
        update: {
          type: 'update',
          duration: 2000
        },
        exit: {
          type: 'fadeOut',
          duration: 2000
        },
        state: {
          duration: 500
        }
      }
    }
Furthermore, to facilitate the flexible triggering of animation effects in narrative visualization scenarios, VGrammar also provides the animate object on both the element and the top-level View object, which supports automatic animation interface calls.
interface IAnimate {
  stop: () => this;
  pause: () => this;
  resume: () => this;
  run: (config: IAnimationConfig | IAnimationConfig[]) => IAnimateArranger;
  runAnimationByState: (animationState: string) => IAnimateArranger;
  stopAnimationByState: (animationState: string) => this;
  pauseAnimationByState: (animationState: string) => this;
  resumeAnimationByState: (animationState: string) => this;
}
Basic Animation Unit
VGrammar uses animation configuration to describe the corresponding graphic elements' animation execution logic, which includes specific animation effects and the arrangement between different animation contents. The diagram illustrating the composition of the animation configuration is as follows:
(Animation Unit of VGrammar )
The overall animation configuration consists of independent basic animation units called Aunit. An Aunit is applied to a specific animation trigger, describing how animation interpolation calculations are performed when that trigger is activated. The definition of an animation unit is as follows:

The constituent elements are as follows::
- mark:The specific graphic element associated with the animation unit, where the animation declaration will be bound to various animation trigger instances of that element;
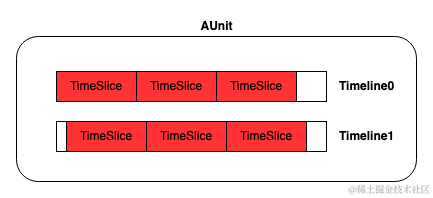
- timeline:The timeline of an animation describes the animation presentation of graphic elements over a period of time. The timeline consists of a series of sequentially executed animation fragments, and animations between different timelines can run in parallel. A timeline can be set to loop in order to perform the interpolation calculation for repeated animations;
- partitioner:An animation partitioner filters the content of corresponding graphic elements and applies animation configurations to these filtered graphical elements;
- sort:Element sorting rules determine the execution order of graphical elements within corresponding graphic elements, which depends on the sorting rules specified by
sort。
The definition of an animation timeline, Timeline, is as follows:

The elements in a timeline include:
- Timeslice: A segment of the animation that describes a specific interpolated animation configuration, including the animation effect, animation execution time, and other specific animation settings. All the timeslices on a timeline are concatenated together from start to end.
- StartTime: The start time of the animation, describing the time when the animation begins executing after the timeline is triggered.
- Duration: The execution duration of the timeline, describing the length of the animation for the current timeline.
- Loop: A timeline can be set to loop, where the animation process described by all the included timeslices will be repeated.
The definition of "Timeslice" is:

The elements in a "Timeslice" include:
- Effect: The specific execution effect of the animation, describing the interpolation calculation logic of the visual channel properties of the graphic element. The effect can be a pre-packaged specific animation effect or a developer-configured animation with starting and ending states, describing the calculation logic for interpolating the animation properties.
- Duration: The execution duration of the timeslice.
- Delay: The waiting time before the execution of the timeslice.
- OneByOne: Describes the logic of executing specific graphic elements within the corresponding graphic element one by one.
The definition of "Effect" is:

The elements in "Effect" include:
- Channel: The modified visual channel properties, describing the visual channel properties at the beginning and ending states of the interpolation calculation.
- Easing: The easing strategy for interpolation calculation.
A complete animation configuration describing a pillar becoming brighter and then darker is shown below:
        loop: {
          loop: true,
          oneByOne: 300,
          timeSlices: [
            {
              effects: {
                channel: {
                  fillOpacity: { to: 0.3 }
                },
                easing: 'linear'
              },
              duration: 500
            },
            {
              effects: {
                channel: {
                  fillOpacity: { to: 0.3 }
                },
                easing: 'linear'
              },
              duration: 1000
            },
            {
              effects: {
                channel: {
                  fillOpacity: { to: 1 }
                },
                easing: 'linear'
              },
              duration: 500
            }
          ]
        }
(Please refer to specific animation examples for reference:https://visactor.io/vgrammar/demo/animate/loop-animate)
Additionally, VGrammar provides animation configurations and a series of built-in animation effects, such as fade-in/out animations, scale animations, etc. For example:
      animation: {
        enter: {
          type: 'fadeIn'
        },
        exit: {
          type: 'fadeOut'
        }
      }
For specific built-in animations and animation configurations, please refer to the VGrammar tutorial:https://visactor.io/vgrammar/guide/guides/animation
Morphing Animation
In addition to common interpolation animations, we also provide global deformation animations between graphic elements to support smooth transition effects between different graphical elements or different charts. For example, when transitioning from a bar chart to a pie chart, we often want to smoothly transform the bars from the bar chart into the pie slices in the pie chart:

(demo:https://visactor.io/vchart/demo/example/morphing/bar-to-pie)
By default,morphing animation is enabled in VGrammar. When developers invoke updateSpec to update the scene's spec declaration or perform uninstallation/mounting of grammar elements via API, VGrammar will perform a diff on the elements before and after the update. Based on the corresponding configuration, VGrammar determines whether to reuse elements or perform global deformation.
Developers can configure the effects for elements that require global deformation:
mark.morph: Determines whether the element applies global deformation.mark.morphKey: The key value on which the element relies on matching before and after the transformation.mark.morphElementKey: The key value on which the specific graphical element within the element relies on matching before and after the transformation.
One example:
const vGrammarView = new VGrammarView({
  width: roseSpec.width,
  height: roseSpec.height,
  container: CHART_CONTAINER_DOM_ID,
  hover: true
});
vGrammarView.parseSpec(roseSpec);

vGrammarView.runAsync();

setTimeout(() => {
  vGrammarView.updateSpec(radarSpec);
  vGrammarView.runAsync({ morph: true });
}, 500);

setTimeout(() => {
  vGrammarView.updateSpec(funnelSpec);
  vGrammarView.runAsync({ morph: true });
}, 2000);
More detail:https://visactor.io/vgrammar/demo/animate/morph-animate
Bézier Curve
The key to implementing morphing animation lies in converting the edges of all primitives into Bézier curves. By interpolating the control points of Bézier curves, it is possible to achieve deformation animation between different shapes.
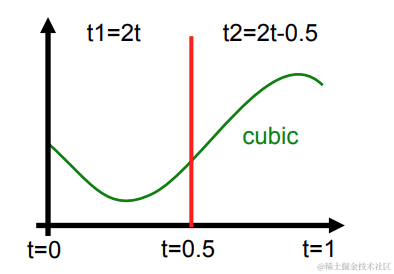
Bézier curves can be used to draw straight lines, arcs, ellipses, and other basic shapes. Most of the curve graphics we see on computers are described using Bézier curves. The basic expression for a cubic Bézier curve is as follows:
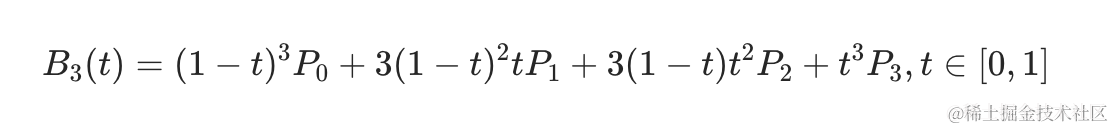
In the equation, P0, P1, P2, P3 represent the four control points of the Bézier curve, and B(t) describes all the points on the curve by varying t within the range [0, 1]. It is shown below:
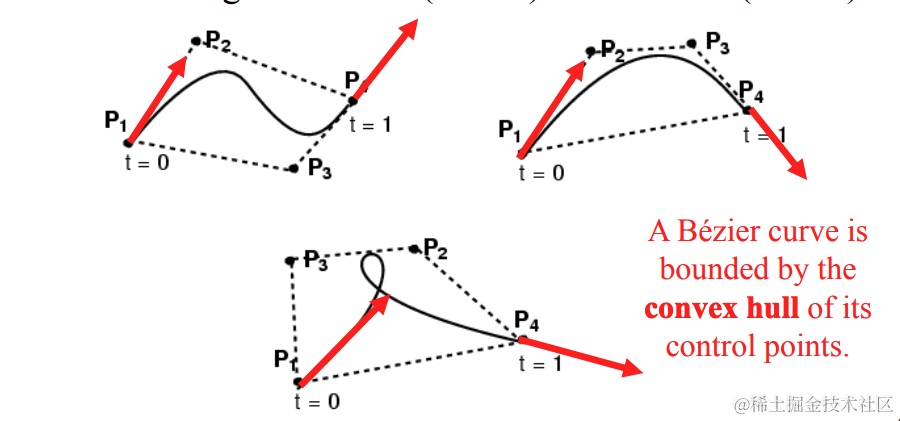
(Cubic Bezier Curve)
Bézier curves have convex hull property, which means that all points within the curve are contained within the convex hull formed by the control points. Additionally, Bézier curves can be refined by dividing them at any point along the curve, resulting in two new curves. For example, dividing the curve as shown below:
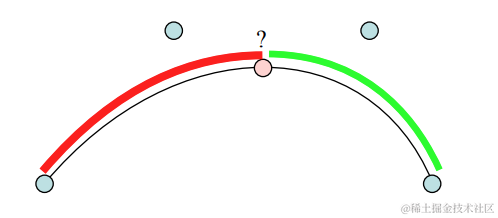
After splitting, the T parameter of the two Bézier curves is remapped to the range [0, 1], and the control points are also split accordingly:
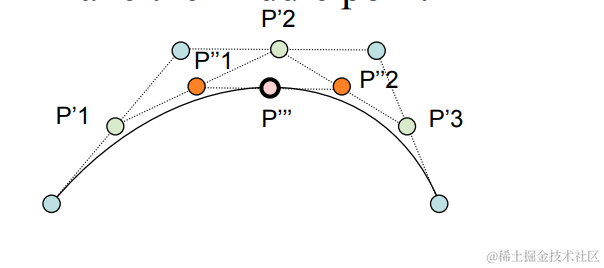
After dividing the original Bézier curve, the points P1, P'1, P''1, P''' and P''', P''2, P'3, P4 form the control points of the two new Bézier curves.
One-to-one morphing animation
Animation workflow
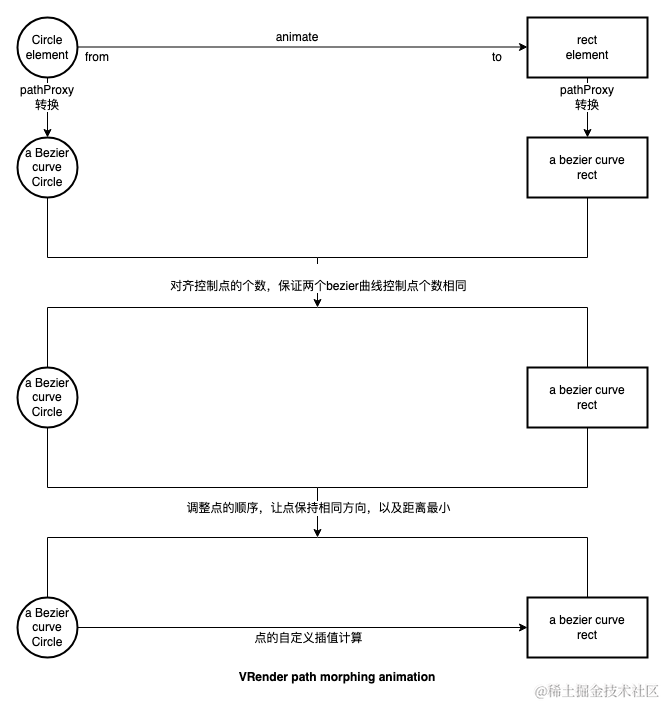
Below is an example of transforming a circular shape into a square shape:
The basic animation workflow is as follows:
- Align the number of control points (ensuring both the circle and square shapes have 4 control points in the above video).
- Pair the control points before and after the animation using a target function (in the above video, the control points of the circle and square are paired, ensuring the minimum distance between the paired control points).
- Perform interpolation between the paired points to complete the animation.
Graphic decomposition
Graphic decomposition is a necessary step for performing one-to-many animations and many-to-one animations. Its main objective is to ensure that the number of graphic elements remains consistent before and after the animation
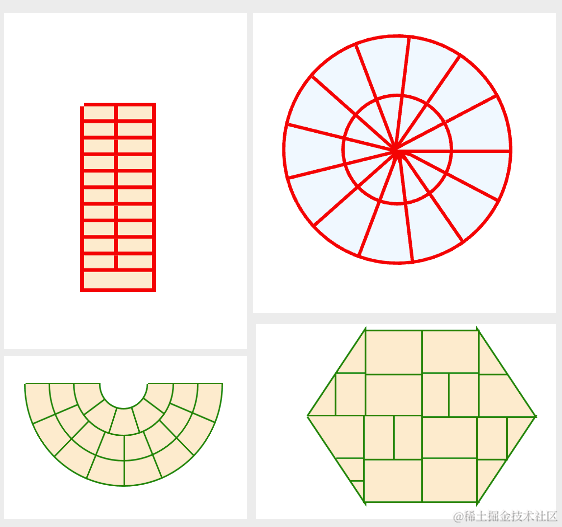
Below are the potential decomposition effects for the rectangle, circle, arc, and polygon:
Multi-to-one morphing animation
Animation workflow
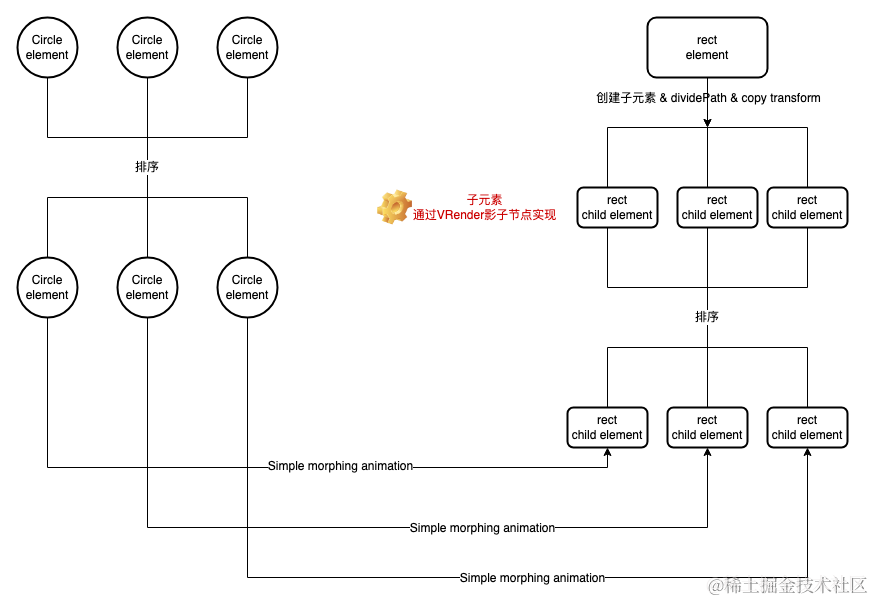
Take the example of transforming 3 circular elements into 1 rectangular element. The basic animation process is as follows:
- Split the target elements into 3 sub-elements and sort them, then render them using the VRender shadow node mechanism.
- Sort the starting elements of the animation and match them with the 3 sub-elements of the target elements.
- Perform one-to-one deformation animation on the matched elements.
- After the animation is complete, retrieve the sub-elements of the target elements and display the target element.
workflow is as follows::
There are two strategies for the final step of merging. One strategy is the splitting method, which involves combining multiple shapes into one shape like a puzzle:
The other strategy is the duplication method, which involves transforming multiple shapes into shapes that are consistent with the target, and then overlaying them:
One-to-many morphing animation
The animation process of one-to-many involves the inverse operation of many-to-one animation, by performing the steps in the exact opposite manner. Taking an example of transforming 1 rectangle element into 3 circle elements, the basic animation process is as follows:
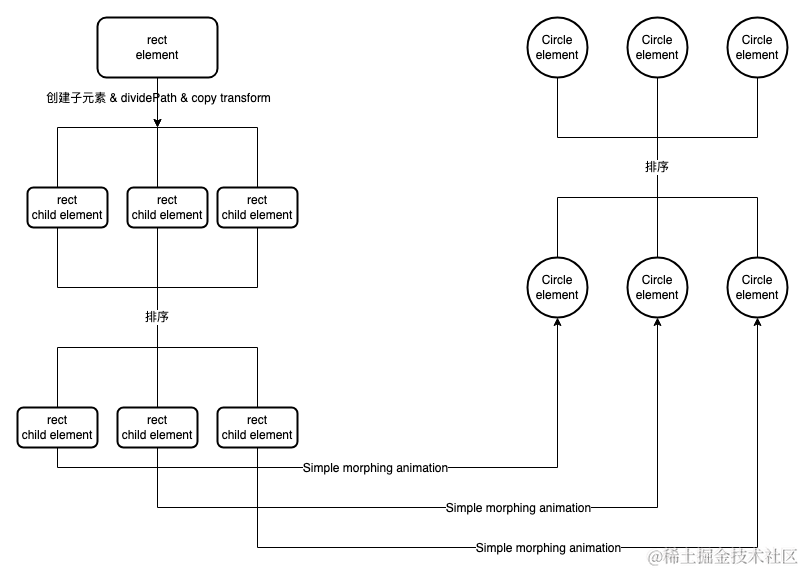
As shown below, this example uses a splitting strategy to accomplish the transformation process from one to many.
Demos
VGrammar Animation Layout Example: Simple animation layout and custom animation declarations for titles, coordinate axes, and bar chart elements.
(demo url:https://visactor.io/vgrammar/demo/animate/arrange-animate)
VGrammar Narrative Example: Using the combination of Glyph elements and animation to achieve a scrolling timeline narrative effect.
(demo url:https://visactor.io/vgrammar/demo/animate/timeline)
VChart Deformation Animation Example: Switching between bar chart and doughnut chart, achieving smooth transition effect through deformation animation.
(demo url:https://visactor.io/vchart/demo/example/morphing/bar-to-pie?keyword=animation)
VChart Narrative Example: Demonstrating the dynamic changes in data over time by organizing them through entrance and update animations in a bidirectional bar chart.
(demo url:https://visactor.io/vchart/demo/storytelling/dynamic-comparative-bar-chart?keyword=animation)
Summary
This article introduces the animation implementation principles in the VisActor visualization solution and showcases some demos. In the next article, we will provide a detailed explanation of the animation syntax and configuration in VChart and VGrammar, demonstrating how to customize stunning animation effects and narrative works using VChart and VGrammar.
We welcome everyone to join the discussion:
- Leave a message on the VisActor WeChat subscription account (you can join the WeChat group through the subscription account menu):

2)VisActor Discord group:https://discord.gg/3wPyxVyH6m
3)VisActor site :https://www.visactor.io/
4) github (Welcome Star ⭐️):https://github.com/visactor