
Statement: The title of this article was generated by ChatGpt
Introduction
VChart is not just a multi-terminal chart library for Out Of The Box, but also a vivid and flexible data storyteller.
VChart is the core chart component library of ByteDance’s open-source visualization solution VisActor. It is encapsulated based on the visualization syntax library VGrammar and the rendering engine VRender. While meeting the needs of data presentation, it also supports animation arrangement for narrative scenes, rich interactive capabilities, and customized chart styles. The simple and easy-to-use configuration greatly reduces the learning cost for users.
Get started quickly
Get VChart
You can obtain VChart in the following ways.
Use NPM package
First, you need to install VChart in the project root directory using the following command:
install using npm
npm install @visactor/vchart
install using yarn
yarn add @visactor/vchart
Use CDN
You can also obtain the built VChart file through CDN. Add the following code to the < script > tag of the HTML file:
Import VChart
Import through NPM package
Use import to import VChart at the top of the JavaScript file.
import VChart from '@visactor/vchart';
Import using script tags
Import the built vchart file by directly adding the < script > tag to the HTML file. ``html
`` **Render a simple chart**Before drawing, we need to prepare a DOM container with height and width for VChart. ``html
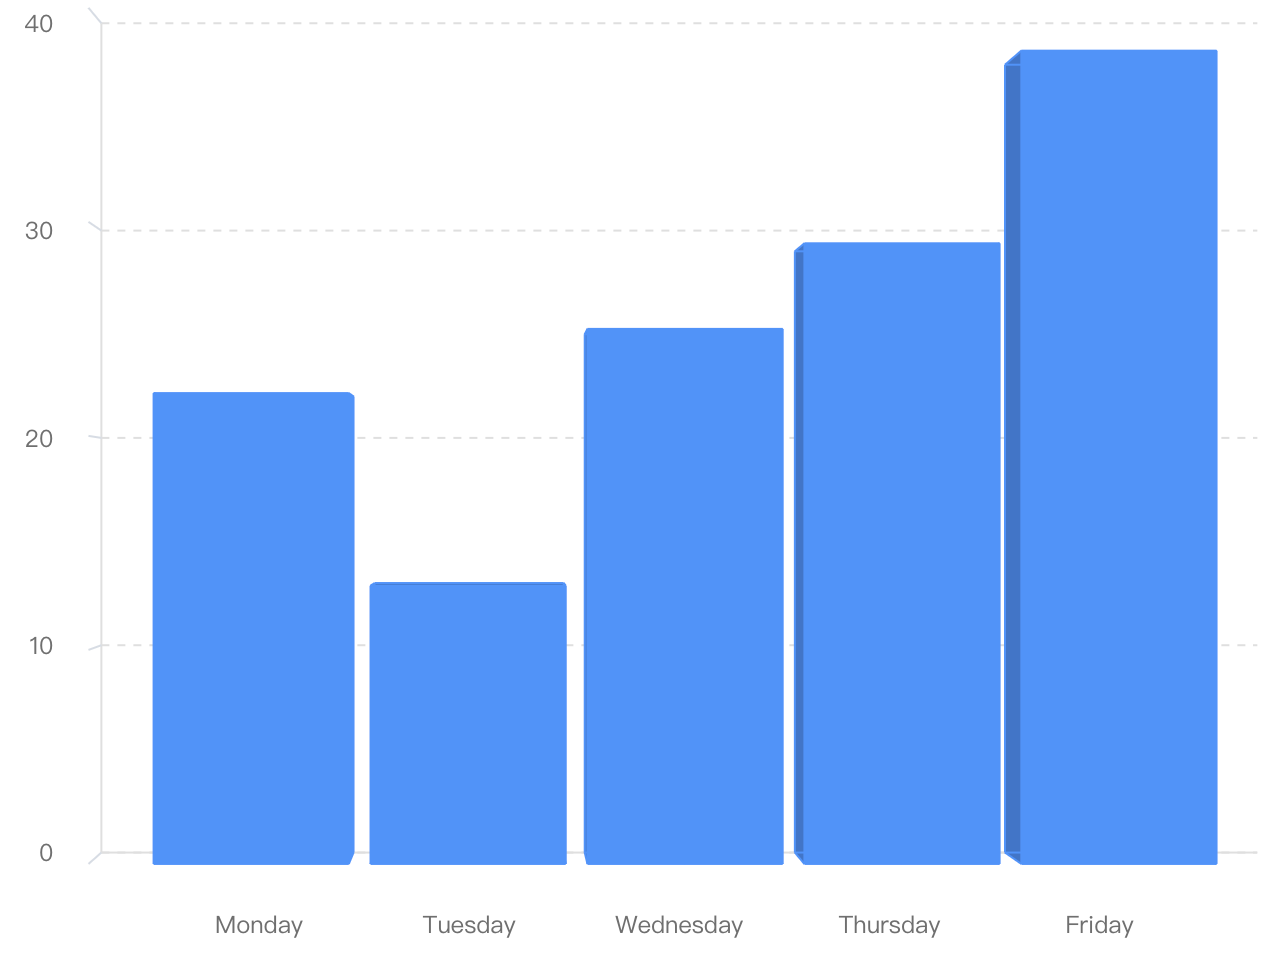
``Next, we create a VChart instance, passing in the chart configuration item and the ID of the DOM container.``javascript const spec = { data: [ { id: 'barData', values: [ { month: 'Monday', sales: 22 }, { month: 'Tuesday', sales: 13 }, { month: 'Wednesday', sales: 25 }, { month: 'Thursday', sales: 29 }, { month: 'Friday', sales: 38 } ] } ], type: 'bar', xField: 'month', yField: 'sales' }; // create vchart instance const vchart = new VChart(spec, { dom: 'chart' }); // if import with cdn ,use const vchart = new VChart.default(spec, { dom: 'chart' }); // render vchart.renderAsync();`` So far, you have successfully drawn a simple bar chart!The effect is as follows:
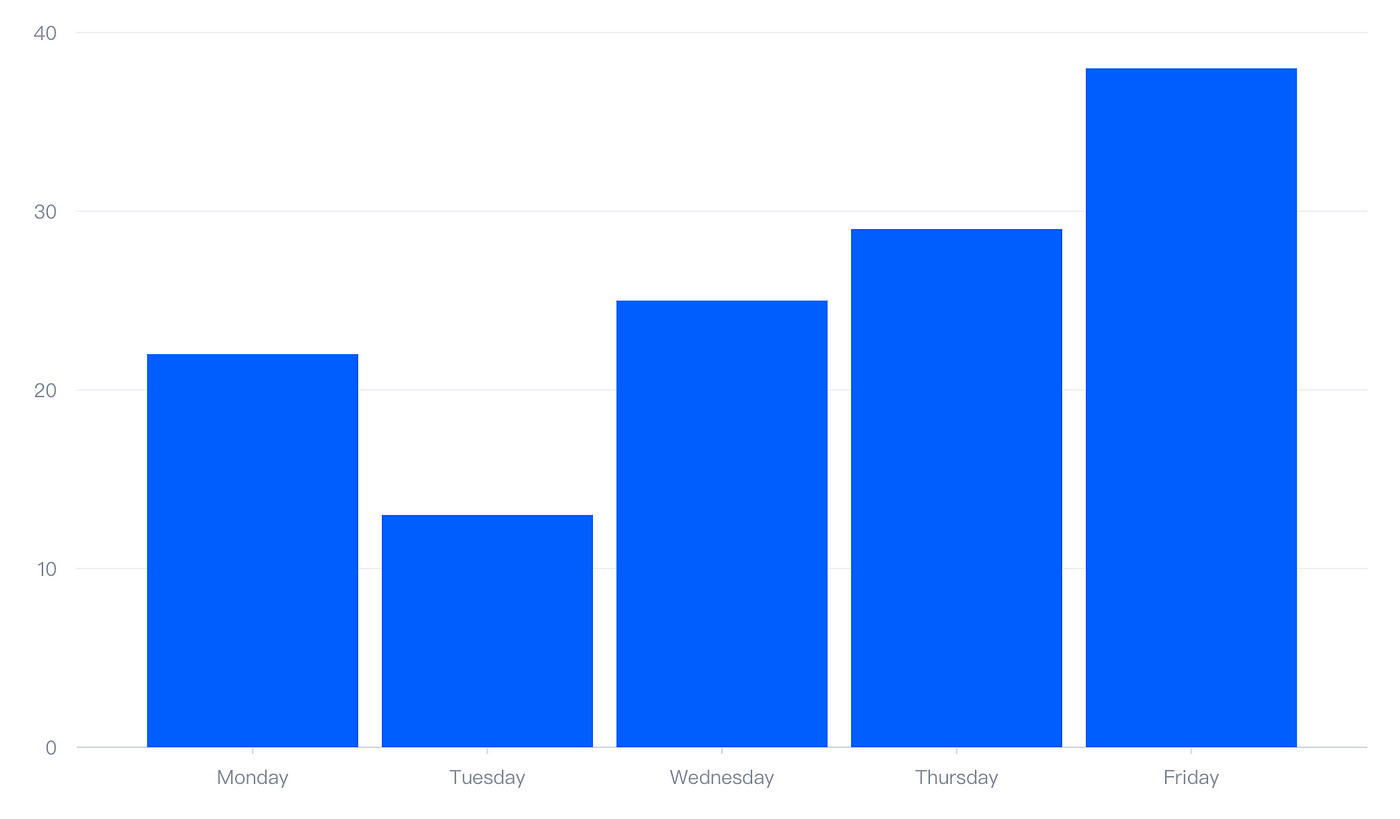
For code details, see::https://visactor.io/vchart/guide/tutorialStarted
Rich chart types
Cover commonly used statistical charts
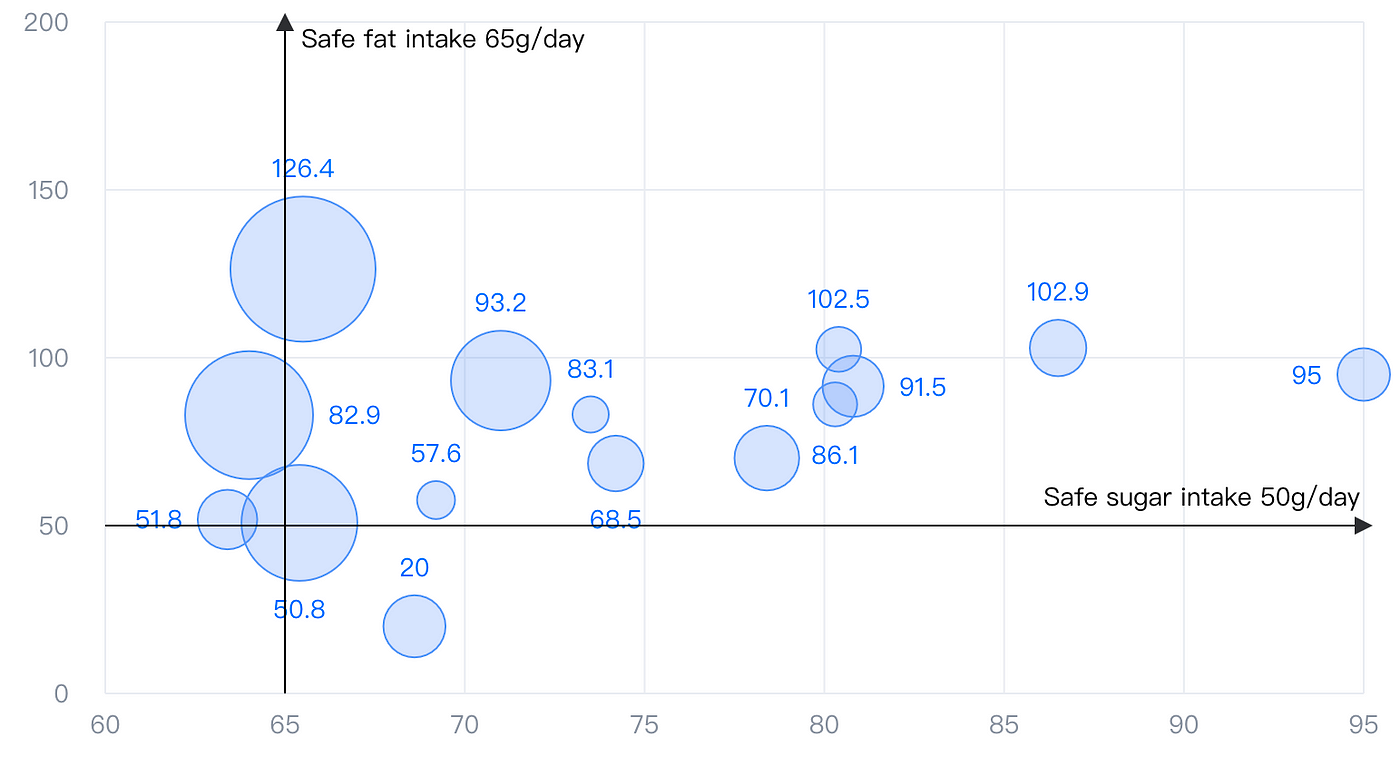
Based on VGrammar, VChart first targets traditional statistical chart applications, covering common chart types based on existing business accumulation.
In response to a constant stream of user requests, chart types and features are also increasing.
3D chart
Based on the self-developed rendering engine VRender, VChart provides a new type of 3D chart for users to use in 3D visualization scenarios.
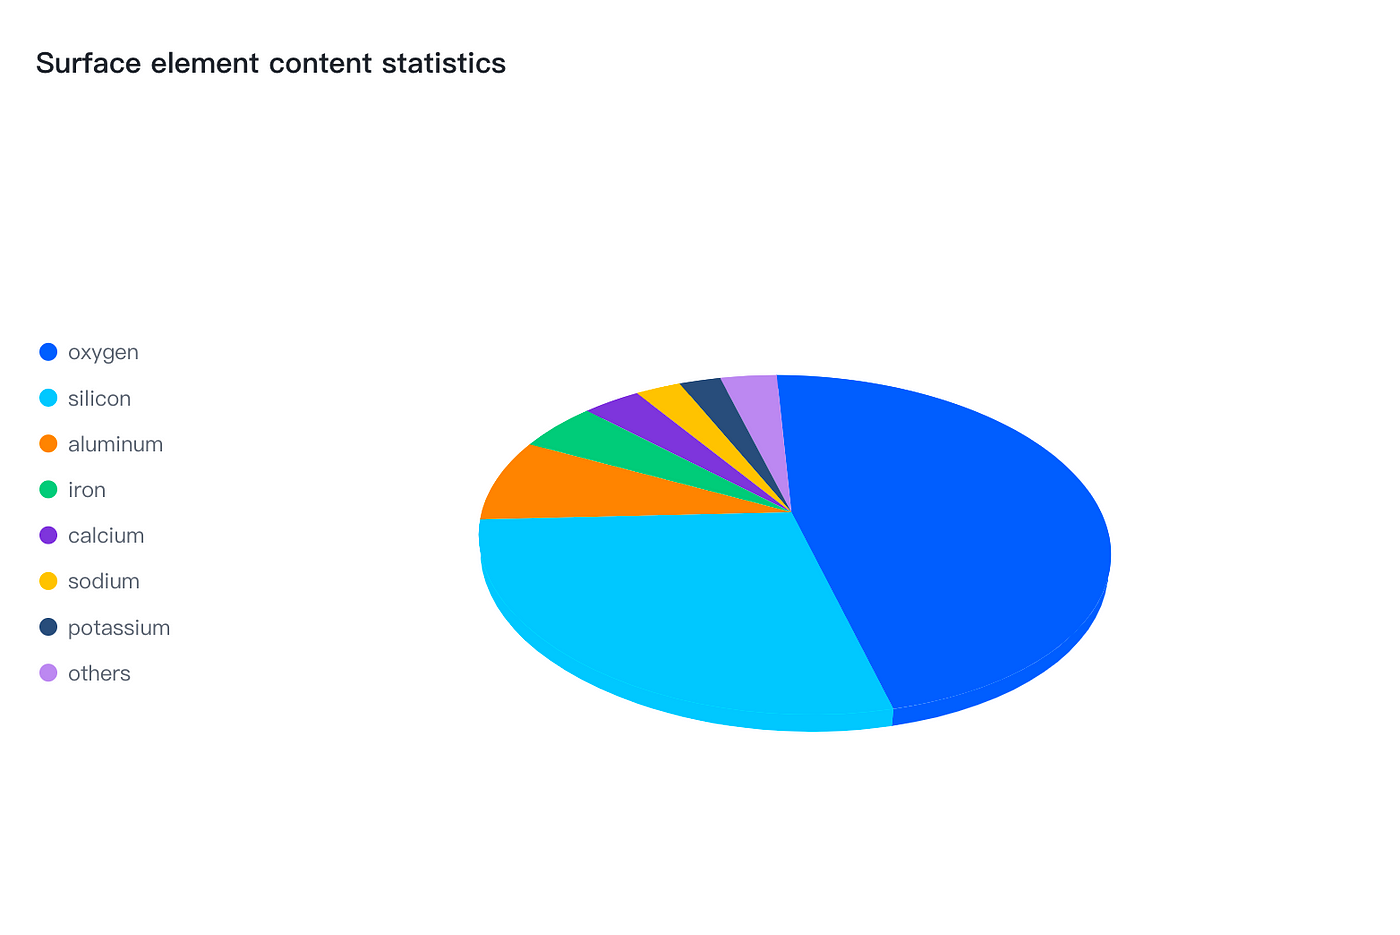
Live Demo:https://visactor.io/vchart/demo/chart-3d/pie3d
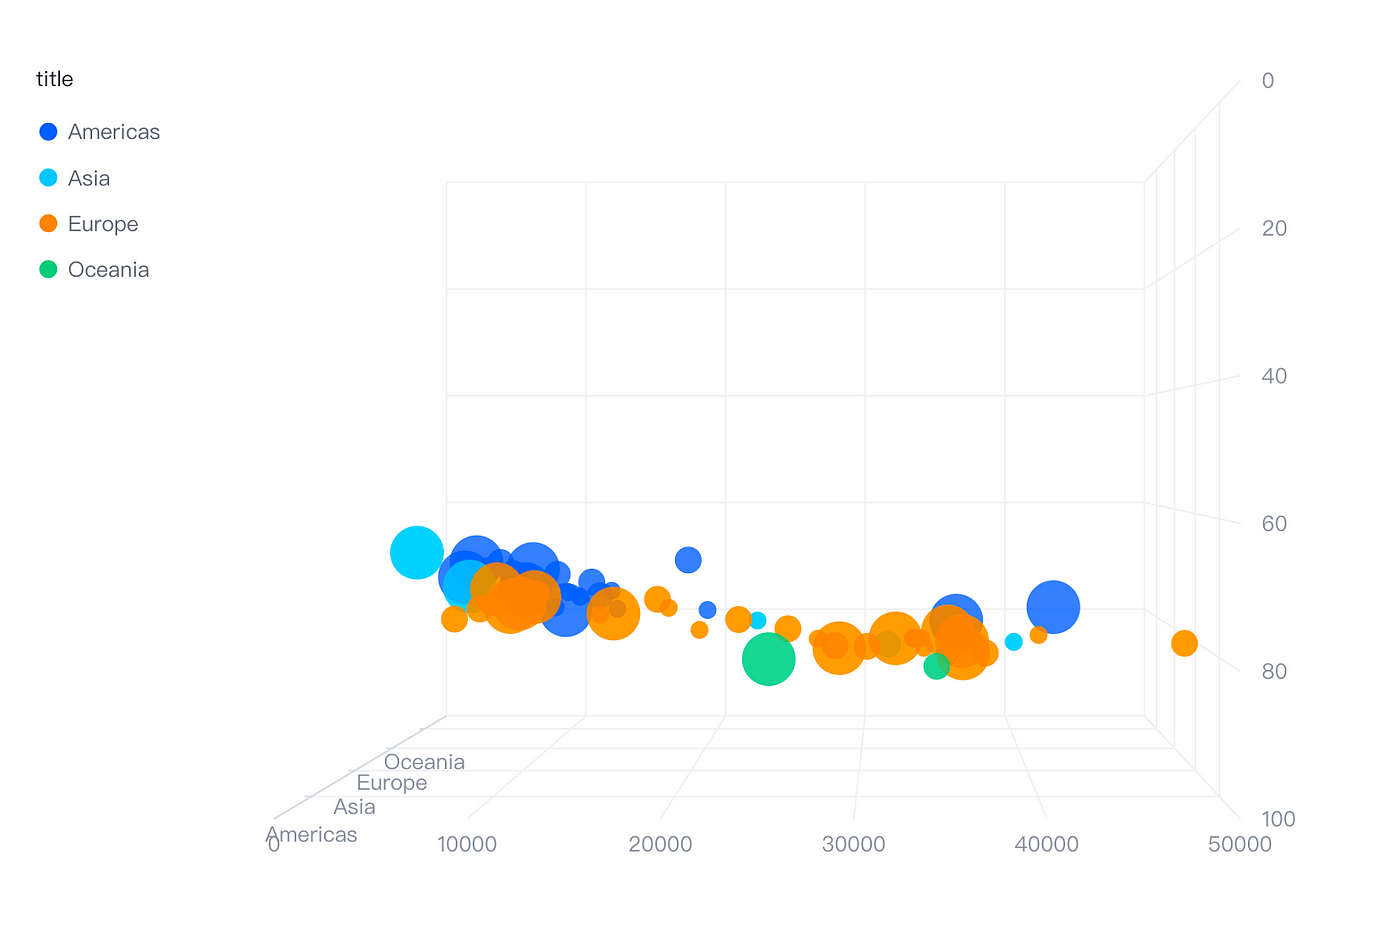
Live Demo:https://visactor.io/vchart/demo/chart-3d/scatter3d
Live Demo:https://visactor.io/vchart/demo/chart-3d/wordcloud3d
Live Demo:https://visactor.io/vchart/demo/chart-3d/line3d
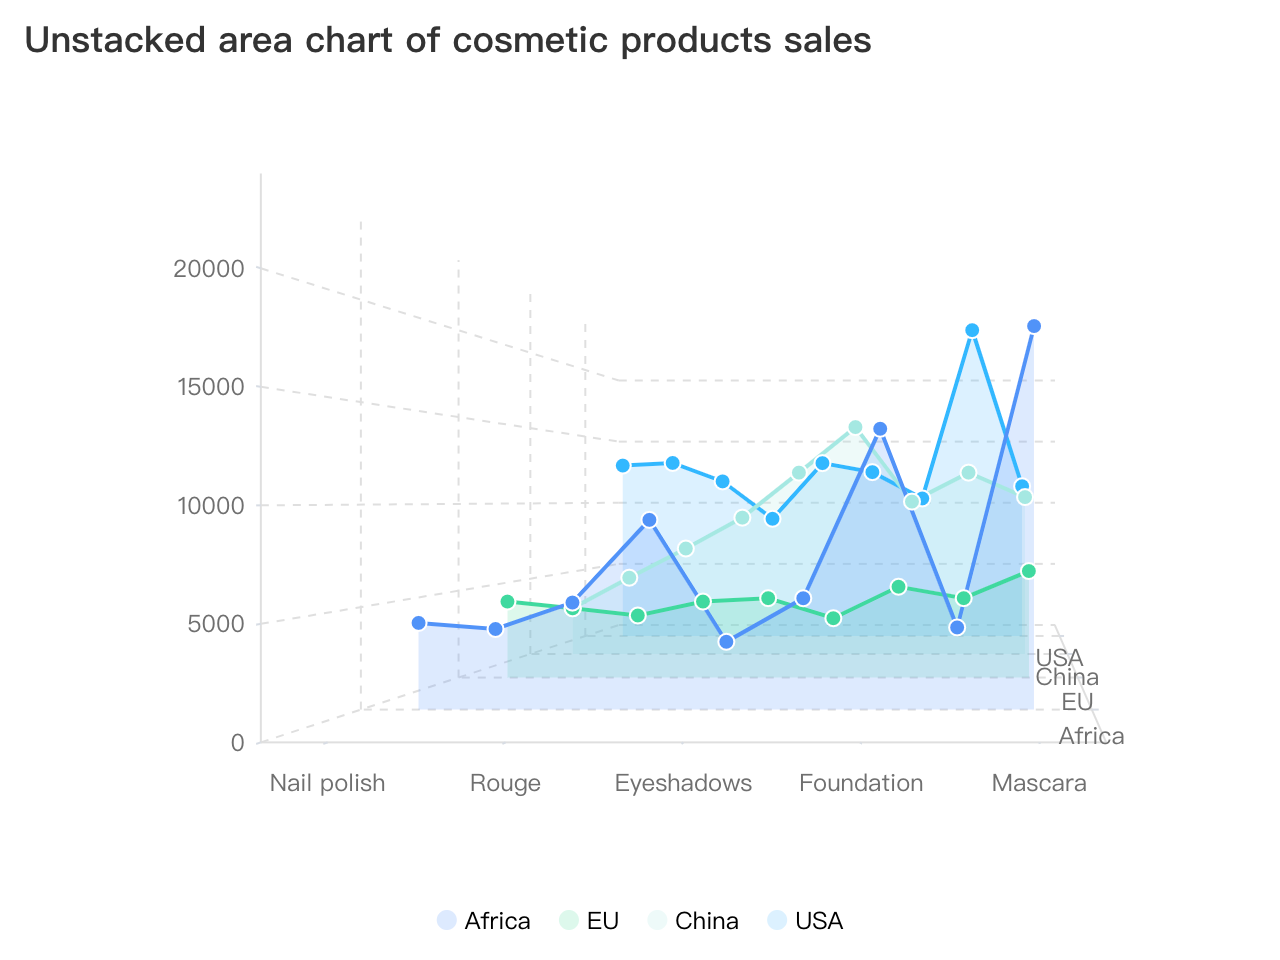
Live Demo:https://visactor.io/vchart/demo/chart-3d/area3d
Live Demo:https://visactor.io/vchart/demo/chart-3d/bar3d
Narrative template
For typical narrative scenarios, VChart abstracts simple and easy-to-use template charts, which can generate narrative works with simple configuration.
demo:https://www.visactor.io/vchart/demo/example/area-chart/storytelling/timeline-scatter
It is said that a large number of narrative templates are on their way, let’s look forward to it together.
Super high rendering performance
VChart strives for excellence in multiple environments such as data processing, syntax parsing, and graphic rendering, pursuing performance first. Especially in the Big data rendering scenario, it provides various means such as sharding, sampling, and progressive rendering, striving to achieve the effect of fast first-screen graphics, smooth animation, and smooth interaction.
An example is as follows: javascript const spec = { type: 'common', data: [ ... ], series: [ { data: { id: 'data0' }, type: 'bar', xField: 'time', yField: 'value', /** Whether to enable Big data rendering mode. Enabling it will reduce the rendering accuracy. */ large: false, /** Enable the threshold of Big data rendering optimization, corresponding to the length of data; recommended largeThreshold < progressiveThreshold */ largeThreshold: 500, /** Sharding length */ progressiveStep: 100, /** Enable the threshold for sharding rendering, corresponding to the length of a single series of data */ progressiveThreshold: 1000, }, ... ], };
Live Demo:https://visactor.io/vchart/guide/tutorialRender
Narrative-oriented animation design and arrangement
The importance of animation in visualization cannot be underestimated. Through animation, data can be presented in a vivid way to better tell the story behind the data. Telling good data stories is also the original intention of VChart, for which we have designed and implemented a new animation syntax.
In terms of rendering timing, it is divided into: new element animation, update element animation, exit element animation, and normal animation; among them, update animation can be divided into: data update animation, series configuration update animation.
In terms of animation scope, it is divided into element animation, global morphing animation, etc.
Element animation
In VChart, there are some common animation types built-in. These animation types can be directly used in the configuration to achieve common primitive animation effects. Here are a few examples.
FadeIn and fadeOut animation

Live Demo:https://visactor.io/vchart/guide/tutorialandofAnimations
Zoom Animation
demo url:https://visactor.io/vchart/guide/tutorialandofAnimations
MoveIn and MoverOut Animation
Live Demo:https://visactor.io/vchart/guide/tutorialandofAnimations
Rotation animation
Live Demo:https://visactor.io/vchart/guide/tutorialandofAnimations
Global deformation animation
Based on the previous description, entry and data updates are relatively easy to understand, but what is a series configuration update animation? It can be understood as a transition animation required for a chart to change from one type to another. The transformation of the chart type will inevitably bring about changes in the shape of the elements. Based on the support of VGrammar animation syntax, the elements can smoothly undergo deformation transitions. Deformation animation is divided into: one-to-one animation, one-to-many animation, and many-to-one animation.
One-to-one
Live Demo:https://visactor.io/vchart/guide/tutorialTypes
One-to-many
Live Demo:https://visactor.io/vchart/guide/tutorialTypes
Many-to-one
Similar global deformation animations can be implemented in various series transitions:
Animation choreography
In order to better arrange and display the different states of the chart, we provide configurations such as animation duration, animation extension start duration, animation easing effect, and sequential execution to accurately grasp the time nodes and playback speed. In addition, we support multiple parallel animation timelines and serial animations within the timeline, as well as transitional animations that switch between different chart types, which greatly enhance the animation arrangement ability and support richer narrative scenes.
Live Demo: https://visactor.io/vchart/demo/storytelling/weekly-activity

Live Demo:https://visactor.io/vchart/guide/tutorialandofAnimations
Animation control
Through the player component, basic operations such as play, pause, forward, and backward can be realized to help users better control the evolution of animations.
Live Demo:https://visactor.io/vchart/demo/storytelling/dynamic-comparative-bar-chart
Powerful interaction and information display capabilities
VChart contains a powerful component system, including: axes, legends, annotations, prompt information, box selection, crosshairs, thumbnail axes, scroll bars, indicator cards, labels, players, and titles. Users can configure charts with richer data details, simpler interactive operations, and freer animation playback with a simple sentence. In addition, we use a high-performance component system encapsulated by the underlying rendering engine VRender, and decouple it from the VChart chart business logic to bypass unnecessary processes and achieve purer and more efficient results.
Highly customized tooltip
In VChart, prompt information is not limited to text. With the tooltip handler, you can customize any form of detailed information.
Live Demo:https://visactor.io/vchart/demo/tooltip/custom-tooltip-handler
Legend compatible with different data
In VChart, the types of legends include but are not limited to discrete legends that enumerate and filter category information, as well as continuous legends that represent numerical mapping relationships and filter by value, and color legends that represent color mapping relationships and filter by value.
Live Demo:https://visactor.io/vchart/demo/legend/continuous
Crosshair and DataZoom in different coordinate systems
In VChart, crosshair not only exists in the cartesian coordinate system in the form of “crosses”, but also accurately indicates the position of the mouse in the form of arcs, rays, or sectors in polar coordinate system scenarios.
Live Demo:https://visactor.io/vchart/demo/crosshair/polar-line
In VChart, the dataZoom is no longer the exclusive controller of the cartesian axis, and its data filtering and statistical capabilities are also applied to polar coordinate systems.
Live Demo:https://visactor.io/vchart/demo/data-zoom/data-zoom-polar
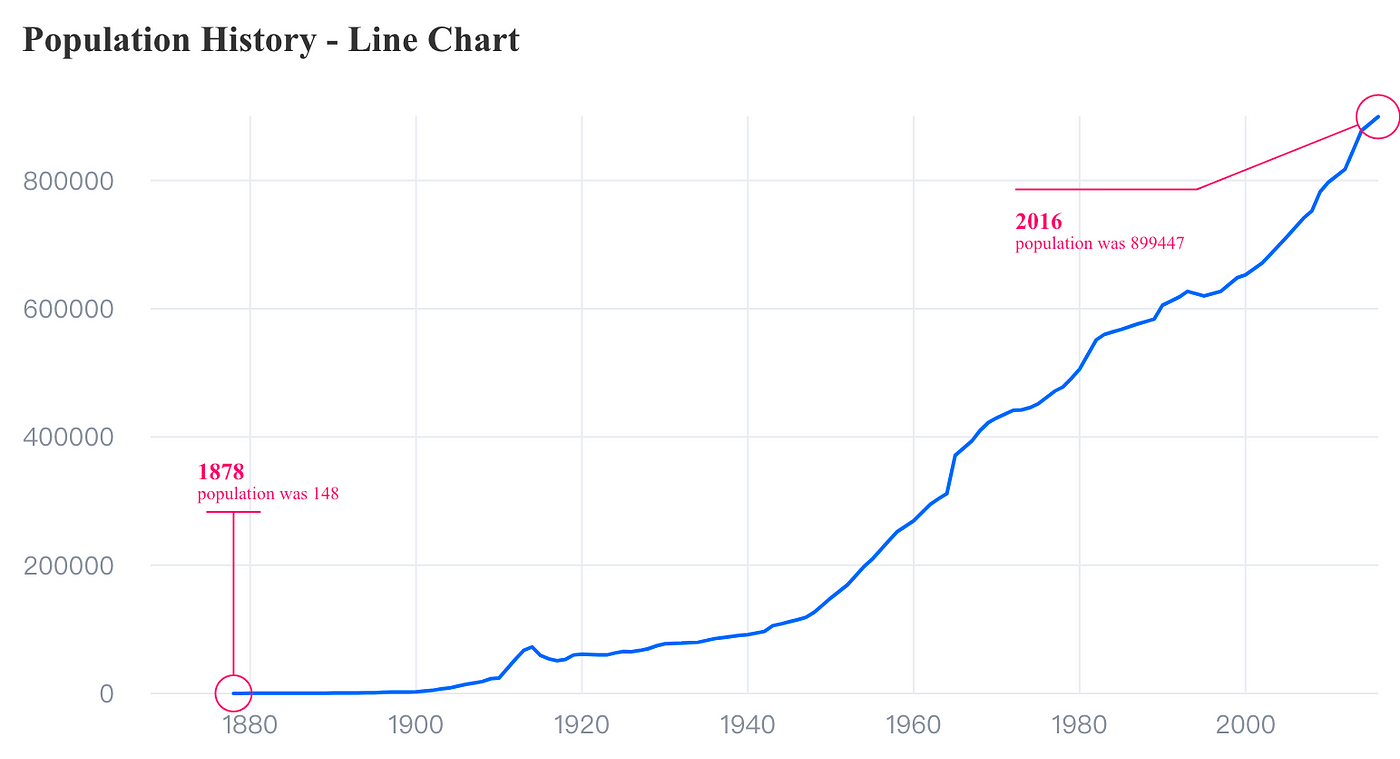
Labels with reasonable layout
In VChart, the layout of labels will be more reasonable, and the label anti-overlap logic in limited space will also avoid messy information expression.
Live Demo:https://visactor.io/vchart/demo/marker/mark-line-basic
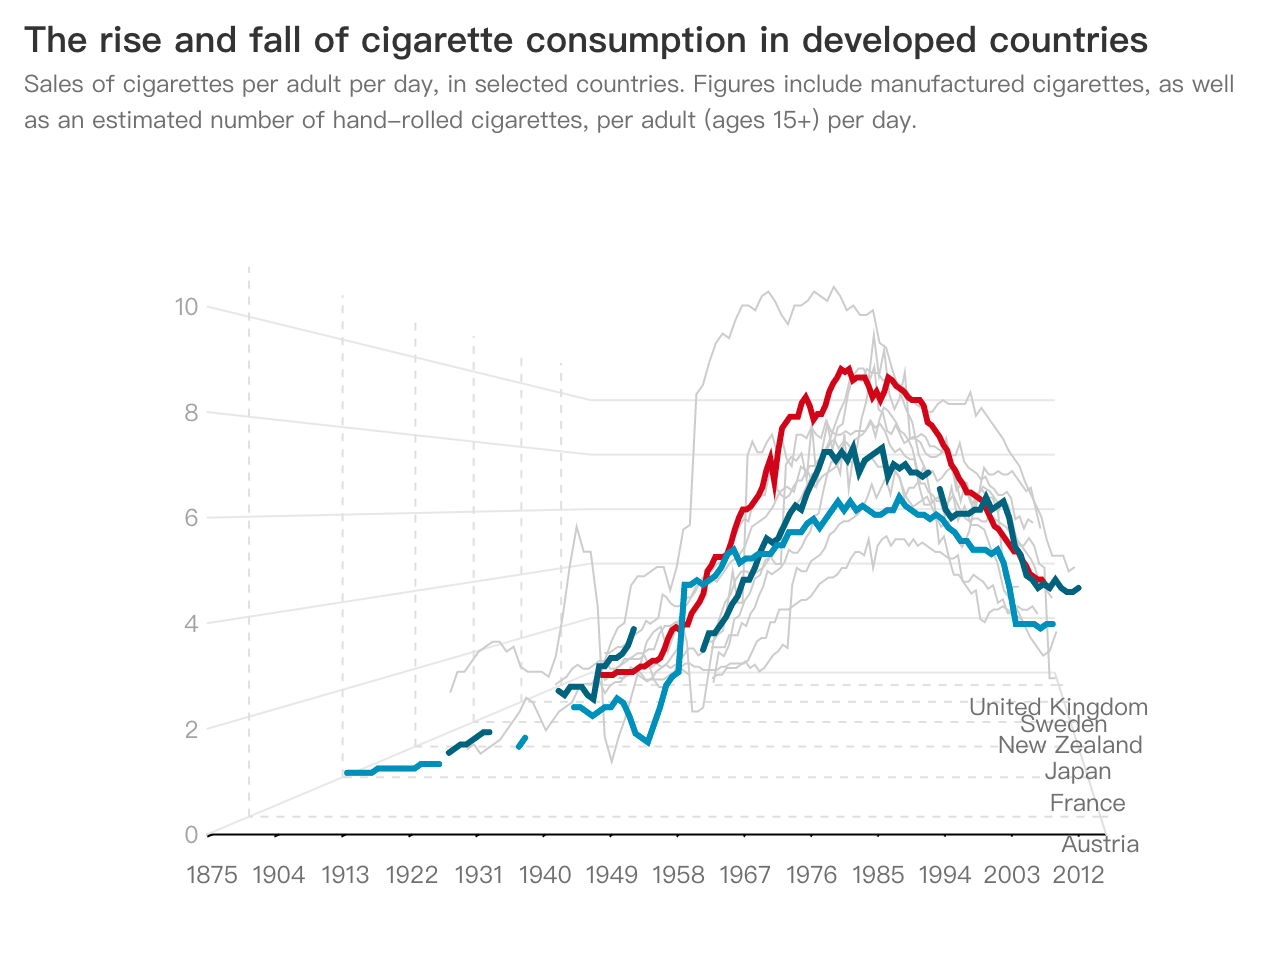
Various Forms of Data Annotation
In VChart, annotations are divided into markLine, markArea, and markPoint. Their functions are not limited to annotations for individual data elements, but are expanded on top of them: aggregation and regression calculation of multiple data elements; data markers across layout units; positioning markers in data coordinate axis space; positioning markers at any position; diversified formats of annotation content.
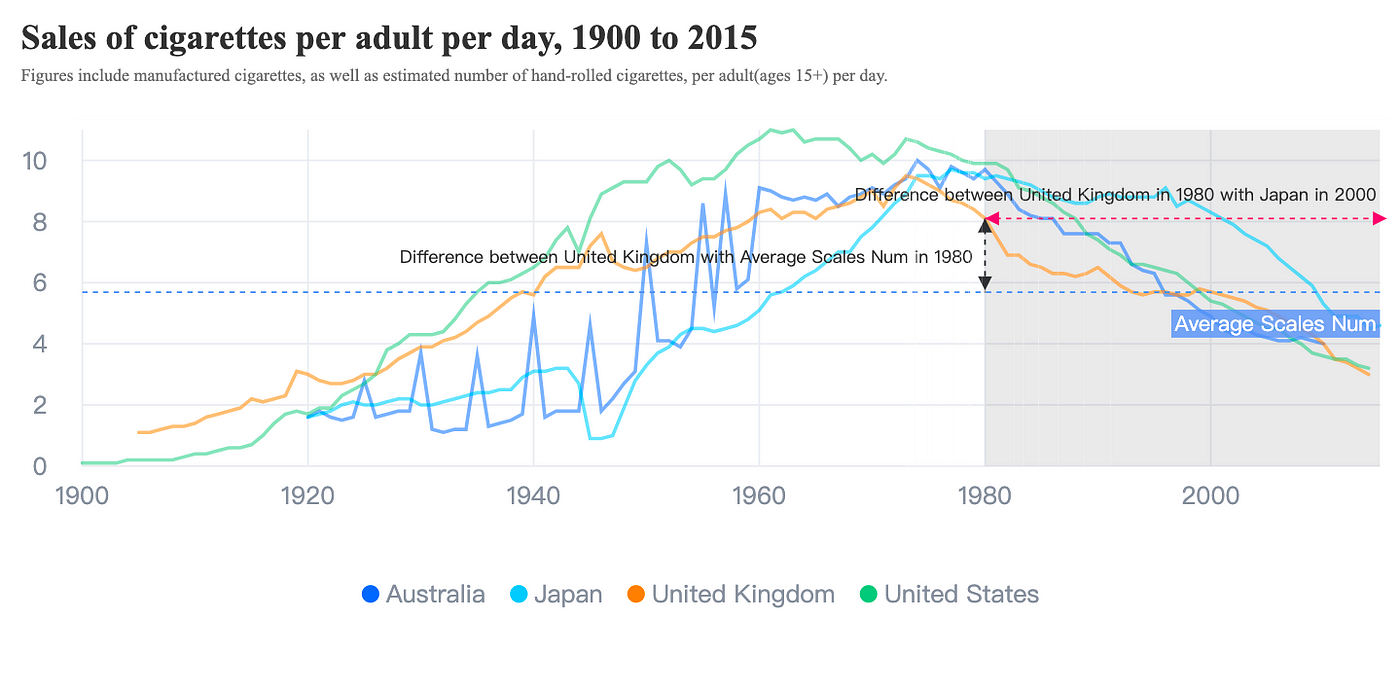
Live Demo:https://visactor.io/vchart/demo/marker/mark-point-basic
One code, multiple terminals, automatically adapt to multiple environments
VChart can automatically adapt to desktop, H5, and multiple Mini Program environments, which means that developers only need to write code once to run on multiple platforms, greatly improving development efficiency.
For various Inter-App communications environments (mainly nodes, various Mini Programs, etc.) Currently on the market, VChart’s underlying rendering engine VRender has narrowed and smoothed out the API differences in each environment. Therefore, at this level of VChart, users only need to configure the mode parameter when using a new VChart instance to determine which environment to use.
Currently supported Inter-App communications environments are:
- Block Mini Program: https://github.com/VisActor/VChart/tree/develop/packages/block-vchart
- Lark Mini Program: https://github.com/VisActor/VChart/tree/develop/packages/lark-vchart
- TT Mini Program:https://github.com/VisActor/VChart/tree/develop/packages/tt-vchart
- WX Program: https://github.com/VisActor/VChart/tree/develop/packages/wx-vchart
For specific usage tutorials, see:https://visactor.io/vchart/guide/tutorialandEcology/mini-app/how
Flexible and consistent layout strategy
We never consider a chart as an independent entity. It is assembled from various components and data series that can be reused. Each component and data series has its own container. How to properly layout these containers has become the focus of visual developers’ thinking. To meet different layout needs, VChart supports three layout modes: “placeholder layout”, “row-column layout” and “custom layout”.
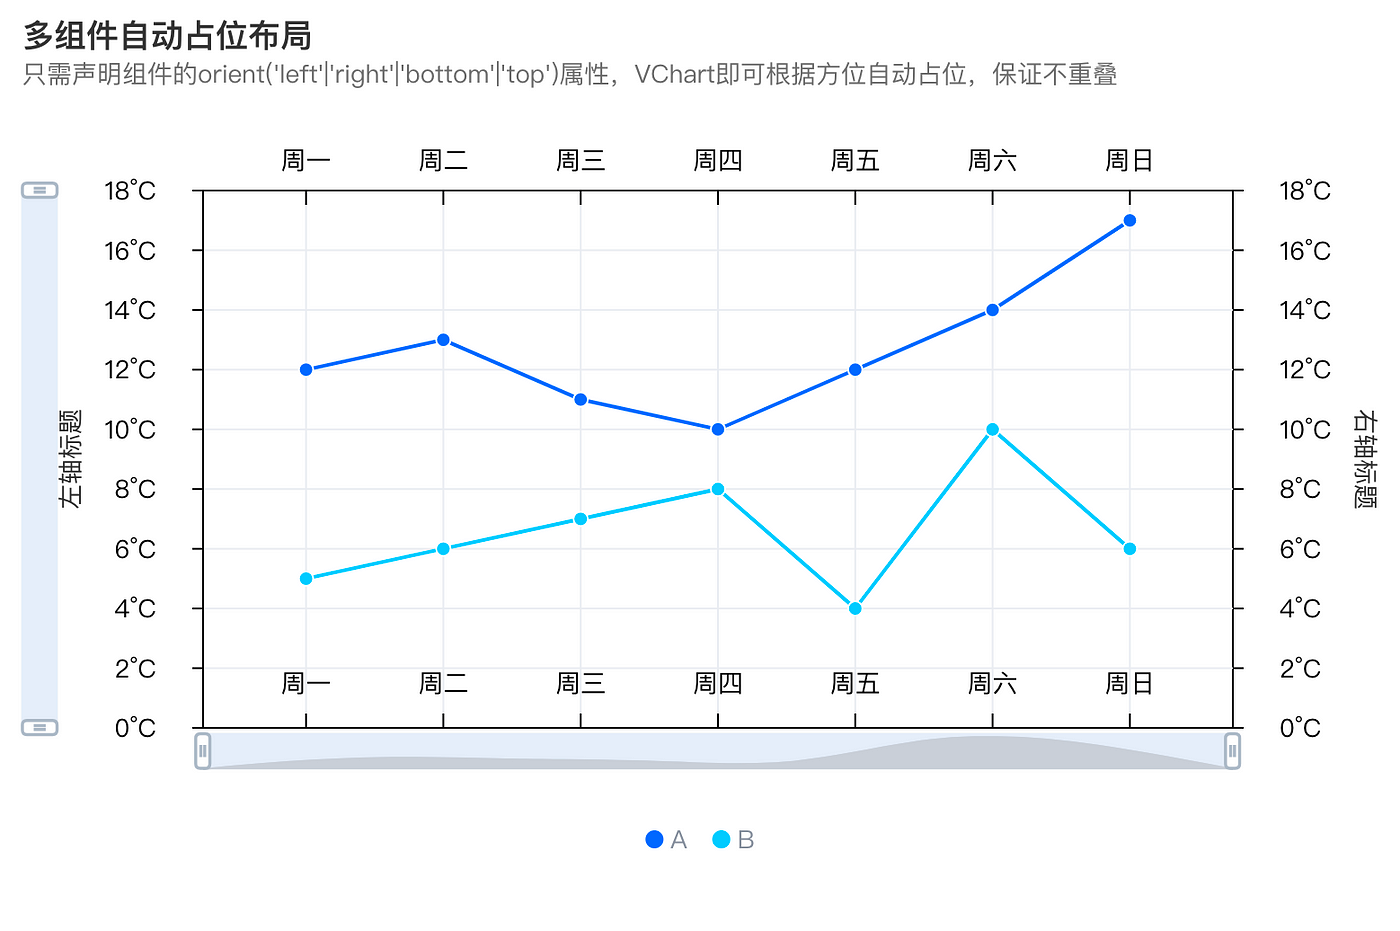
Space-occupying layout
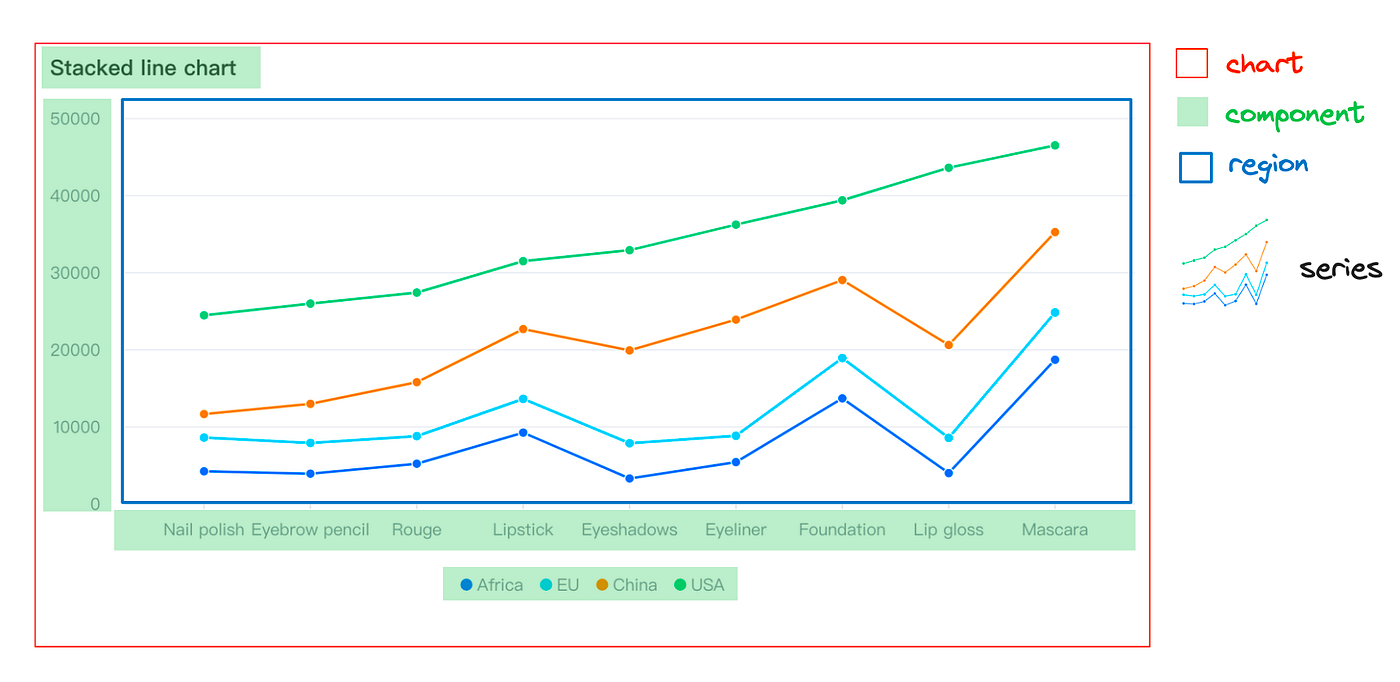
The placeholder layout will be automatically matched according to the functional characteristics and corresponding relationships of different containers or components, and reasonable results can be obtained without any configuration.
The elements involved in placeholder layout are divided into two types:
- Components provide auxiliary capabilities to help chart reading and interaction, such as legends, coordinate axes, tooltip, datazoom, etc.
- A region is a spatial information element that can be associated with one or more sets of series to help them locate in space. At the same time, a region is also a minimum combination unit.
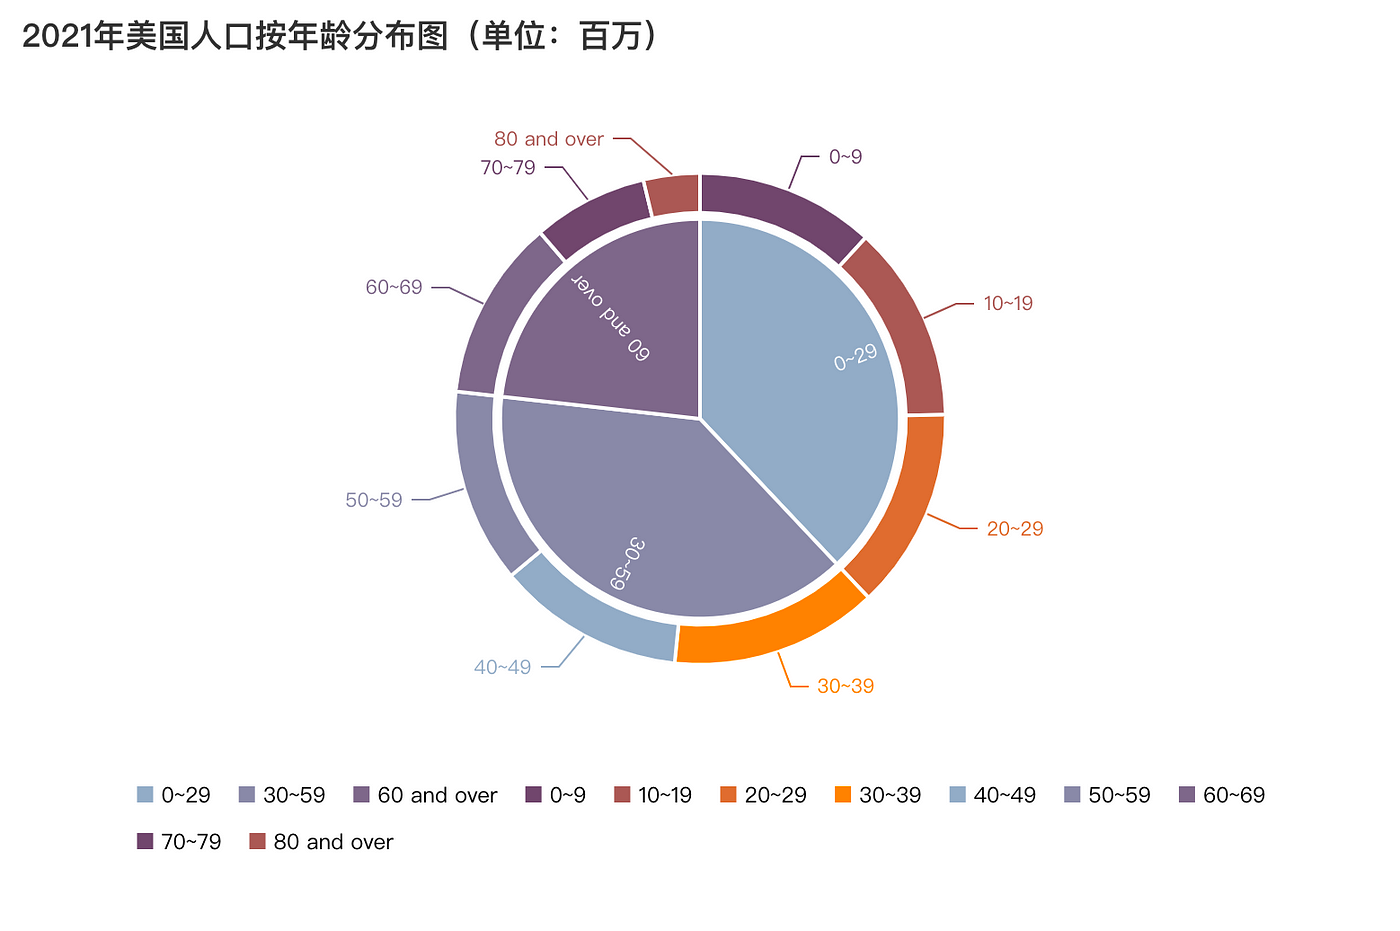
Live Demo:https://visactor.io/vchart/demo/pie-chart/nested-pie
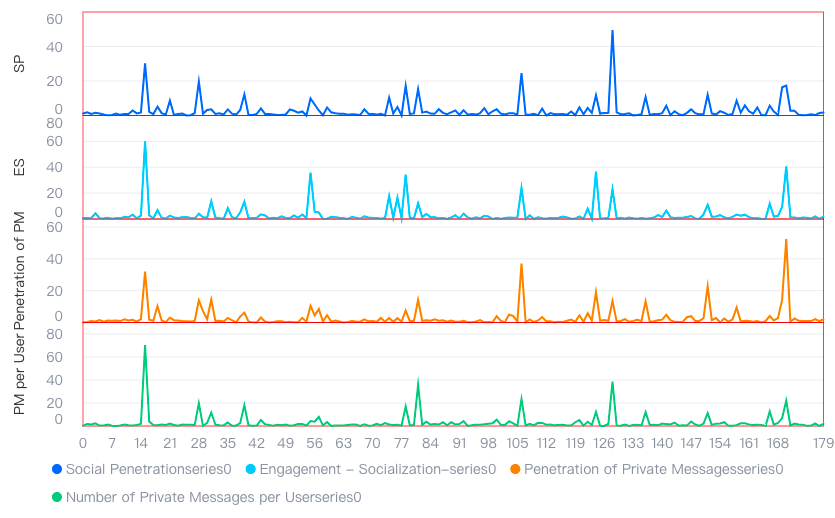
Row and column layout
In row and column layout, you need to declare the layout module and row and column attributes to bind specific chart elements to the corresponding module.
modelId: The ID of the layout module.col: The column number in which the element is located. Counting starts from left to right, starting from 0.row: The row number in which the element is located. Counting starts from top to bottom, starting from 0.colSpan: The number of columns that the current element occupies in the column direction. Default value is 1.rowSpan: The number of rows that the current element occupies in the row direction. Default value is 1.
Here is a simple layout declaration example: javascript layout: { type: 'grid', // layout type col: 1, // col count row: 2, // row count elements: [ { modelId: 'legend', // layout model id col: 0, // model col colSpan: 2, // col span row: 0 // model row }, { modelId: 'Social Penetration', col: 0, row: 1 } ] }, region: [ { id: 'legend', // region model id }, { id: 'ocial Penetration', } ],
Custom layout
In the chart, in addition to the built-in layout logic, users can also achieve fully customized layouts through the custom layout interface. ``javascript /**
- register layout
- @param layouts class */ useLayout: (layouts: ILayoutConstructor[]) => void;``
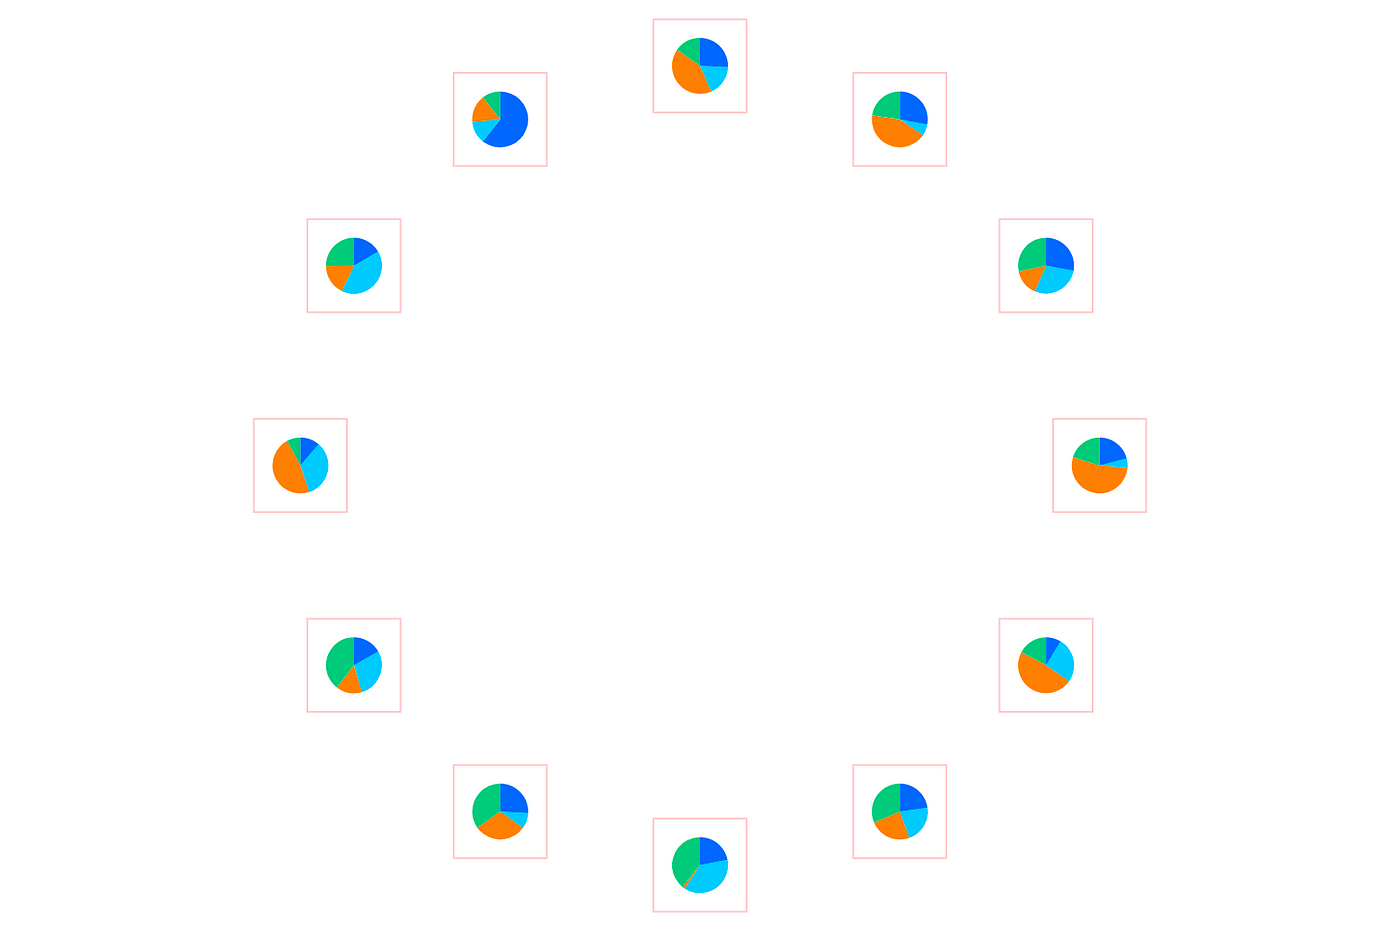
Live Demo:https://visactor.io/vchart/demo/layout/custom-layout
Global theme registration and switching
VChart provides finer grained configuration options, allowing you to customize charts, components, series styles, color schemes, and other primitive properties according to your needs, whether it’s pixel-precise fine-tuning or new design styles.
theme registration and switching
Live Demo:https://visactor.io/vchart/demo/theme/theme-switch
Scenario-based theme registration and switching
Chart styles are usually divided into three modules: “Colorset”, “Series Element Style”, and “Component Style”.
- Colorset: comes from business precipitation and serves the visual scene expression.
- Series Element Style: The’series element style ‘can be configured through primitive basic styles.
- Component style: it is implemented through the specific configuration of each component.
Finally, write these configurations into the theme, and then register and switch themes to achieve chart style effects in different scenarios.
Live Demo:https://visactor.io/vchart/demo/theme/theme-style
Application scenario
Practice brings true knowledge. VisActor has developed from practice and serves more scenarios, forming a good development trajectory. Here are a few typical scenarios to illustrate the value that a good chart library can bring to a product.
BI & Data Analysis
Data products are the core application area of statistical charts, and powerful chart capabilities can add multiple commercial values to products.
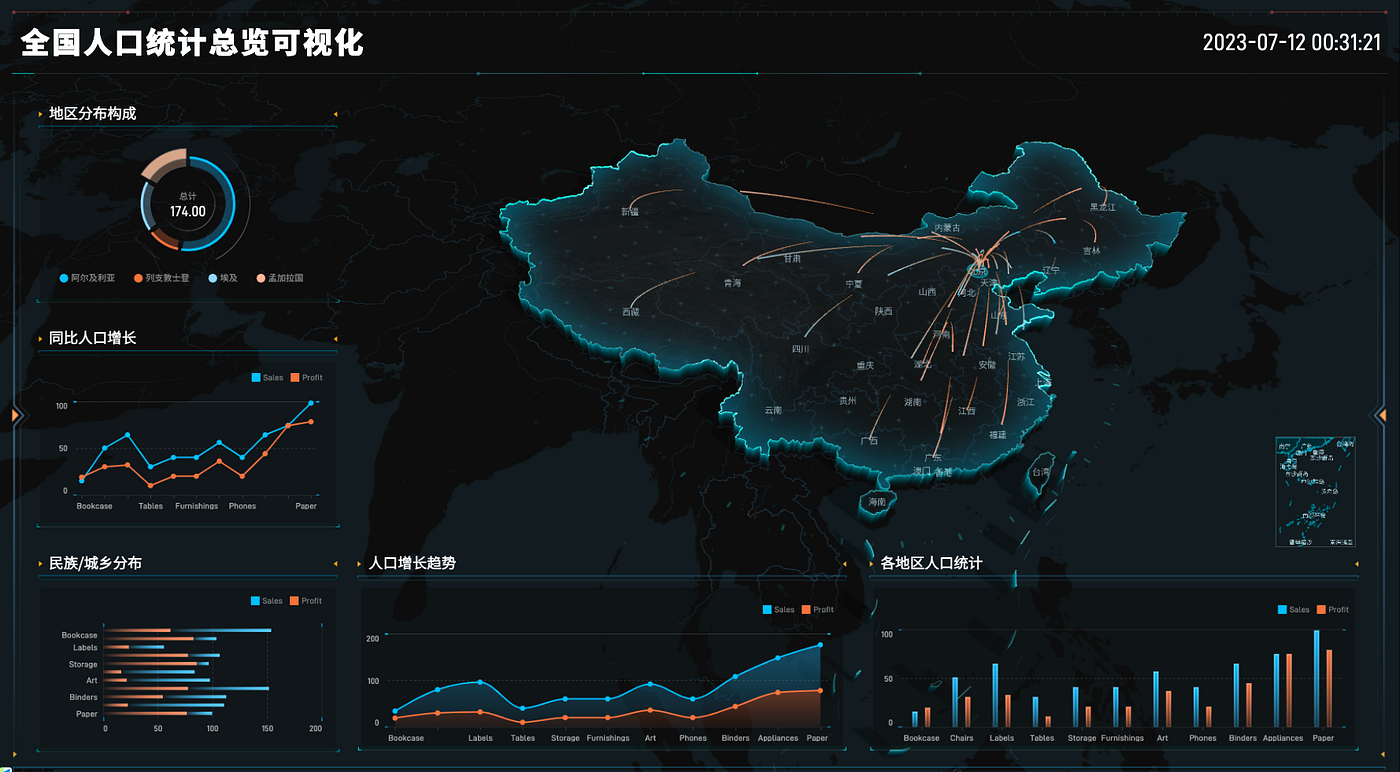
Digital large screen
Large-screen products pose new challenges to chart presentation forms, animations, and themes. VChart’s flexible expansion capabilities can quickly meet the needs of various customized large screens.
Work suite
VChart, with its excellent data presentation and annotation capabilities, has also been widely used in the Office suite.
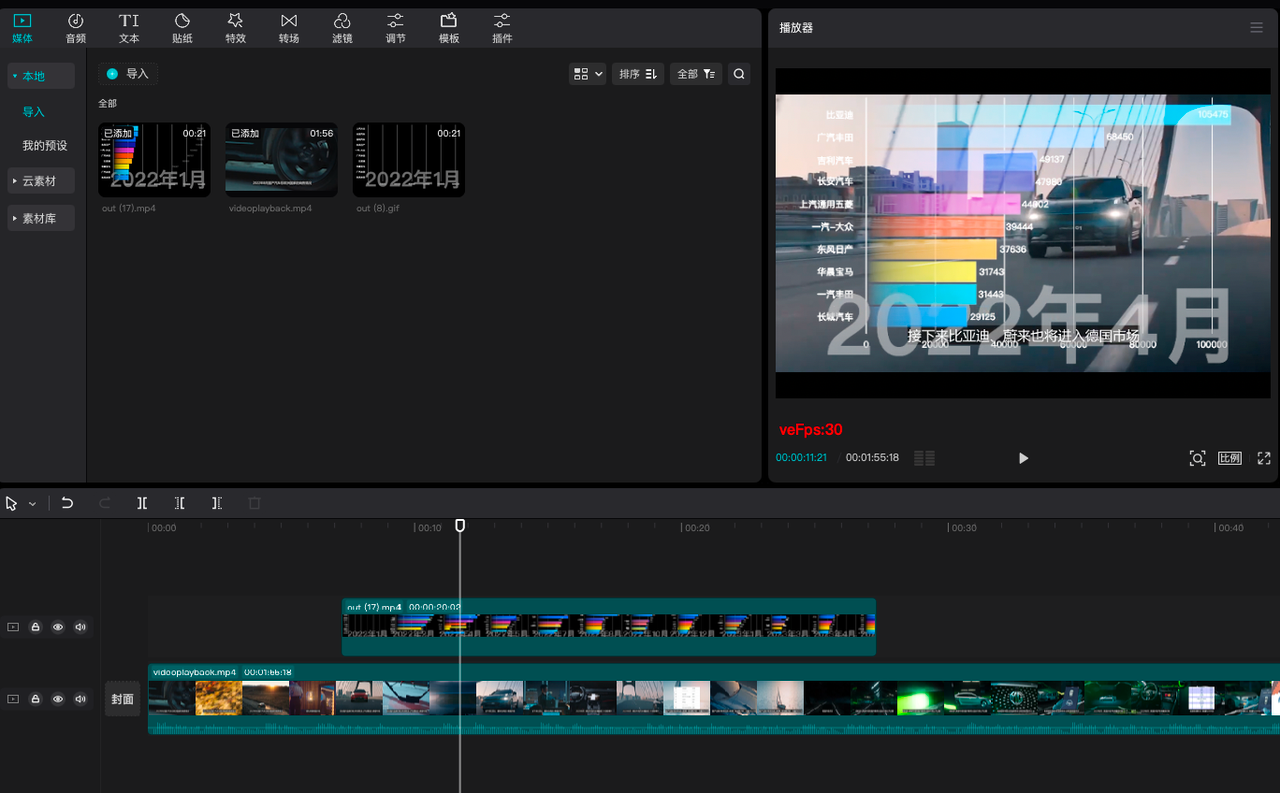
Video making
With the development of short video media, more and more data videos are favored by creators. VChart is also being combined with some video editing tools to help content creators produce better data video content.
Conclusion
The development goal of VChart is consistent with the overall positioning of VisActor, targeting the development of narrative visualization and intelligent visualization. It has just started, and all friends who like visualization, like open source, and have a need for visualization are welcome to actively participate, use, evaluate, and provide opinions.
Contact information
Official Website: https://www.visactor.io/vchart
There is no moon tonight, looking forward to you lighting up the starry sky, thank you Star:
github:https://github.com/VisActor/VChart
More references::
- https://medium.com/@xuanhun9/vtable-not-just-a-high-performance-data-analysis-table-5a6c7f04751d
- https://medium.com/@xuanhun9/magic-frame-unveiling-the-secrets-of-data-visualization-animation-50c1ebe1714
- https://medium.com/@xuanhun9/visactor-narrative-oriented-intelligent-visualization-solution-ede02002bc60