
Chart Components
This tutorial will introduce the chart components of VChart in detail to help everyone better understand VChart.
Terminology Definition
Before delving into the chart components, we need to understand the following terms:
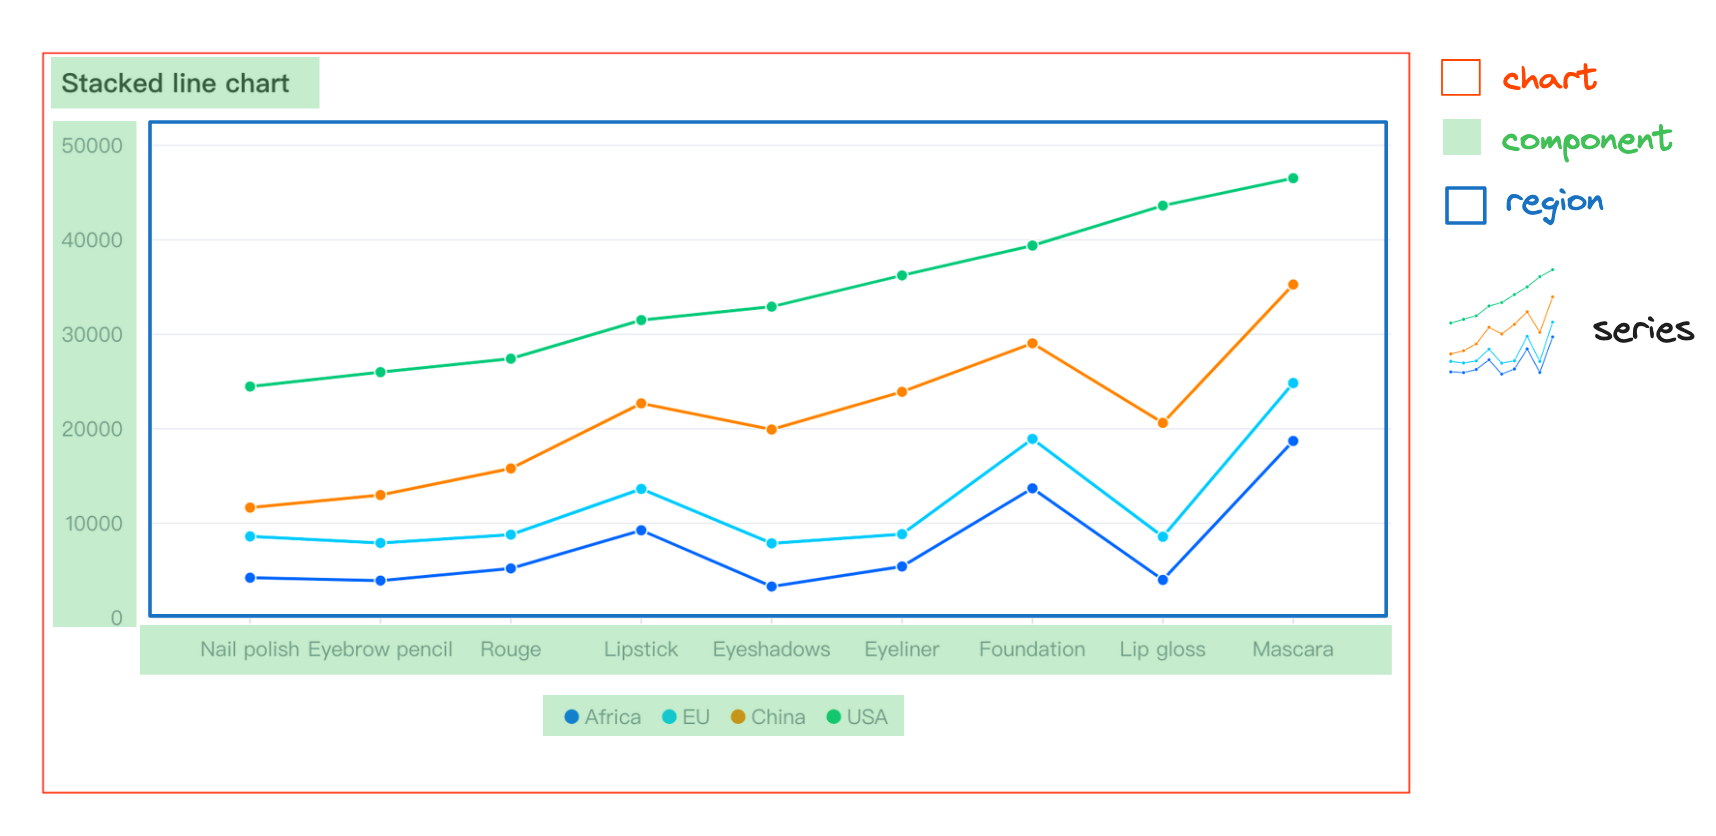
series- The main body of the chart, also known as the series, which contains a set of graphics elements and their corresponding chart logic.mark- Basic graphic elements, also known as basic graphics, such as points, lines, shapes, etc.region- Spatial information elements, related to one or more series, helping to locate the space.component- Components that help with chart reading and interaction, such as legends, axes, tooltips, etc.layout- Layout, managing the spatial distribution of chart elements.chart- Abstract concept of the chart, integrating and managing various elements such as data, graphics, components, and layout.
Chart Definition
Logical Layer Chart Elements
We break down the logical layer elements of the chart into the following four parts:
- series is the main body of the chart, containing a set of graphics elements and the corresponding type of chart logic. For example, in a line chart, the series refers to the collection of points and lines and all the logic of the line chart, etc.
- component provides auxiliary capabilities, helping chart reading and interaction components, such as legends, axes, tooltips, dataZoom, etc.
- region is a spatial information element that can associate one or more series and help the series to locate in space. At the same time, the region is also a minimal combination unit.
- chart is an abstract concept, which is the integrator and manager of various elements of the chart, such as data, graphics, components, and layout. It is the core context of the chart's logic layer.
Simple Chart
A simple chart is composed of a region, a determined type of series, component, and a chart that manages the chart logic. Taking a common line chart as an example, its composition is as follows.
Combined Chart
We define a combined chart as one consisting of multiple regions, multiple determined types of series, components, and a chart that manages the chart logic. Here, we encapsulate the chart as a type: 'common' combined chart.
In a combined chart, you can define several different types of sub-charts. Each sub-chart can independently configure its data and components, and all sub-charts are associated with the same region by default. At this time, the various sub-charts are overlapping on the region. We will use a common bar-line dual-axis chart as an example to describe the combined chart in detail:
- First, if we need to create a combined chart, we need to declare
type: 'common', indicating that the chart type we need to create is a combined chart. - As mentioned earlier, the chart is the integrator and manager of data, graphics, components, and layout, and it is composed of region + series + layout. The bar and line correspond to the 'bar' and 'line' series types, and by default, all series are associated with the same region, so we do not need to configure the region here.
- Each series can have its data source, or the data source can be configured directly on the chart, and the series is associated through
fromDataIdorfromDataIndex. In the current example, we choose to configure it on the chart.
As mentioned earlier, the region is a spatial information element that, in conjunction with the layout, can be used to divide the space of the canvas using multiple regions with different locations. At the same time, components can also specify the association with the region. When a component is associated with multiple regions, it will collect the data dimensions of all the sub-charts under the region for display, as shown in the following example.
View Layer Graphic Elements
Graphic Element Mark
The graphic element is the definition of the chart view layer for the graphics. VChart defines the graphic elements in the chart as including basic graphic elements and combined graphic elements.
Basic graphic elements include: marker (symbol), rectangle (rect), line (line), straight line (rule), arc (arc), area (area), text (text), path (path), image (image), 3D rectangle (rect3d), 3D curved line (arc3d), polygon (polygon), etc.
Combining multiple basic graphic elements forms a combined graphic element. We collectively refer to basic graphic elements and combined graphic elements as graphic elements.
The logical layer elements (such as the series series) are composed of several graphic elements, such as the area chart ('area') series, which includes points, lines, and area, with the corresponding basic graphic elements being: marker (Symbol), line (line), area (area).
The functions of graphic elements include:
- Flexible graphic element style configuration, including basic styles and interaction styles.
- Support for custom graphic elements to achieve more rich and customized chart requirements, see the Custom Graphic Elements chapter.