
Site Guide
This document is mainly to help you better use the VChart site and help you get the content you want on the site more quickly.
Getting Started
Quick Start
First, you need to complete the VChart Quick Start section, which will teach you how to configure and use the environment required by VChart, as well as how to build your first graphic.
Understand Your First Chart
After completing the Quick Start, you can learn more about how to create a simple line chart by studying the Chart Components section, including data, series, marks, and components configurations.
Documentation
VChart's documentation provides detailed information about features and configurations. Depending on your needs, you can check out the following sections:
- Tutorial: Introduces the basic concepts and various usage methods of VChart charts.
- Configuration Items: Provides detailed explanations of all configuration items for VChart charts.
- API: Provides detailed explanations of all available interfaces for VChart.
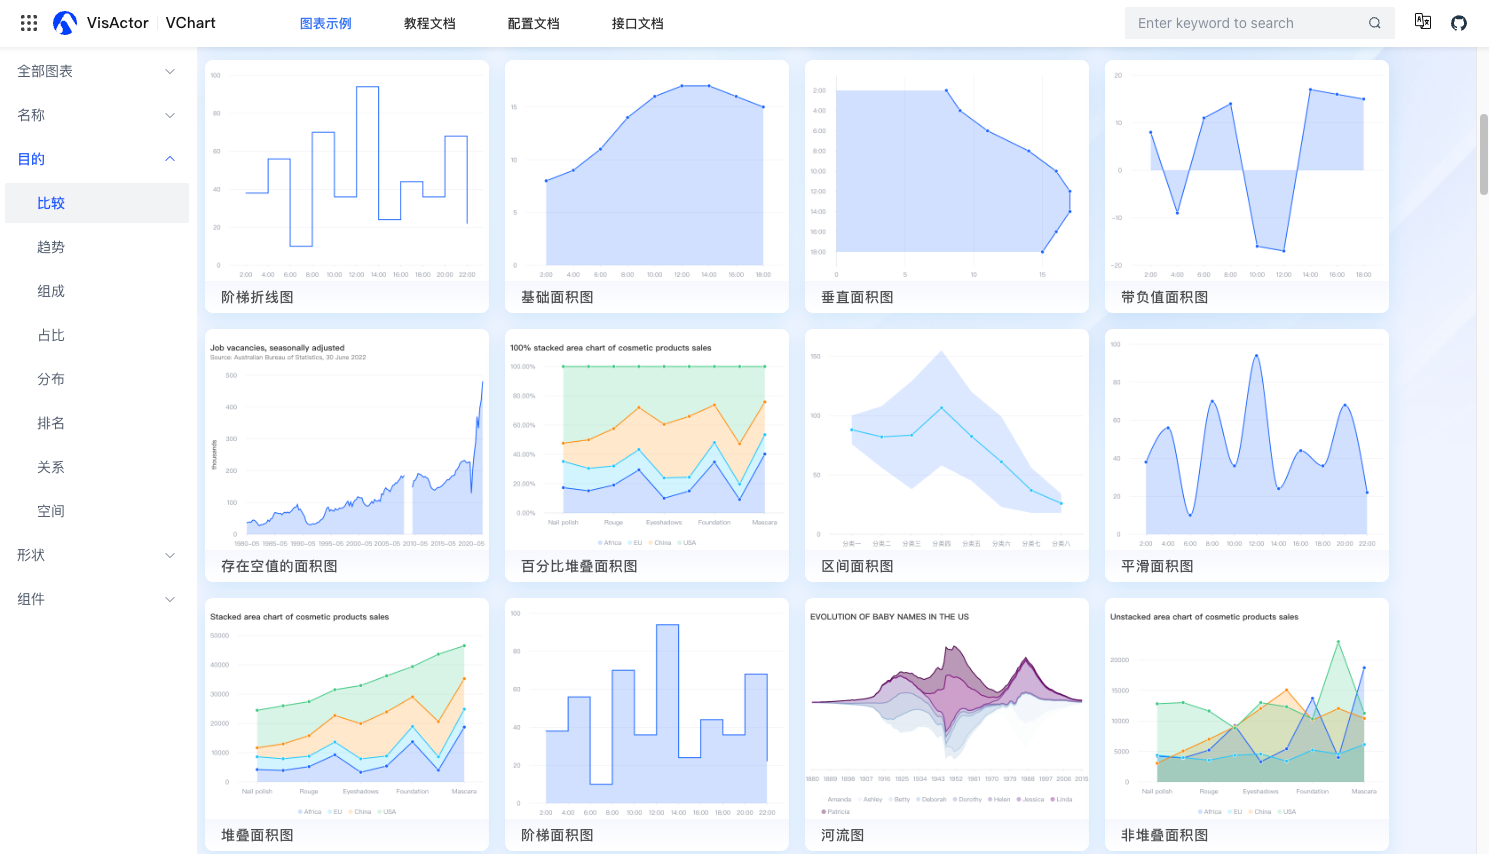
Chart Examples
The Chart Examples page provides many practical application examples of VChart charts, from simple bar charts and line charts to complex pie charts and radar charts. Each example provides a detailed description, key configuration information, and source code. You can also modify the example through the online editor and view the results. Additionally, to help you better understand and find charts, the example page also provides chart classification and search functions, allowing you to search by chart type, purpose, component, etc.
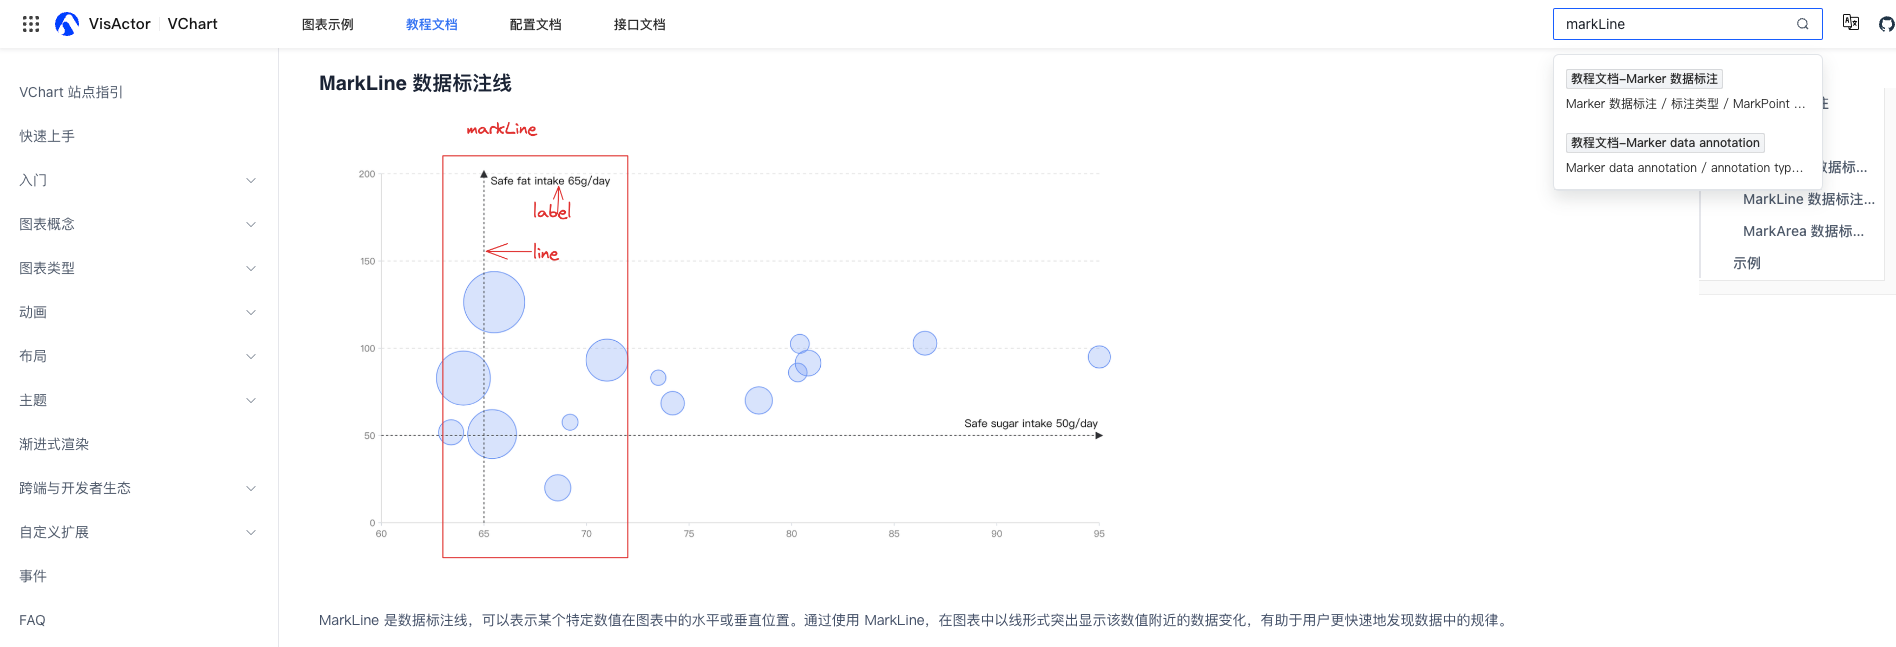
How to use the search function
This site provides a powerful search feature that allows you to quickly find relevant usage information. Click on the search box at the top of the site, enter keywords, and you will see matching results in the drop-down list. Choose the appropriate result to view related content.
How to ask questions & suggestions
We are happy to help you! If you encounter any issues while learning VChart, you can ask questions in the following ways:
- Submit an issue in the GitHub repository: Visit VChart GitHub and describe your issue in detail, and our team will respond and resolve it as soon as possible.
- Submit a discussion in the GitHub repository: Visit VChart Discussion, and you are more than welcome to put forward your ideas and suggestions here, and our team will respond and resolve them as soon as possible.
How to correct errors
If you find any issues in the document examples or believe that some parts can be improved, please let us know. You can provide us with error correction information in the following ways:
- Submit a pull request in the GitHub repository: Correct the content and submit it, and a team member will review and merge it.
- Submit an issue: Point out the issues in the documentation. The team members will verify and correct them as soon as possible.
Thank you for your help! We will continue to improve the documentation and provide a better learning experience for all VChart users.