It is not only a fully functional graph visualization library, but also an explorer of data relationships.
!!!###!!!title=records——VisActor/VTable tutorial documents!!!###!!!!!!###!!!description=In order to better display and analyze data, we need to understand the format and meaning of tabular data in VTable. Next we will discuss the data forms of two table types in VTable: the basic table (ListTable) data source, and the pivottable (PivotTable) data source.!!!###!!!
Data sources and formats
In order to better display and analyze data, we need to understand the format and meaning of tabular data in VTable. Next we will discuss the data forms of two table types in VTable: the basic table (ListTable) data source, and the pivottable (PivotTable) data source.
Data format form
In VTable, the main data format we need to deal with is a JSON array. For example, the following is JSON data taking human information as an example:
At the same time: the data structure of two-dimensional array can also support setting.
Next we will describe how to apply this data to basic tables and pivot tables, respectively.
Basic tabular data
JSON data
In a basic table, data is presented in units of behavior, and each row contains multiple fields (columns). For example: name, age, gender, and address. Each object in the data item will correspond to a row.
Creating a basic table based on the above JSON data should configure the corresponding ListTableConstructorOptions Assign, and will records Configure as a data source.
Example:
Two-dimensional array structure
If you use a two-dimensional array as the data source, you can run it as follows:
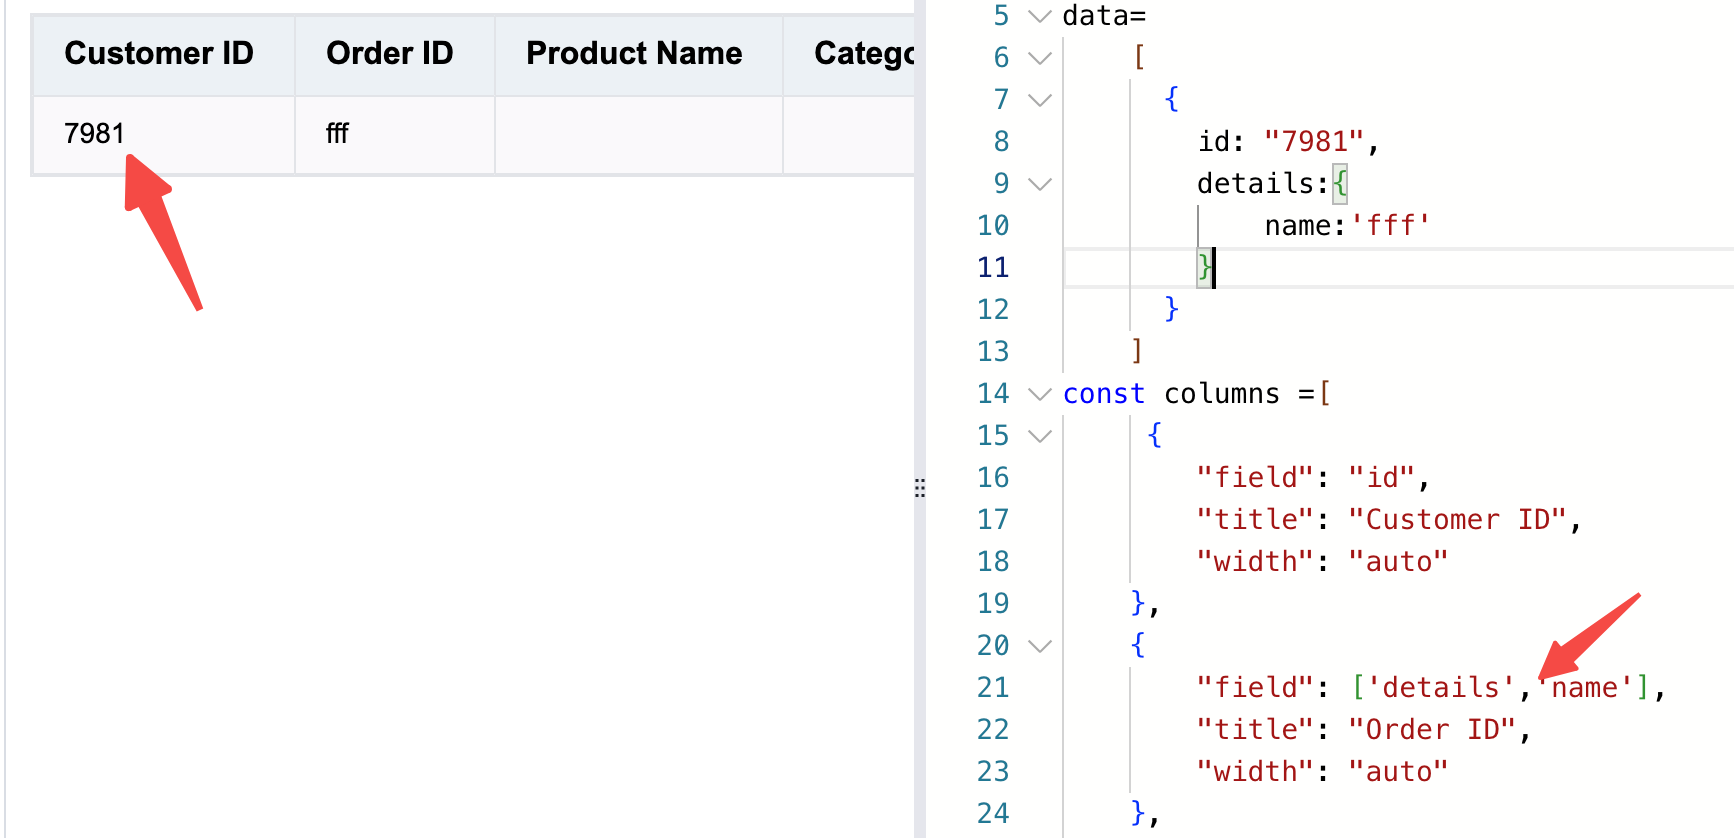
Special usage of multi-level data
A data source with a multi-level data structure can be implemented by setting records to [{}].
like:
The main purpose of pivot tables is to display and analyze data in multiple Dimensions. When configuring pivot tables, we need to specify grouping (row and column) Dimensions and Metirc Dimensions. For example, we can group data by gender and calculate the number of people and average age for each.
Its configuration item is PivotTableConstructorOptionsSimilar to the basic table, we first use JSON data as the data source for the pivot tableNote: This data is the result dataset after aggregated analysis
Or you can modify a certain data field using the changeCellValue or changeCellValues interface.
If you need data operations such as addRecord/addRecords/deleteRecords/updateRecords to also synchronize to the original records while the table is in filter/sort state, you can enable syncRecordOperationsToSourceRecords in the table options. This is useful when you expect newly added rows to still exist after clearing the filter, and when you want draft rows to stay visible in the current filter view until the next updateFilterRules is applied.
Tree structure data update
In the tree (group) structure, the data update is passed in recordIndex as an array, representing the index of the data in the table body. In addition, in the case of sorting, recordIndex is the original data structure, and it may not be consistent with the hierarchical order displayed in the table. Therefore, in the tree (group) structure table, please use the getRecordIndexByCell interface to get the correct recordIndex, and then use the updateRecords interface to update the data.
In this tutorial, we learned how to use tabular data in VTable. We first learned what data means in tables, and the data formats of two tables in VTable (basic table and pivot table). In order to help you better understand the correspondence between data formats and tables, we discussed the correspondence between basic tables and pivot tables respectively.