
Pivot Table Introduction
Pivot table, also known as multidimensional analysis table, cross table, Pivot table, refers to a table that can put one or more Dimensions in row Dimensions and column Dimensions to display the relationship between Dimensions. Users can analyze various scenarios at a glance Metirc and comparison, designed to help business analysis drive decision-making.
Applicable scenarios for pivot tables
Pivot tables are suitable for various data analytics scenarios, providing users with powerful data exploration and analysis capabilities. The following are common applicable scenarios for pivot tables:
-
Data aggregation and overview: Pivot tables can be used to summarize and overview large amounts of data. Through the aggregation function of pivot tables, users can quickly calculate statistical Metirc such as total, average, and total of data in order to obtain the overall situation of the data.
-
MultiDimension Analysis: Pivot tables excel in multi-Dimension data analytics. Users can explore the relationship and trend of data under different Dimensions by selecting different fields as rows, columns and values in the pivot table to gain insight into the details of the data.
-
Data Comparison and Trend Analysis: Pivot tables enable users to quickly compare differences and trends between different data. By placing data in rows and columns of the pivot table, users can easily compare data under different categories, time periods or other Dimensions, and visualize graphs to present trends in data changes.
-
Outliers and Outlier Analysis: Pivot tables are also very useful for finding anomalies and outliers. Through the filtering and filtering function of pivot tables, users can filter data according to specific conditions and quickly identify outliers or abnormal patterns, so as to deeply analyze anomalies in the data.
-
Business Decision Support: Pivot tables provide strong support for business decision-making. Through flexible operation and customized analysis of data, users can deeply understand business data from different perspectives and Dimensions, grasp key business Metirc and trends, and provide accurate data support for decision-making.
In conclusion, pivot tables have a wide range of application value in various data analytics scenarios. Whether it is data summarization and overview, multi-Dimension analysis, data comparison and trend analysis, outlier analysis or support for business decision-making, pivot tables can help users dig deep into data insights and provide powerful data analytics tools.
Advantages of VTable Pivot Tables
VTable pivot tables have the following advantages in data analytics:
-
MultiDimension Analysis: Pivot tables support multi-Dimension analysis, enabling users to compare and analyze data from multiple Dimensions simultaneously in one table.
-
High performance rendering: When displaying massive amounts of data, the pivot table can still respond quickly to user actions and avoid browser cards and crashes.
-
visual form: Pivot tables provide visual data display methods, such as histograms, line charts, etc., so that users can understand and compare data more intuitively.
-
Tree-like visual data display: By presenting Dimension and Metirc in a tree structure, users can more intuitively grasp the hierarchical and comparative relationships between data.
-
Flexible layout: Pivot tables are flexible and dynamic, and users can adjust the arrangement of rows, columns and values as needed.
-
Custom style: You can give or define different display styles respectively to dimension or indicator.
Pivot Table Basic Concepts

Dimensions
Dimension (Dimension): The perspective used to classify data and people observe business situations; for example: country, province, category, product name.
Dimension hierarchy
Dimension Level: According to the different levels of Dimension details, a class of attributes is divided into different levels predefined by Dimension. For example, the level of date Dimension includes year, month, and day; the regional level includes: country, region, province, and city.
Dimension members
Dimension member (Dimension Value): It is the value of the data items on each Dimension. For example, the Dimension members of the level month of the date Dimension are: January, February, March, etc., and the members of the region are: Northeast China, North China, and Middle China;
Metirc
Metirc (Indicator): Data used to describe business conditions, such as measures such as sales, costs, profits, etc.
row header tree
Row Tree: A table header that represents the hierarchical relationship of row Dimensions in a tree-like structure.
List header tree
Column Tree: A table header that represents the column Dimension hierarchy in a tree structure.
corner
Corner: The cell at the intersection of the row header and list header Region, used to display Metirc headers and other auxiliary information.
Concept mapping to configuration items
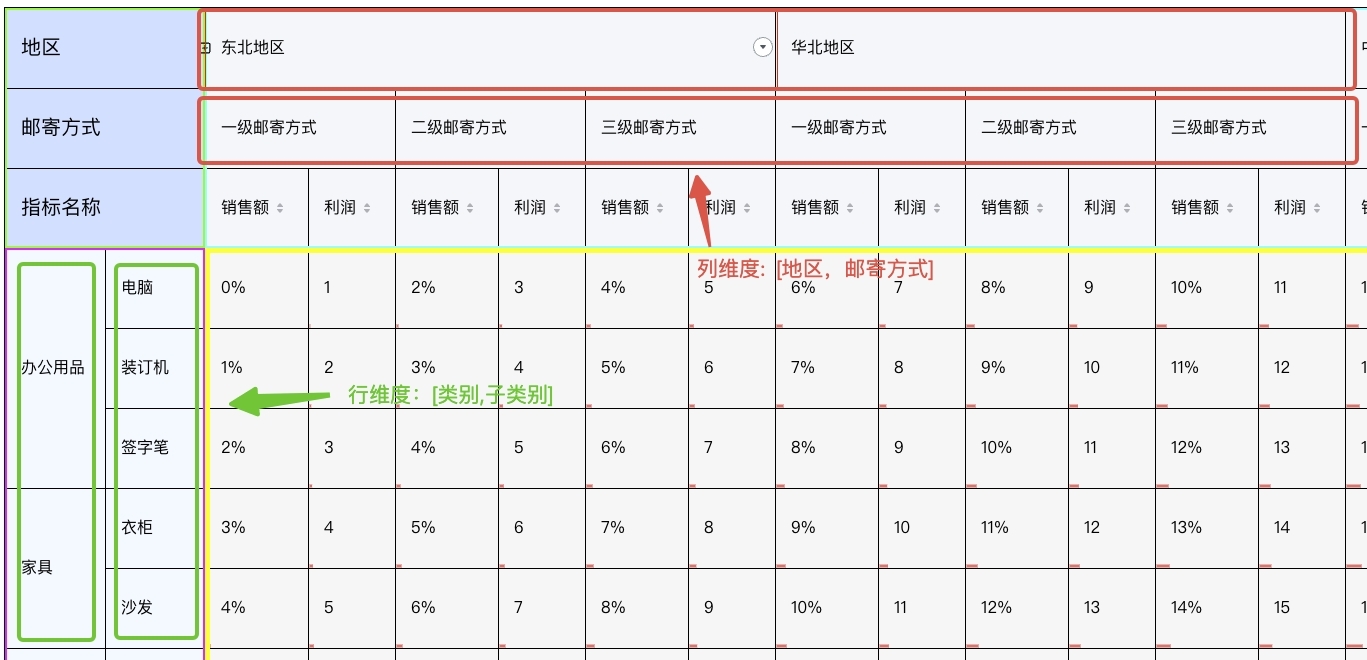
We will take the configuration of the pivot table in the following figure as an example. There are two rows and columns for Dimension and two for Metirc.
{
    rows: [
      {
        dimensionKey: '类别',
        title: '类别',
      },
      {
        dimensionKey: '子类别',
        title: '子类别',
      }
    ],
    columns:
    [
      {
        dimensionKey: '地区',
        title: '地区',
        headerFormat(value) {
          return `${value}地区`;
        },
      },
      {
        dimensionKey: '邮寄方式',
        title: '邮寄方式',
        headerFormat(value) {
          return `${value}邮寄方式`;
        },
      }
    ],
  indicators: [
      {
        indicatorKey: '1',
        title: '销售额',
      },
      {
        indicatorKey: '2',
        title: '利润',
      }
    ],
}
In the above configuration, rows and columns define the dimension basic information corresponding to the row header and column header, including title, headerStyle, format, etc.
indicators define the basic information of indicators, including title, style, format, etc.