
Table Concepts
Tables are one of the most commonly used components in the front-end, applied in countless back-end management or BI businesses to display large amounts of data. This allows users to access more information simultaneously and perform operations on the information. The common structure of a table is mainly divided into three elements: header, cell, and data. The header can be further subdivided into row header, column header, and corner header.
Concept of Common Elements in VTable
Most people's impression of tables is limited to rows and columns, but for VTable, many features are provided. Let's take a look at some common concepts about VTable.
- Dimensions and Metrics
The most frequently mentioned terms in charts are dimensions and metrics. In a table, apart from dimensions, everything else is a metric. Dimensions are text or date fields used to represent the dimensions in which the current metrics exist, while metrics are numerical values used to represent the most basic data. By inserting different dimensions, metrics can be broken down into multiple dimensions, making them more detailed.
- Primitives
Primitives represent the most basic units that make up a table. Basic primitives include: Text, Rect, Image, Line, Arc, Circle, Group;
-
Cell
-
As the most basic module of a table, cells are also extensively supported in
VTable. Currently, cells support 8 types. The following image shows several common cell types, from left to right: hyperlink, text, image, video, data bar, icon, sparkline.

- Text
Ordinary text cells can support custom colors, icons, background colors, data formatting, etc. Various styles can be configured through functions, and with conditional judgments, it can support the common conditional formatting in BI products, forming clearer charts.
- Hyperlink
When you need to display the corresponding website in a table and want to enable navigation, you can set the cell type to hyperlink to meet the requirement by configuring cellType="link" to adjust the cell to a hyperlink.
- Data strip
Data bar types are particularly useful in certain situations. With the capability of data progress bars, you can intuitively see the progress in different situations, such as check-in rates, performance indicators, etc., or compare the different progress of the same indicator under different dimensions. Set cellType to progressbar to enable data bars.
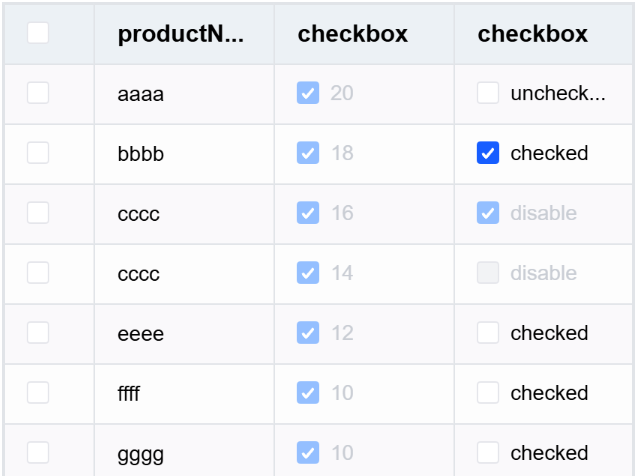
- Checkbox
When users want to edit multiple pieces of data, the checkbox type is very useful. The checkbox type supports users in performing flexible operations by selecting the cells they want to operate on. Set cellType to checkbox to adjust to a checkbox.
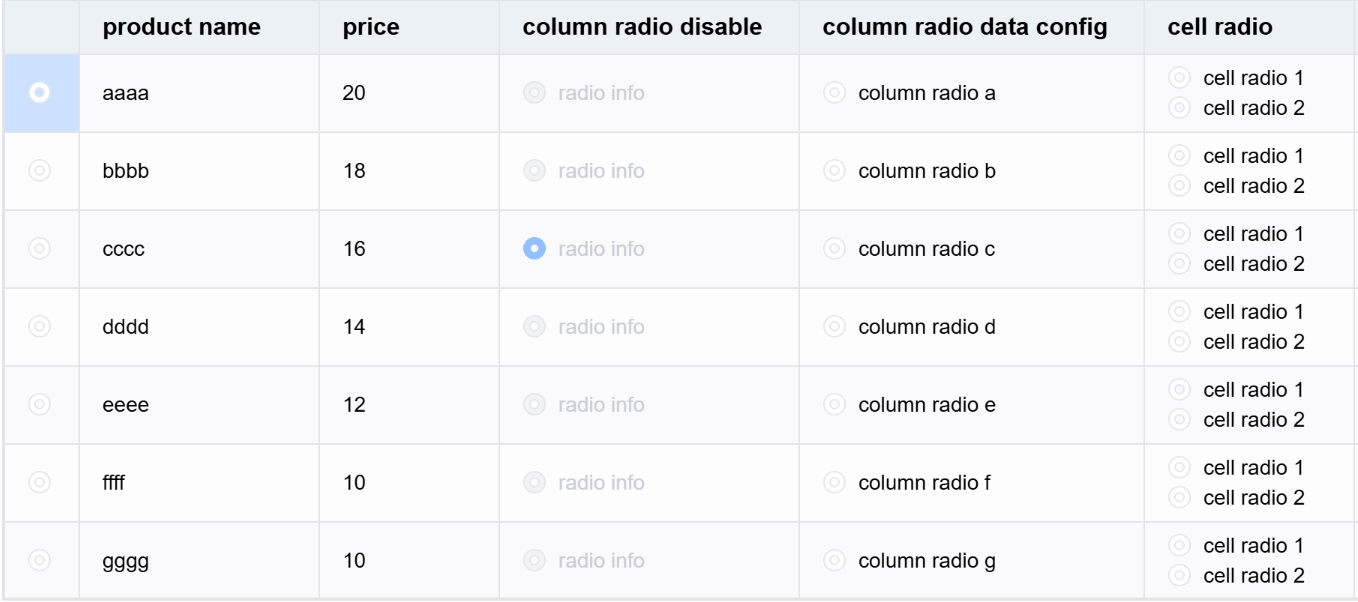
- Radio button
Radio buttons are mainly used in scenarios such as data decision-making and permission allocation. They are used to select one among multiple options.
- Sparklines
Sparklines, as a type of small chart, are used to display trend changes over different time periods under different conditions within a cell. By embedding sparklines in a table, data analysis can be improved. Currently, VTable only supports line charts, but other chart types will be supported in the future.
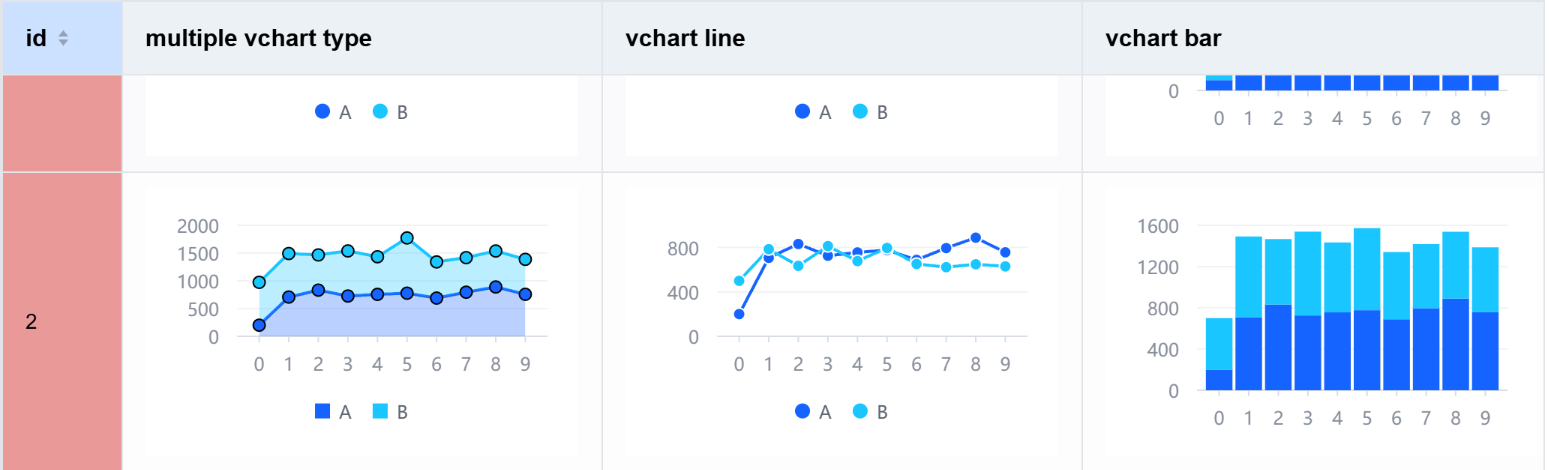
- Chart
VTable cells support chart types. You only need to register the chart components in advance and configure the spec in the cells according to the specified format to display different chart types.
- Theme and Style
VTable provides theme functionality and custom styles. By customizing themes and styles, you can adjust table borders, corners, font sizes, and other styles to achieve more personalized tables.
-
Interaction
-
Drag to adjust column width
When the data in a cell is long and exceeds the initial width of the cell, it affects the viewing of the data. VTable provides the function of dragging the border to adjust the column width, allowing users to adjust the table to a suitable width. Compared to other table components, VTable offers an excellent interactive experience in terms of dragging column widths. During dragging, the width of the column changes in real-time with the position of the mouse, greatly enhancing the user experience.
- Scroll
Thanks to the underlying canvas-based rendering and internal performance optimization, the VTable component is very smooth when scrolling. At the same time, VTable also provides rich configurations for users, allowing them to customize the style of the scrollbar easily.
- Other interactions
VTable also supports custom hover and select styles to highlight rows or columns that need attention.
- Event
VTable internally supports dozens of different event callbacks, including different lifecycle and interaction events. You can register events by calling the on method on the instance. However, it is important to note that when registering multiple times, you need to unload the previously registered events first to avoid duplicate callbacks.
By registering different callback events, more diverse needs can be met.
Basic Functions
Among the many basic features of VTable, the most outstanding compared to other component libraries on the market are freezing, cell merging, and multi-level headers.
- Freeze
In the VTable, you can not only freeze columns but also freeze bottom rows, and it supports custom shadow styles for freezing. This is very suitable for displaying bottom summary columns, right-side action buttons, and other needs.
- Cell merging and multi-level headers
When there are too many headers, users cannot clearly distinguish the meanings represented by different columns. At this time, there is a need to classify columns under different categories. VTable provides the functionality to implement multi-level headers through the children configuration. By grouping headers for different columns, it can significantly enhance the user experience.
Meanwhile, VTable also supports merging the same cells, and this merging is not limited to the same column.
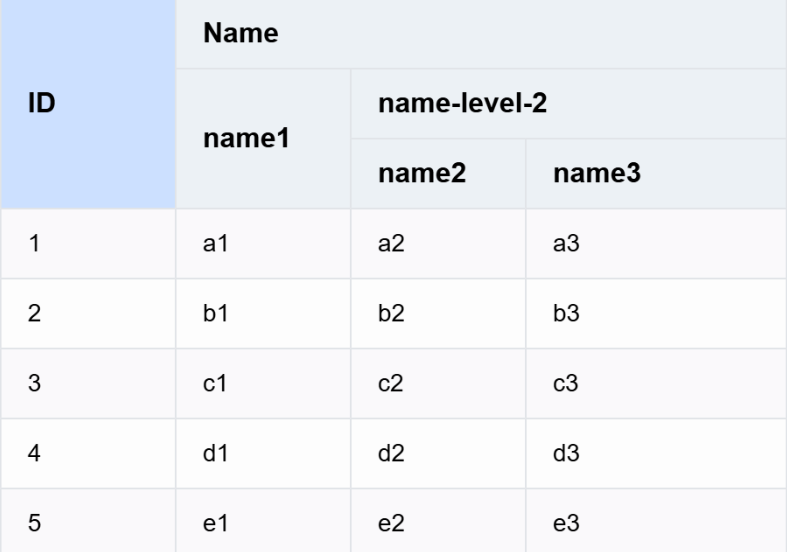
Table Classification
Common tables in VTable are divided into basic tables and pivot tables, and different tables also support different transformation forms.
-
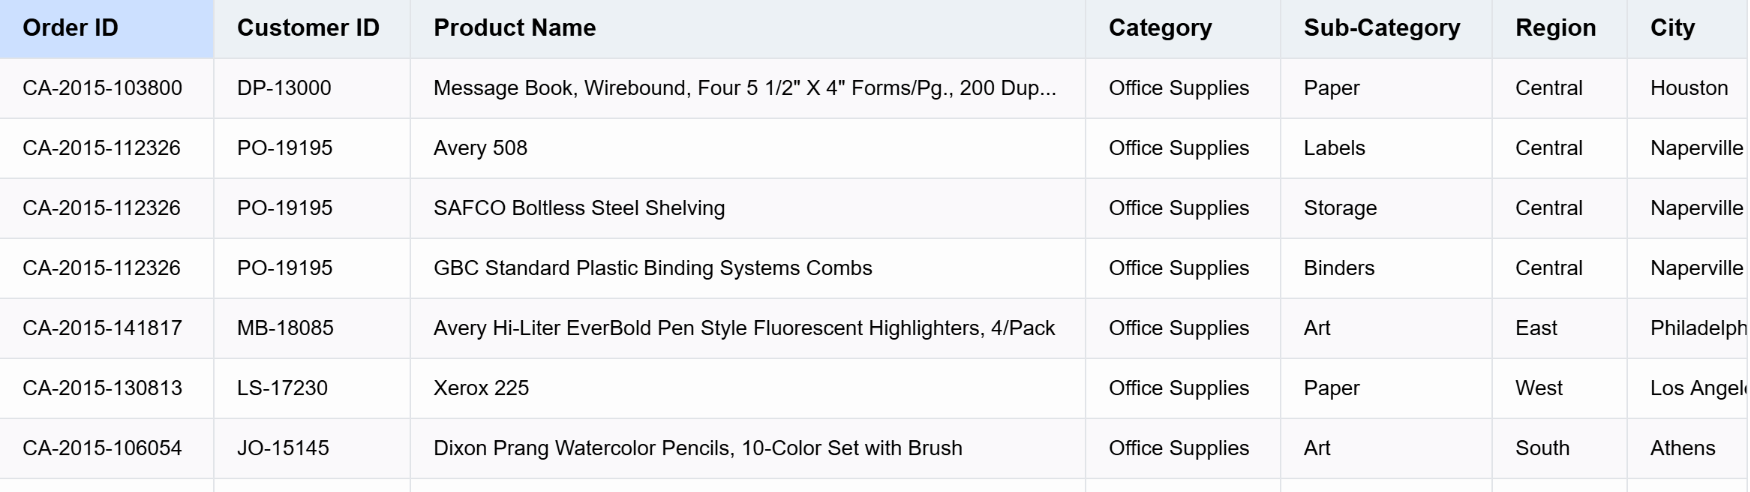
Basic Table
-
Basic tables consist of rows and columns, used to display data to users in a tiled format, maximizing the presentation of merchant information, sales figures, and other details.
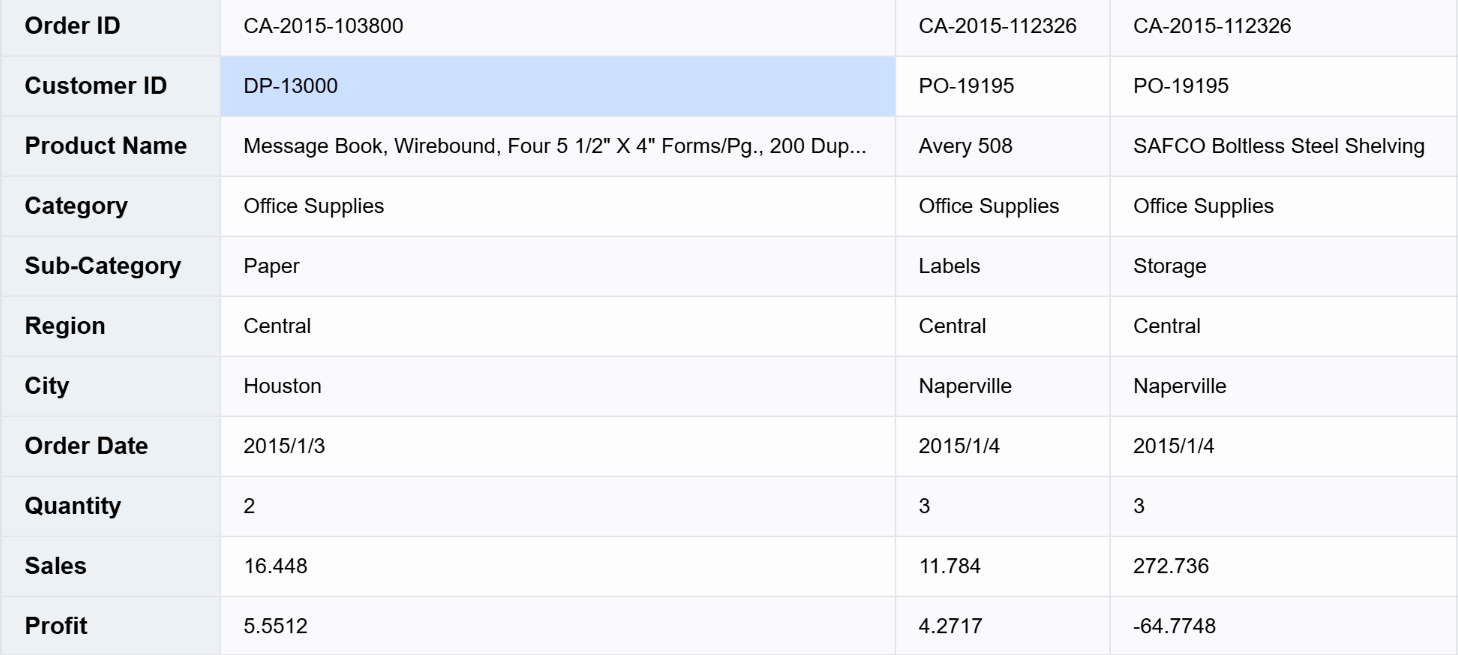
- Transpose table: Transposing a table involves swapping its rows and columns, which can meet the special needs of different users. Use transpose in ListTable to enable it.
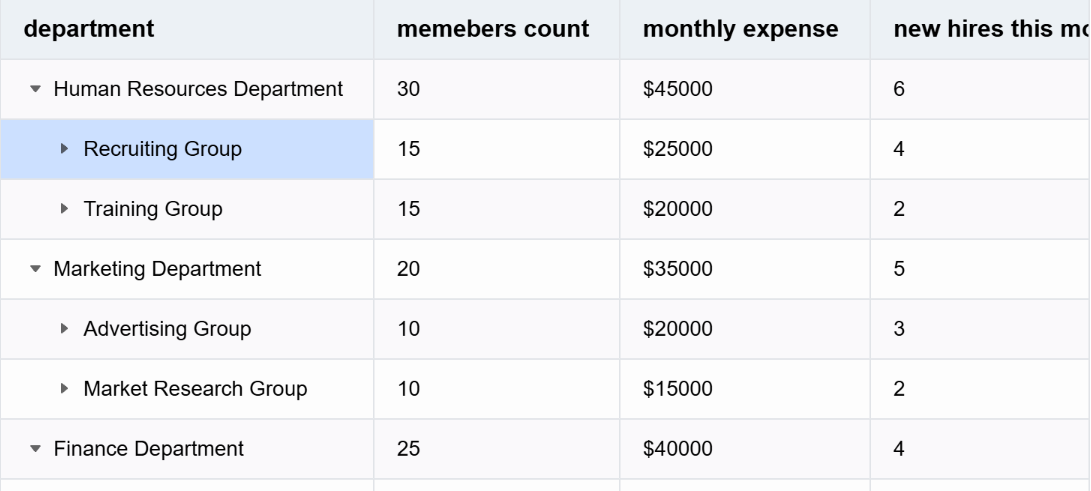
- Tree Table: By passing tree-structured data into records, the table can be directly converted into a tree structure. Tree tables are used to display a large amount of data that can be categorized simultaneously, grouping rows with the same attributes into one category, allowing users to more intuitively locate the data they need.
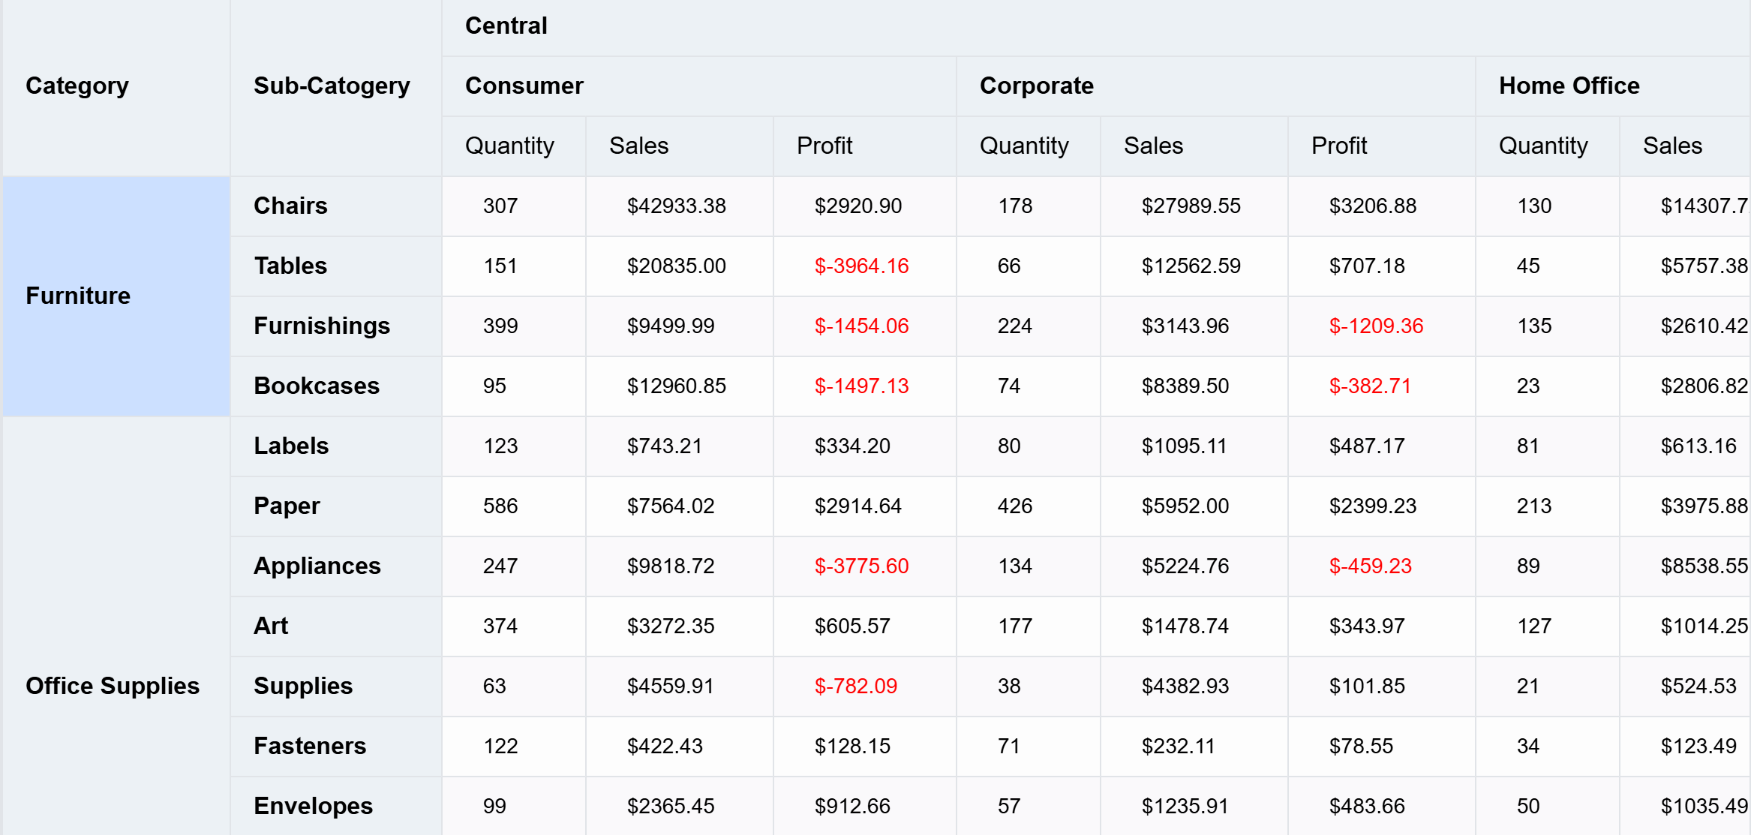
- Pivot Table
For a BI product, the most essential feature is the pivot table. Compared to ListTable, PivotTable is more like three-dimensional because pivot tables support rows, columns, and metrics simultaneously. Suppose there is a requirement to locate the sales amount of a certain category at a specific point in time, then a pivot table can be used.
Flexible use of pivot tables can greatly facilitate the business analysis process, help users gain deeper data insights, and make reasonable business decisions.
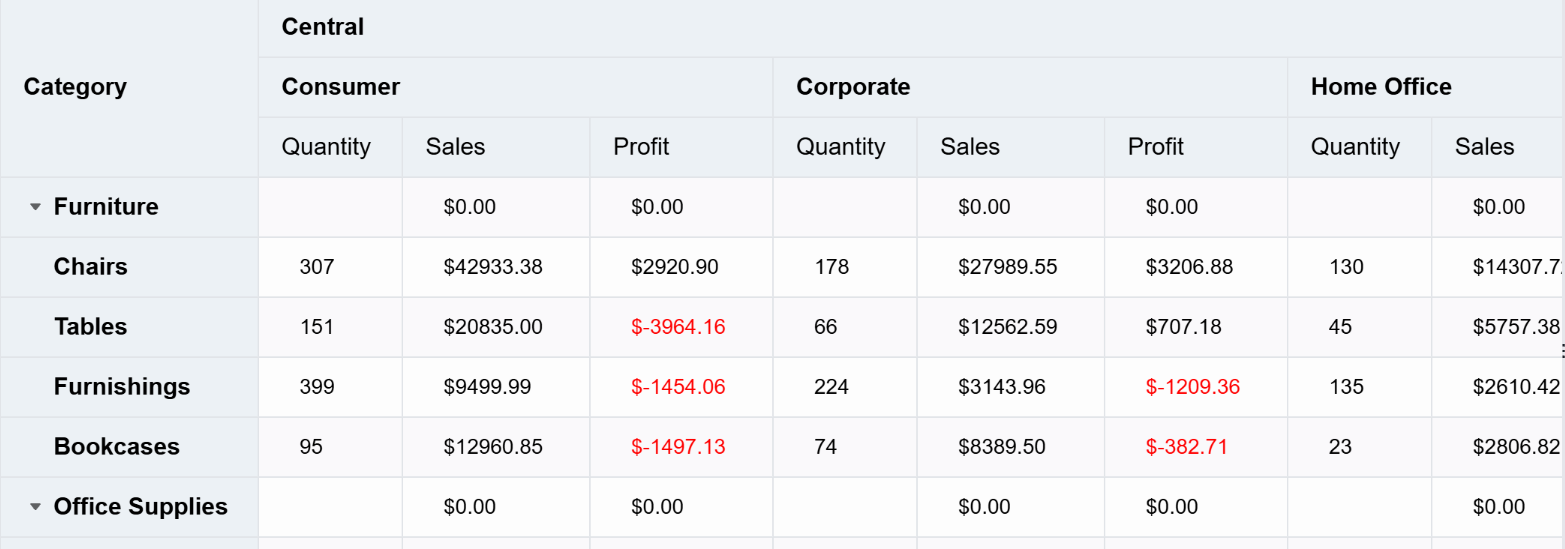
- Tree Table
By default, the display of the pivot table is flat, but in the case of a large number of rows, it may not be intuitive to locate the required data and the relationships at different levels. Reasonable use of the tree structure of the pivot table will be more helpful for data analysis. You can enable tree display by using rowHierarchyType: 'tree' in PivotTable.
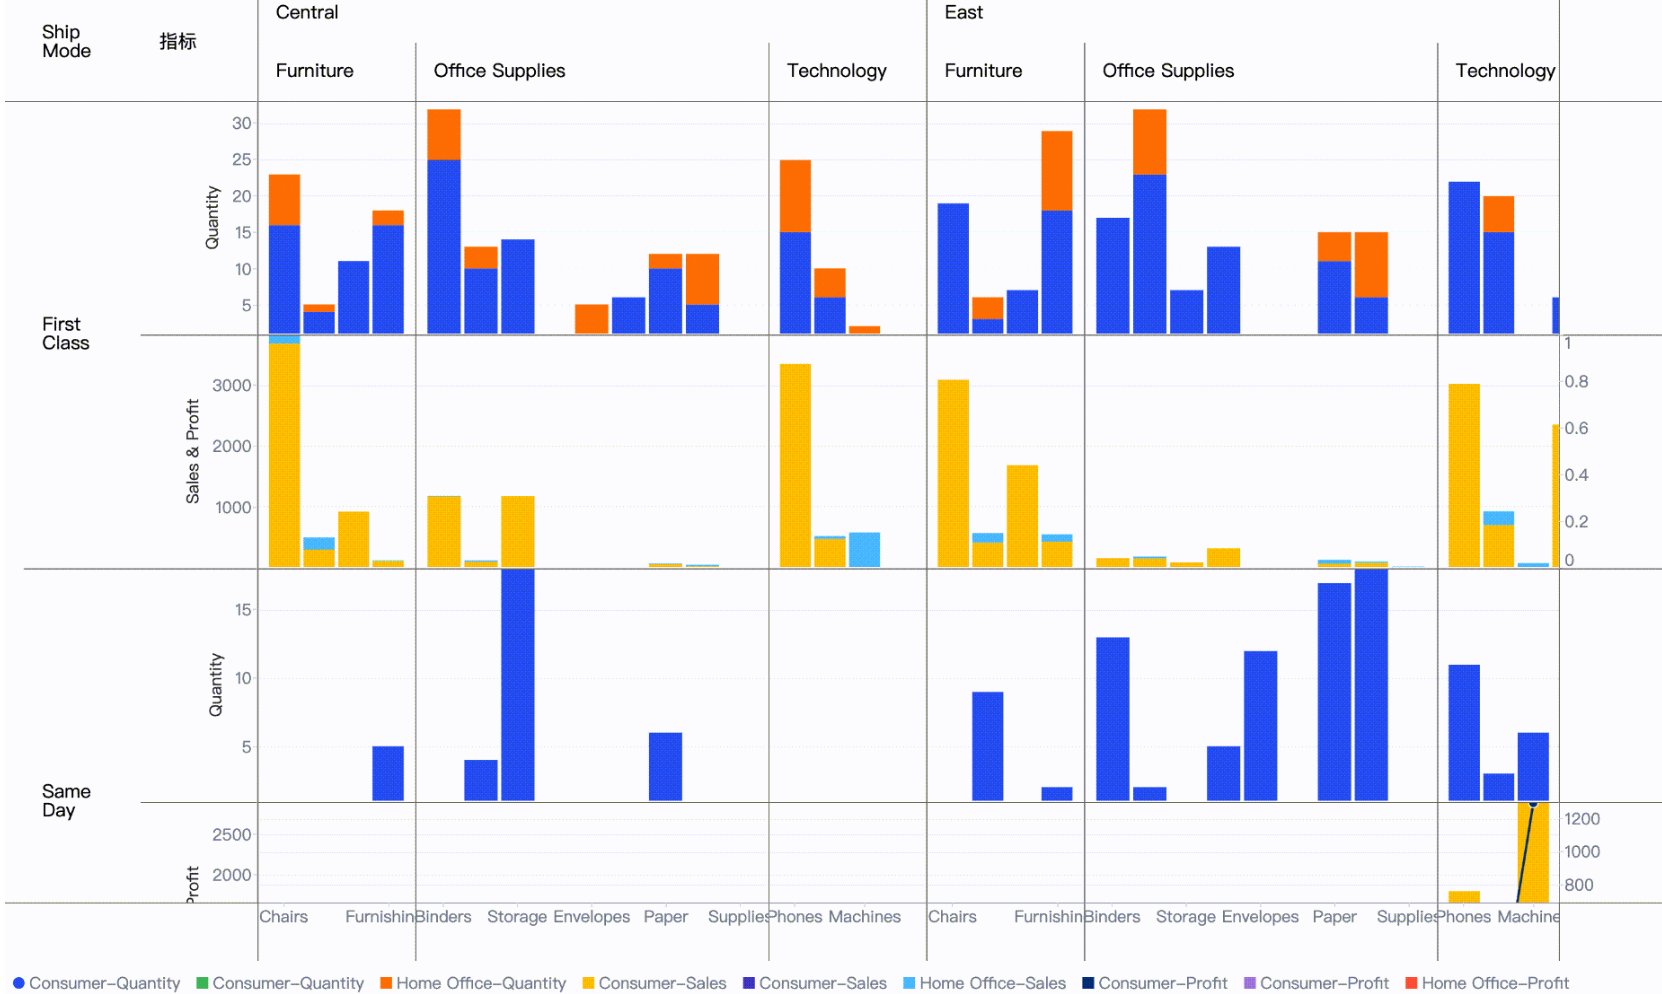
- Perspective Combination Chart
A perspective combination chart is equivalent to a chart that combines different types of charts into a large chart, with each cell presenting data from different dimensions. The advantage of a perspective combination chart is that it can split a single chart with a large amount of mixed data into different dimensions, allowing for better data decision-making and comparison of differences under different dimensions.
Performance Optimization
The aforementioned types of tables perform exceptionally well in VTable. VTable has undergone numerous performance optimizations internally, enabling it to display millions of data entries simultaneously.
Summary
This article starts from the overall table concept of VTable and gradually introduces the basic modules of VTable. As a high-performance and flexible canvas table component library, by configuring VTable reasonably, it can display diverse and personalized tables.
This document is provided by the following personnel
taiiiyang(https://github.com/taiiiyang)