!!!###!!!title=7.1 PivotTable Concepts and Capability Definition——VisActor/VTable Contributing Documents!!!###!!!!!!###!!!description=---title: 7.1 PivotTable Concepts and Capability Definition key words: VisActor,VChart,VTable,VStrory,VMind,VGrammar,VRender,Visualization,Chart,Data,Table,Graph,Gis,LLM--- 鉴于本节其实跟代码没什么关系,并且 和 [官方文档](https://www.visactor.io/vtable/guide/table_type/Pivot_table/pivot_table_overview) 已经写的很清楚了,这里写一些自己的理解 !!!###!!!

鉴于本节其实跟代码没什么关系,并且 和 官方文档 已经写的很清楚了,这里写一些自己的理解

PivotTable Basic Concepts

Multidimensional analysis tables, also known as pivot tables or cross tables, refer to tables where one or more dimensions can be placed in **row dimensions** and **column dimensions**, displaying the **interrelationships between dimensions**. Users can easily analyze various scenario indicators and comparisons at a glance, aiming to assist business analysis in driving decision-making.

This might sound a bit abstract, and some readers may wonder: what does a table with multiple row dimensions + multiple column dimensions look like? Here's an example 🌰:

A marketing colleague every day needs to track the price of a certain robotic vacuum cleaner in various online stores. Let's analyze the scenario he faces: \r

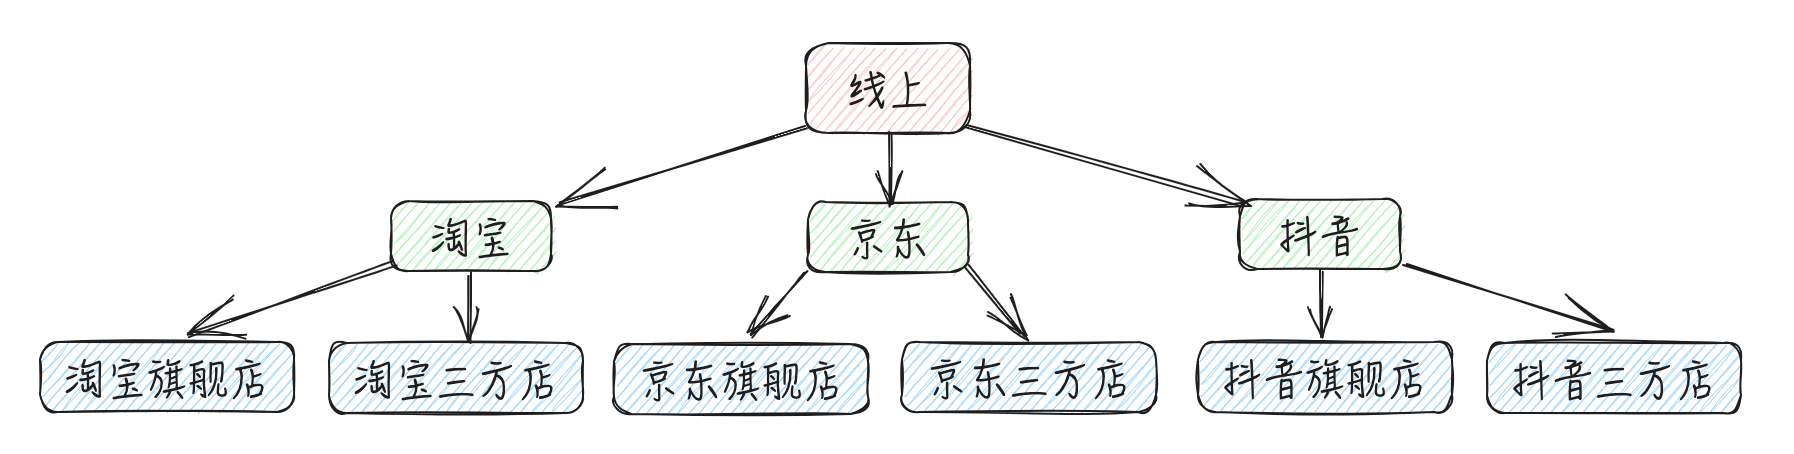
  • "Each online store", we can summarize as the channel dimension (Dimension). According to his daily work, there is the following channel tree:
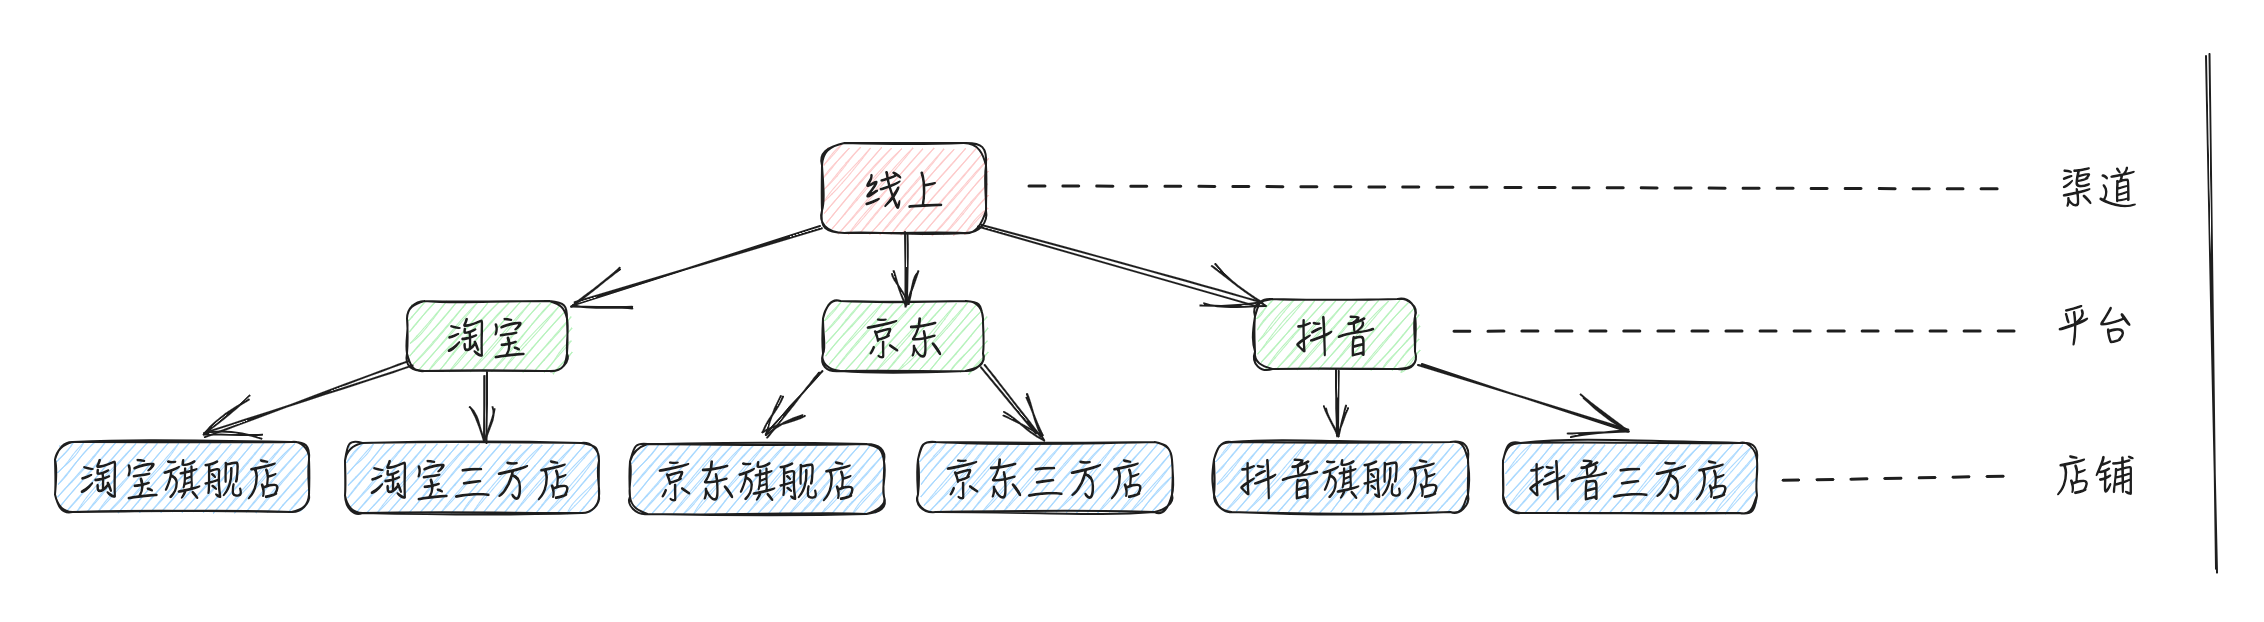
  • According to the different levels of the channel dimension, it is divided into: Channel | Platform | Store three Dimension Levels. Taking the "Platform" dimension level as an example, there are three values: Taobao, JD, Douyin, which we call Dimension Members (Dimension Value)

With TypeScript we can easily write type definitions for channels, as well as channel trees:

enum IChannel {
  Channel = 'channel',     // 渠道
  Platform = 'platfrom',   // 平台
  Shop = 'shop'            // 店铺
}

const channelTree = [
  {
    nodeType: IChannel.Channel,
    value: '线上',
    children: [
      {
        nodeType: IChannel.Platform,
        value: '淘宝',
        children: [
          {
            nodeType: IChannel.Shop,
            value: '淘宝旗舰店'
          },
          {
            nodeType: IChannel.Shop,
            value: '淘宝三方店'
          }
        ]
      },
      {
        nodeType: IChannel.Platform,
        value: '京东',
        children: [
          {
            nodeType: IChannel.Shop,
            value: '京东旗舰店'
          },
          {
            nodeType: IChannel.Shop,
            value: '京东三方店'
          }
        ]
      },
      {
        nodeType: IChannel.Platform,
        value: '抖音',
        children: [
          {
            nodeType: IChannel.Shop,
            value: '抖音旗舰店'
          },
          {
            nodeType: IChannel.Shop,
            value: '抖音三方店'
          }
        ]
      }
    ]
  }
];    

  • Since these data are collected "daily", over time, there is also the time dimension and time tree:
enum ITime {
    Month = 'month',
    Week = 'week',
    Day = 'day'
}

const timeTree = [
  {
    nodeType: ITime.Month,
    value: '3',
    children: [
      {
        nodeType: ITime.Week,
        value: '1',
        children: [
          {
            nodeType: ITime.Day,
            value: '2025-03-03'
          },
          {
            nodeType: ITime.Day,
            value: '2025-03-04'
          },
          {
            nodeType: ITime.Day,
            value: '2025-03-05'
          },
          ...
        ]
      },
      {
        nodeType: ITime.Week,
        value: '2',
        children: [
          {
            nodeType: ITime.Day,
            value: '2025-03-10'
          },
          {
            nodeType: ITime.Day,
            value: '2025-03-11'
          },
          {
            nodeType: ITime.Day,
            value: '2025-03-12'
          },
          ...
        ]
      },
      {
        nodeType: ITime.Week,
        value: '3',
        children: [
          {
            nodeType: ITime.Day,
            value: '2025-03-17'
          },
          {
            nodeType: ITime.Day,
            value: '2025-03-18'
          },
          {
            nodeType: ITime.Day,
            value: '2025-03-19'
          },
          ...
        ]
      }
    ]
  }
];    

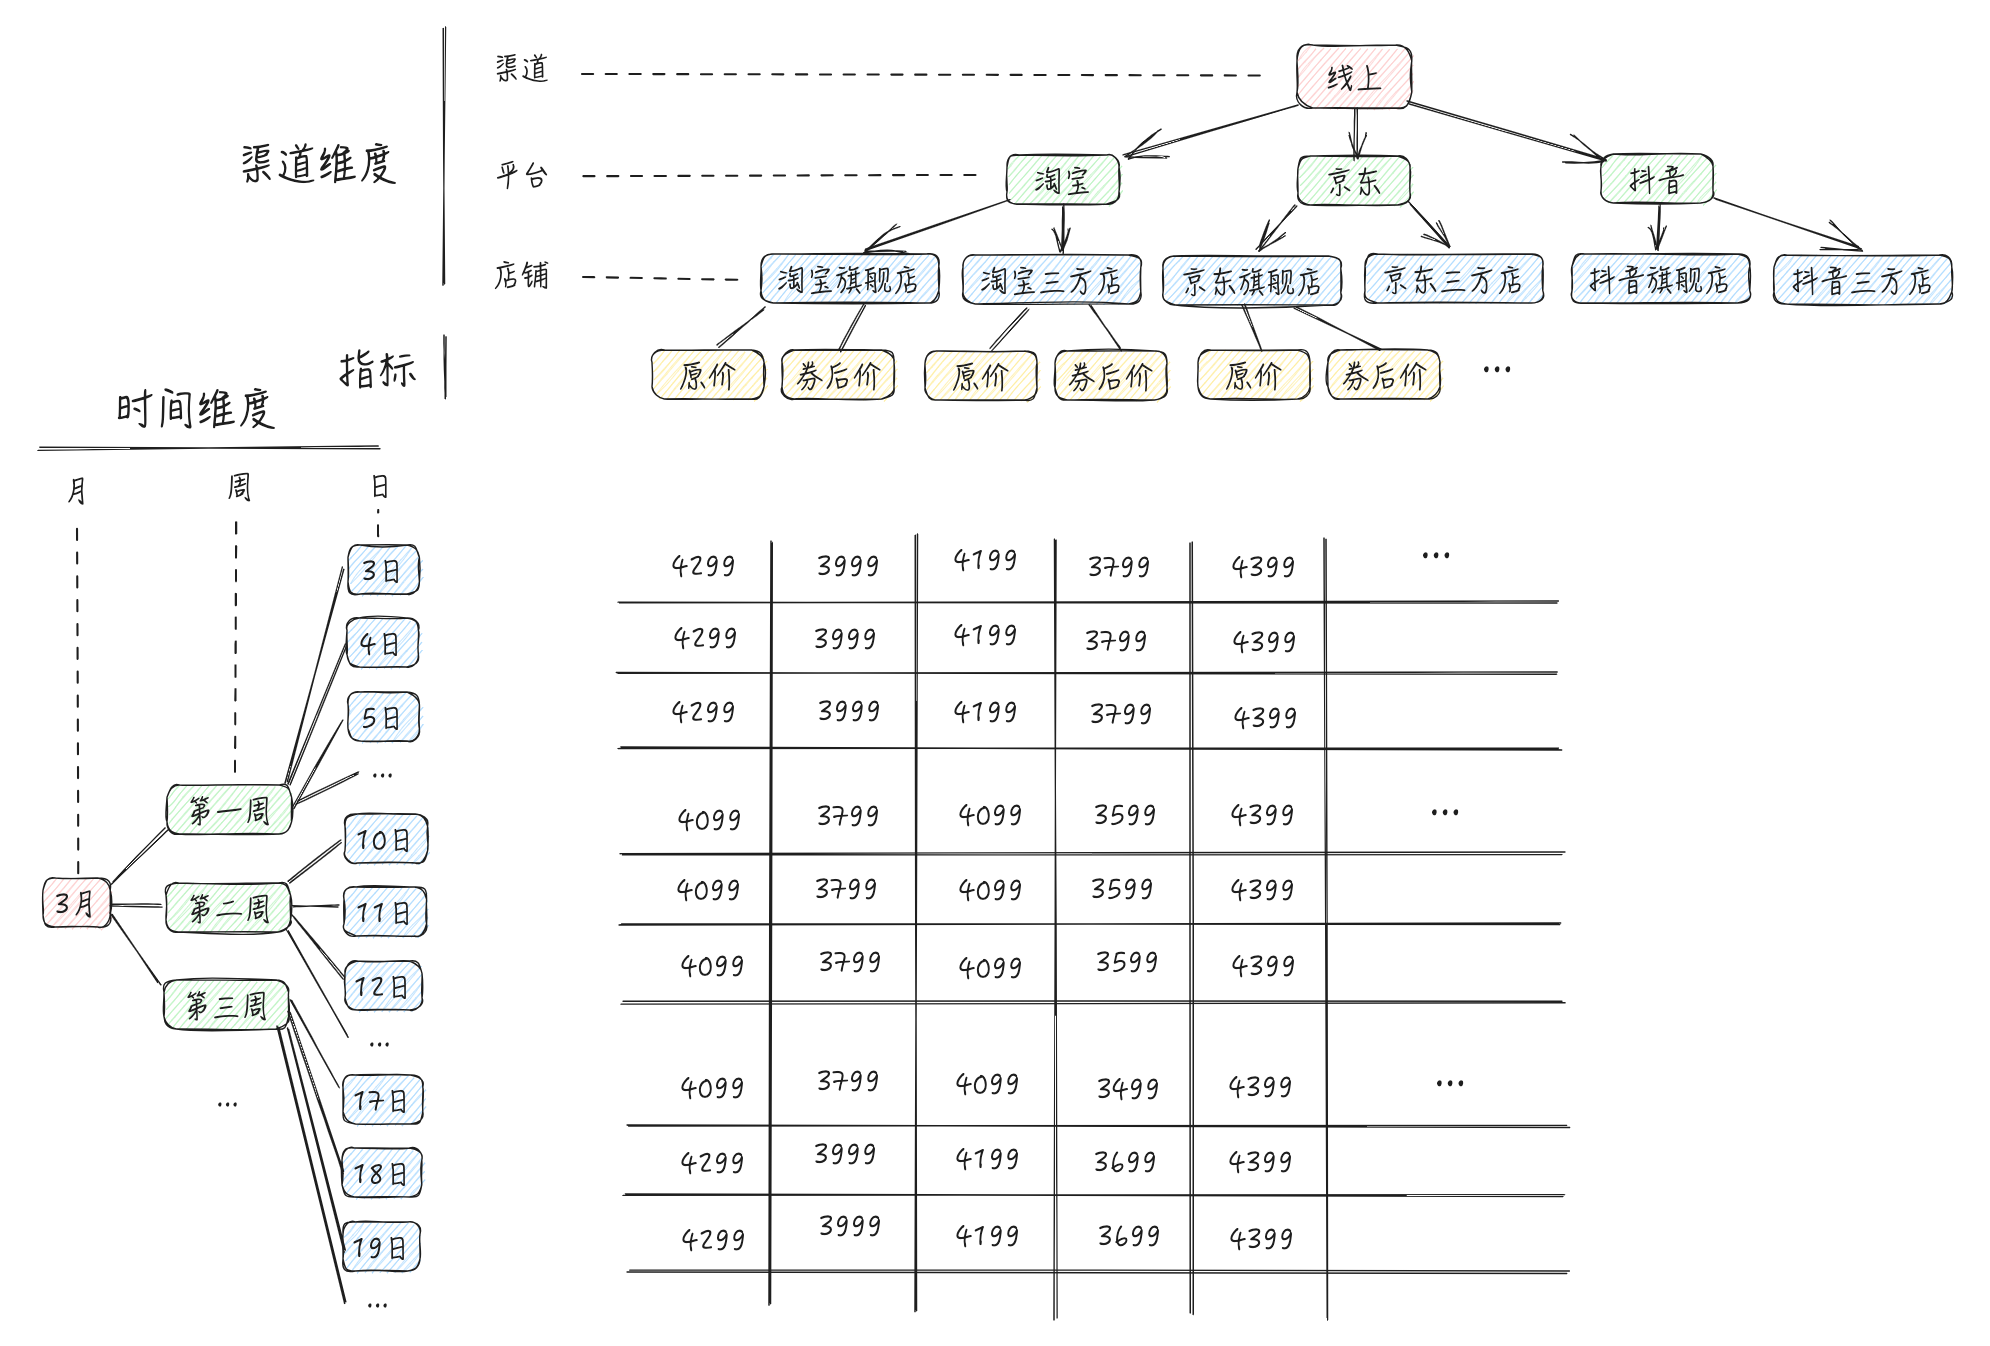
  • What specific data is this marketing colleague analyzing - Price. It may be divided into original price, post-coupon price, etc. These specific data are referred to as Indicators. Combining the aforementioned channel tree and price tree, we can obtain such a multidimensional table. \r

Data Concepts

Congratulations on reaching this point, you have already mastered the concept of multidimensional tables!

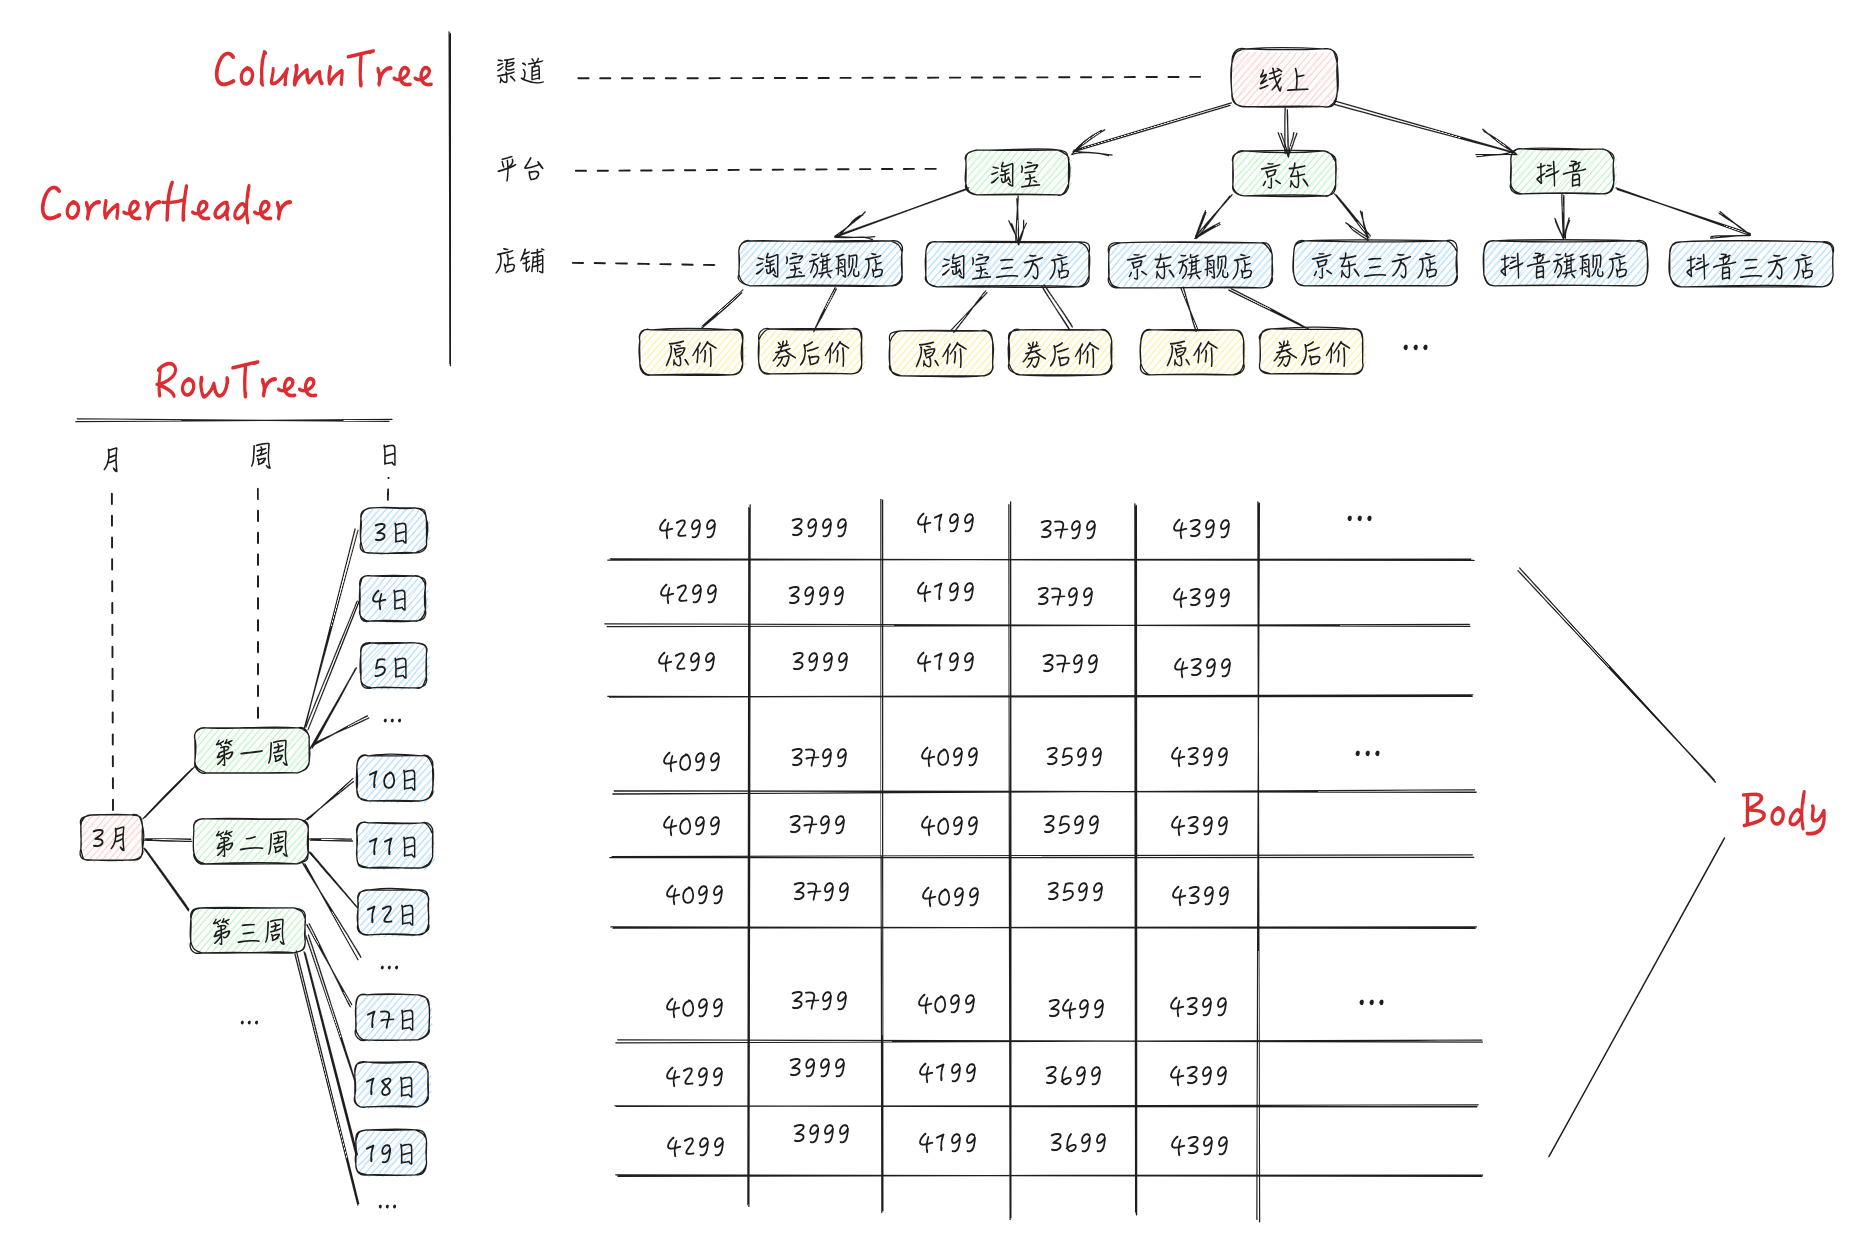
We further abstract the above multidimensional table and can conclude that displaying a multidimensional table requires the following data: \r

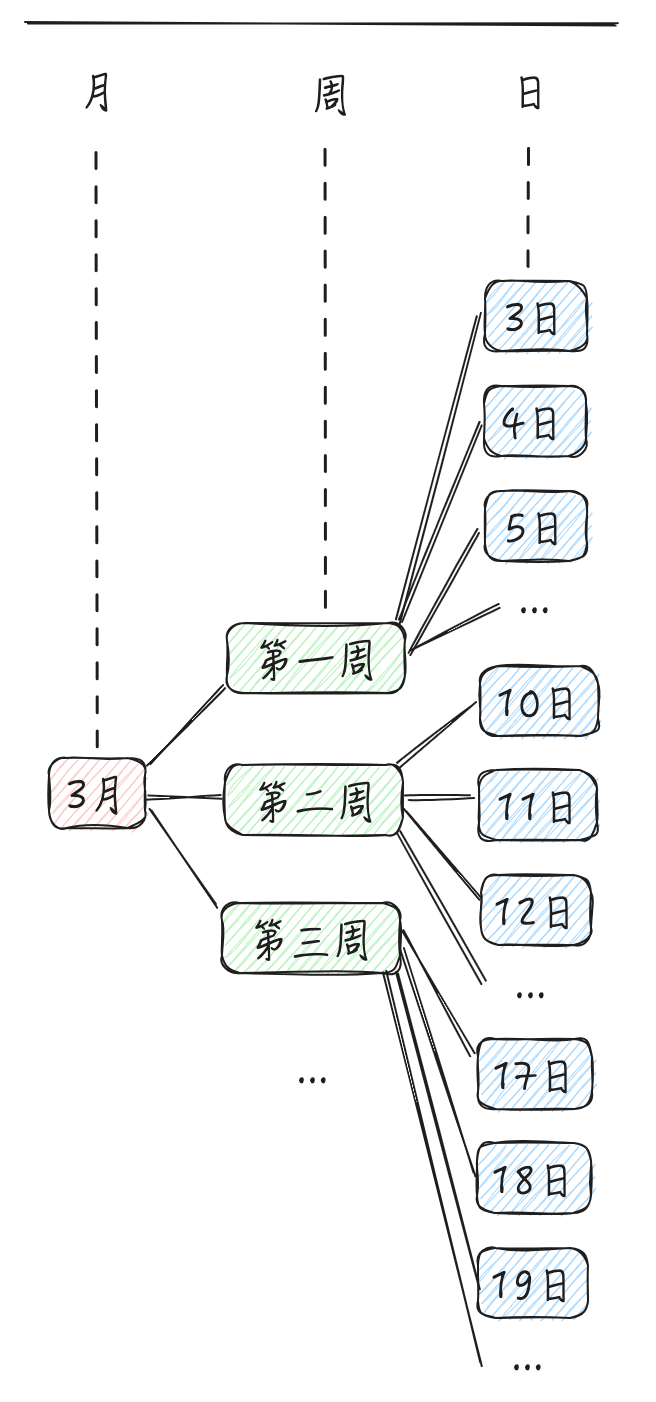
  • Row header tree (rowTree): A tree structure representing the hierarchical relationship of row dimensions in the header. That is, the timeTree in the example above.

  • Column Tree (columnTree): A tree structure representing the hierarchical relationship of column dimensions in the header. That is, the channelTree in the example above.

  • Generally speaking, for convenience of display, the indicator will be a leaf node of the columnTree \r

  • Corner Header (cornHeader): The cell located at the intersection of the row header and the list header, used to display metric titles and other auxiliary information \r

  • Specific data (records): That is, the specific data under various dimensions and various indicators will be displayed in the data cells (we call this area the body) \r

Objective

Implement a high-performance multidimensional analysis table with capabilities for data transformation, statistics, sorting, drilling, and visualization
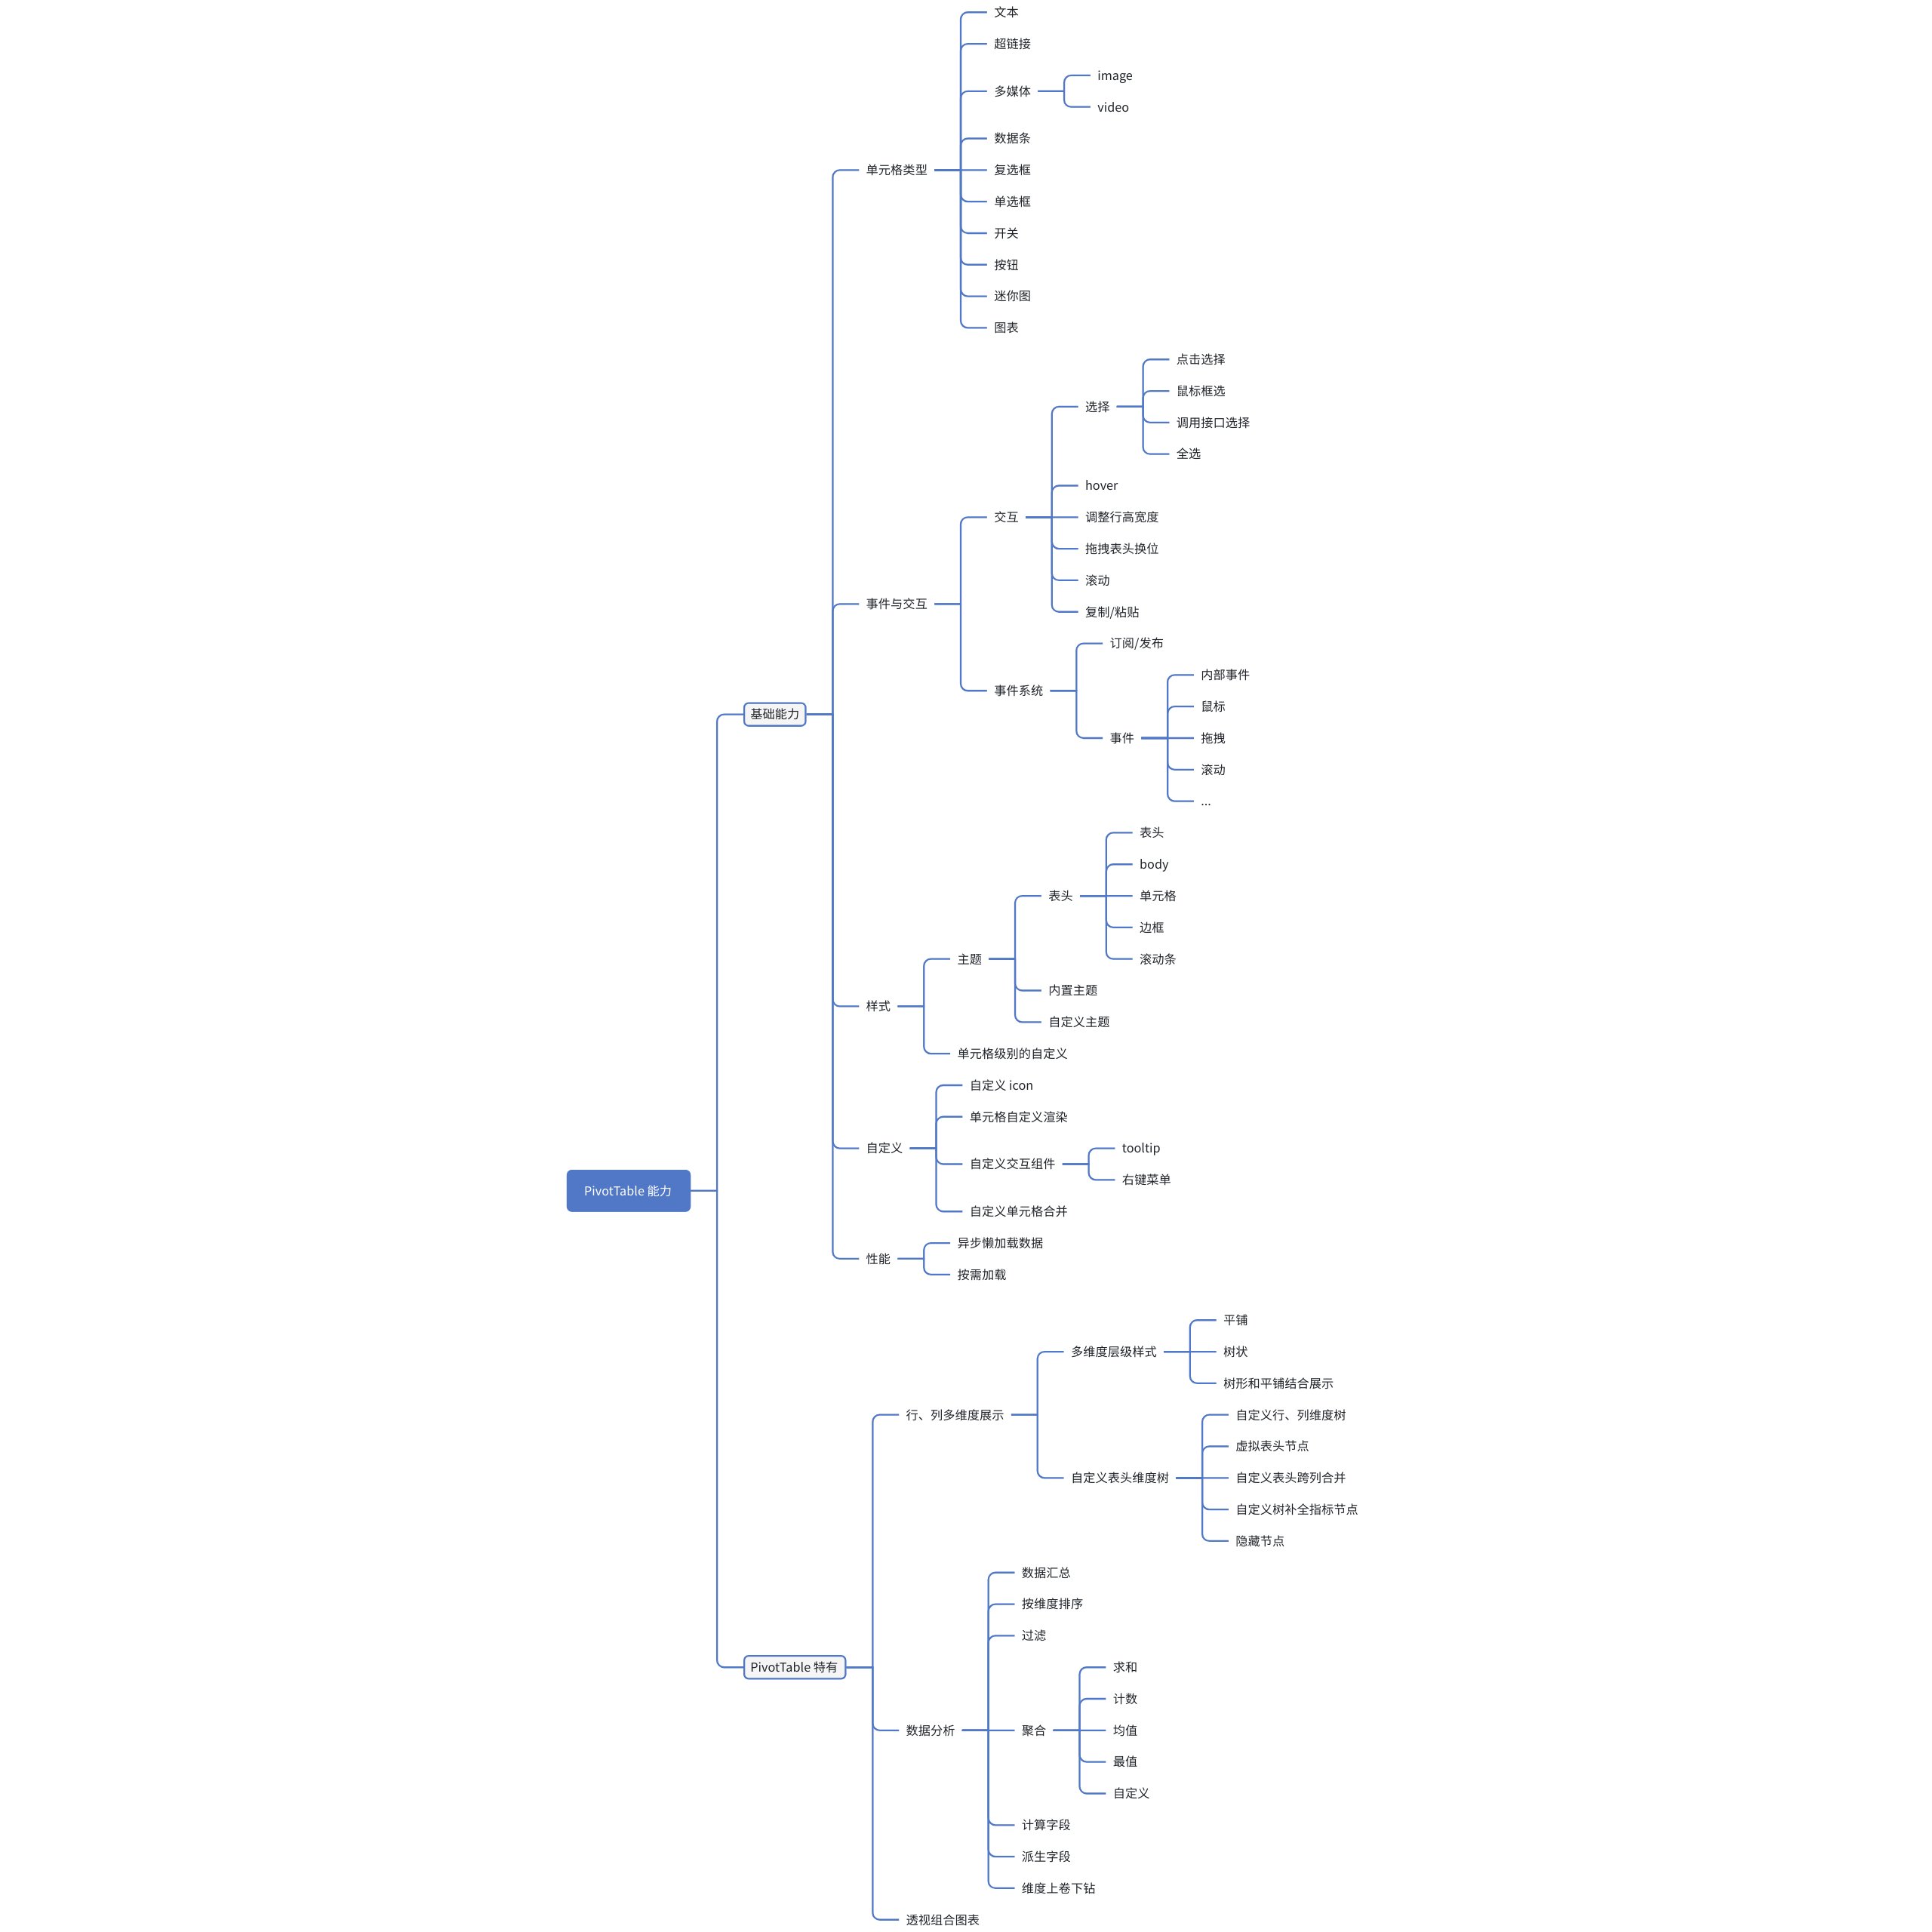
Capability

The specific capabilities are outlined as follows: basic capabilities (aligned with the functionality of ListTable), as well as features unique to PivotTable.

This document was revised and organized by the following personnel

玄魂