It is not only a fully functional graph visualization library, but also an explorer of data relationships.
!!!###!!!title=6.3 ListTable Code Structure and Detail Analysis——VisActor/VTable Contributing Documents!!!###!!!!!!###!!!description=---title: 6.3 ListTable Code Structure and Detail Analysis
key words: VisActor,VChart,VTable,VStrory,VMind,VGrammar,VRender,Visualization,Chart,Data,Table,Graph,Gis,LLM---
!!!###!!!
Introduction
Common table component libraries are usually implemented based on the DOM, and there are very few table component libraries rendered based on Canvas. However, @Visactor/VTable provides a table component library rendered based on Canvas. This article will start with the implementation of various functions and interactions to see how ListTable relies on the capabilities provided by Canvas to achieve operations similar to native DOM. \r
First, let's understand the general architecture. The basic architecture of ListTable can be divided into the following modules \r
Rendering engine: Scenegraph scene tree. The movement of the header, graphic rendering, and cell width and height calculation are all included in the scene tree; \r
Progressive generation: The SceneProxy module is a submodule under Scenegraph, which defines the generation of the scene tree initialization, maintains the maximum row and column values generated during the initialization of the scene tree, and is responsible for the logic of scrolling progressive rendering; \r
State Management: StateManager handles the table state. Hover and select in ListTable exist in the form of data. When the state changes, it triggers the Scenegraph to re-render the chart; \r
Layout Management: The core layout module of the LayoutMap table. It generates row list headers and maintains cell information through configuration; including the calculation of information for tree tables and multi-level headers, all within the Layout; \r
Layout calculation: Maintain row and column width and height data through colWidthsMap/rowHeightsMap; \r
Style system: Manage styles through theme/style related modules; \r
Data Management: Manage records through DataSource, including logic processing such as data addition, deletion, modification, query, sorting, and aggregation; \r
If you can understand the above modules, you will be able to understand the general workflow of ListTable.
Basic Table Layout Initialization
Basic tables differ from the complexity of pivot tables, consisting only of basic rows and columns. For basic table display, we only need to focus on how many rows and columns need to be displayed, the logic of row and column layout generation, and how these rows and columns are mapped through data.
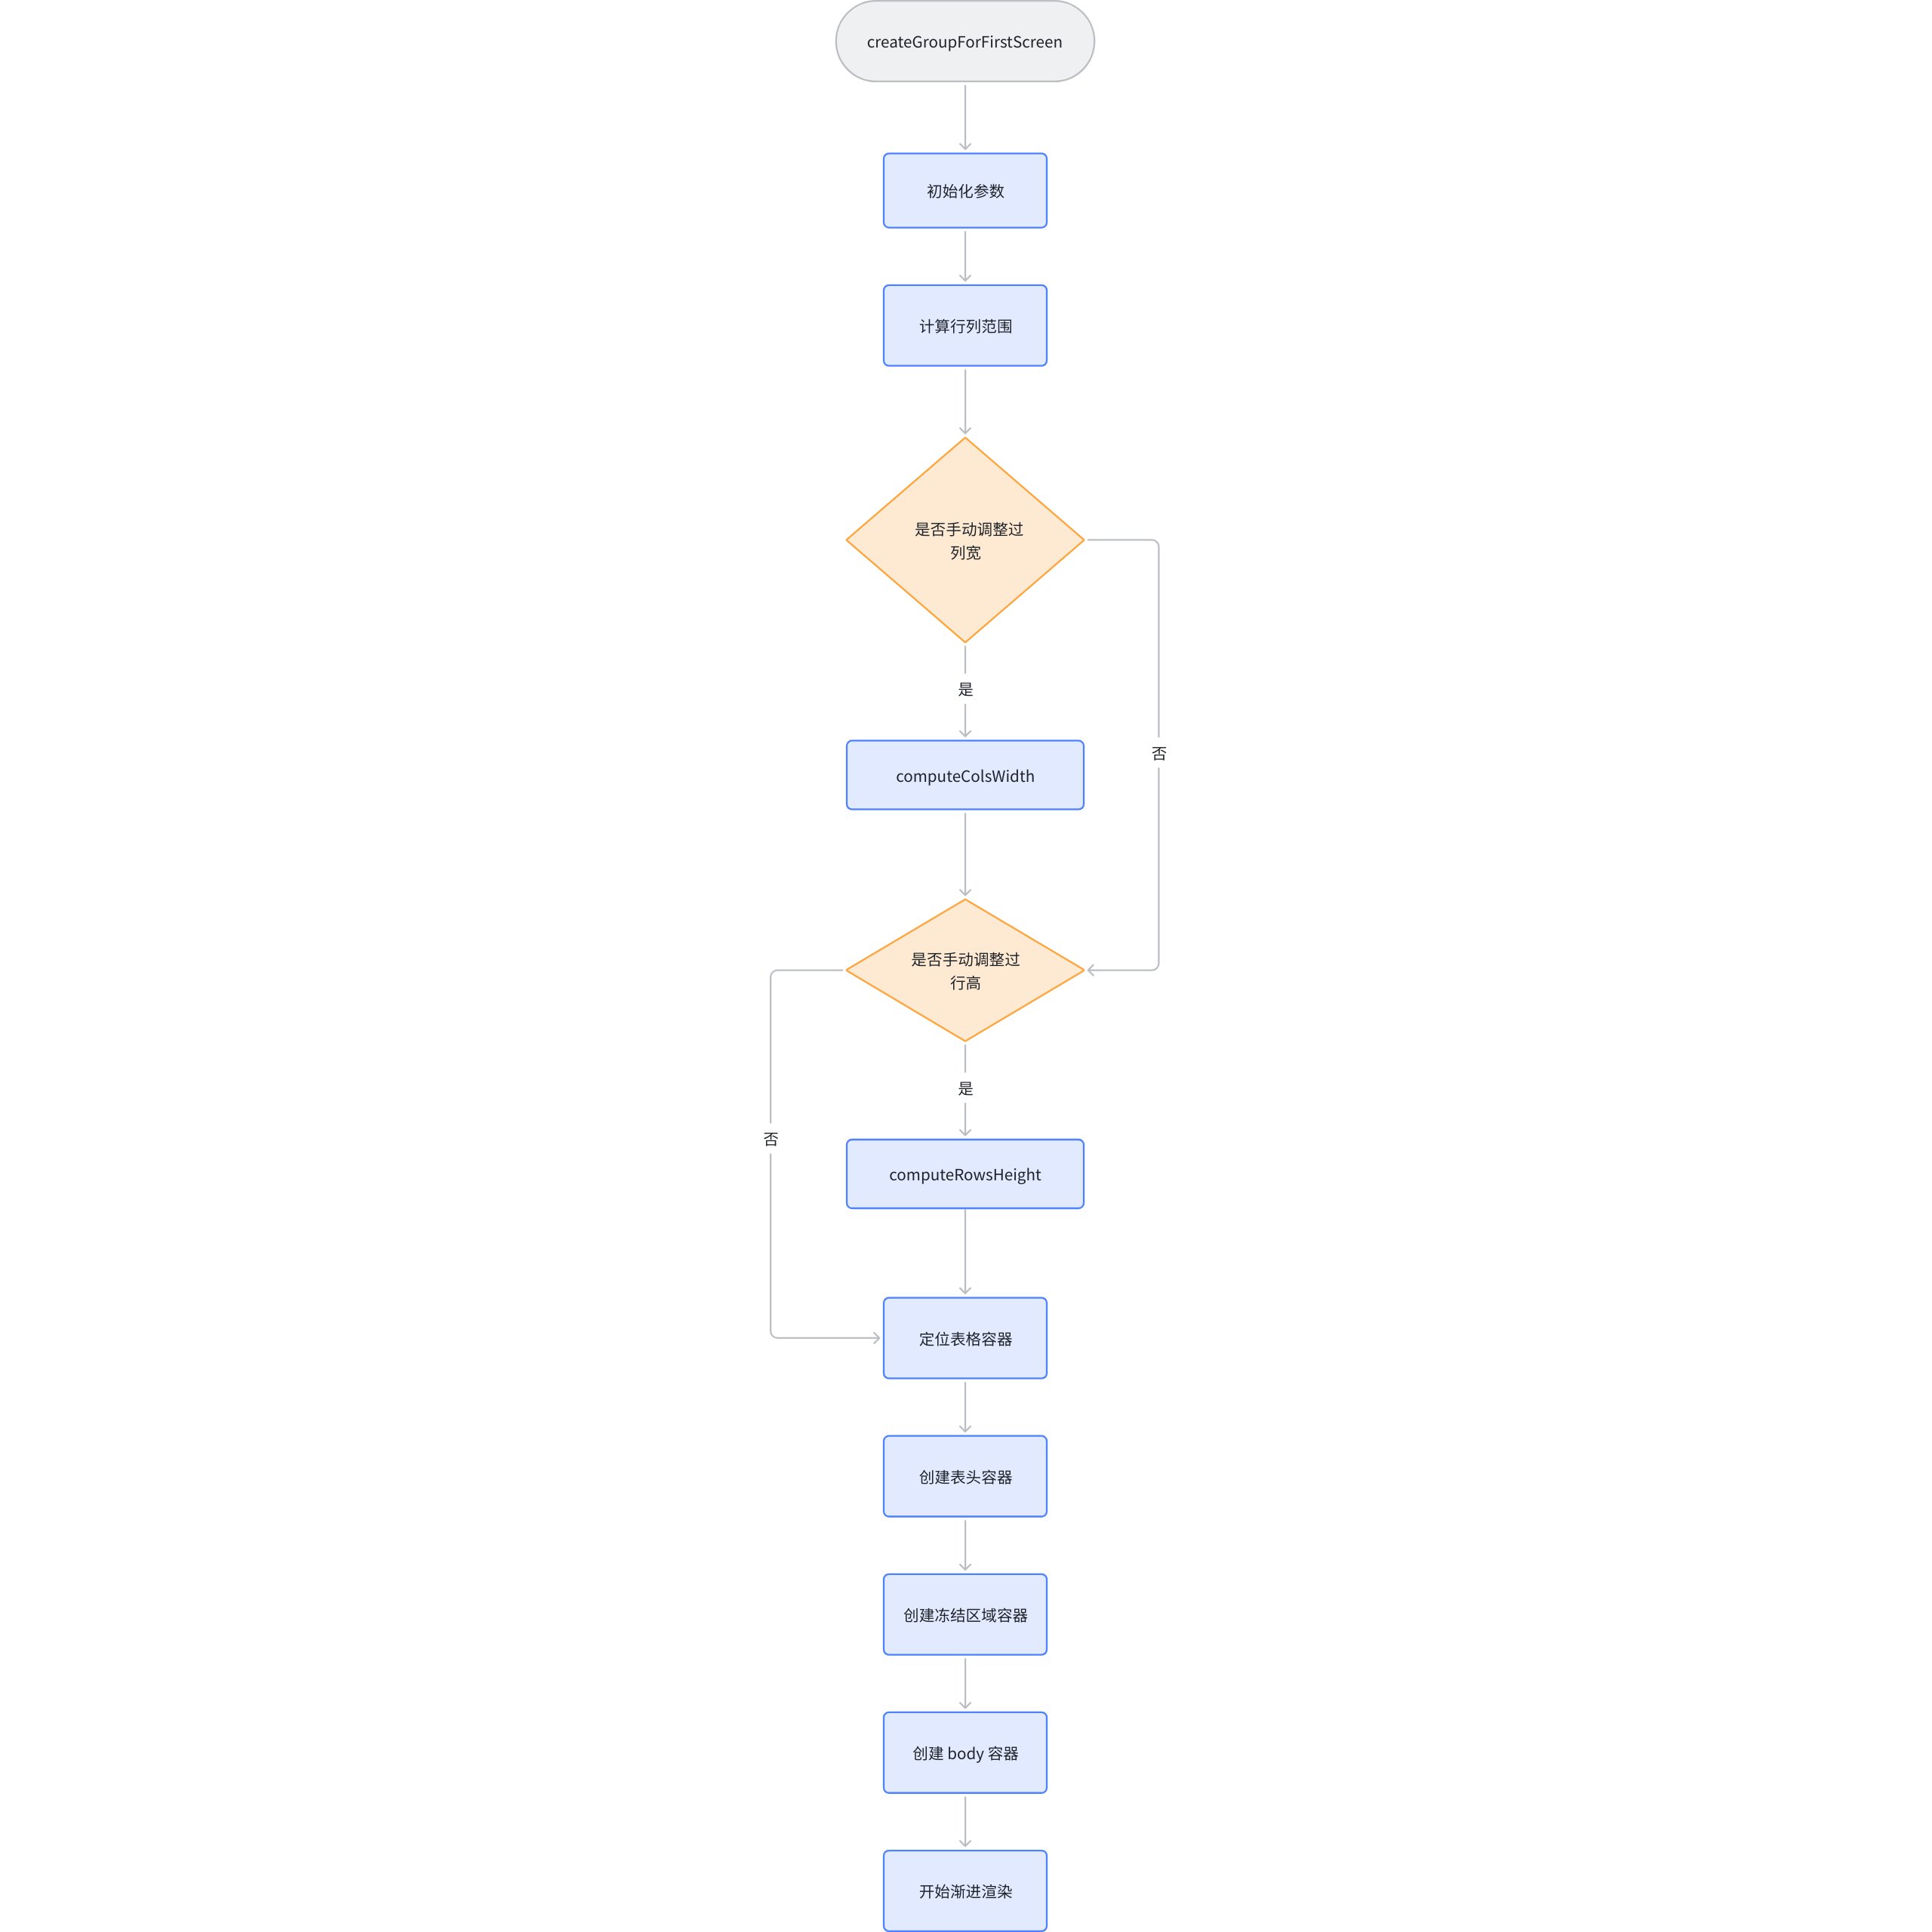
The previous article mentioned that the entire scene tree is created using createGroupForFirstScreen in the VTable. We will analyze it directly from this function.
It can be seen that after the process of createGroupForFirstScreen is completed, the scene tree is filled. Internally, createColGroup is continuously called to achieve container filling.
It is especially noteworthy that this function only involves the filling of the column container. The initialization of the container is located in initSceneGraph, which will be called when initializing the scene graph.
The file is located at VTable\packages\vtable\src\scenegraph\group-creater\init-scenegraph.ts
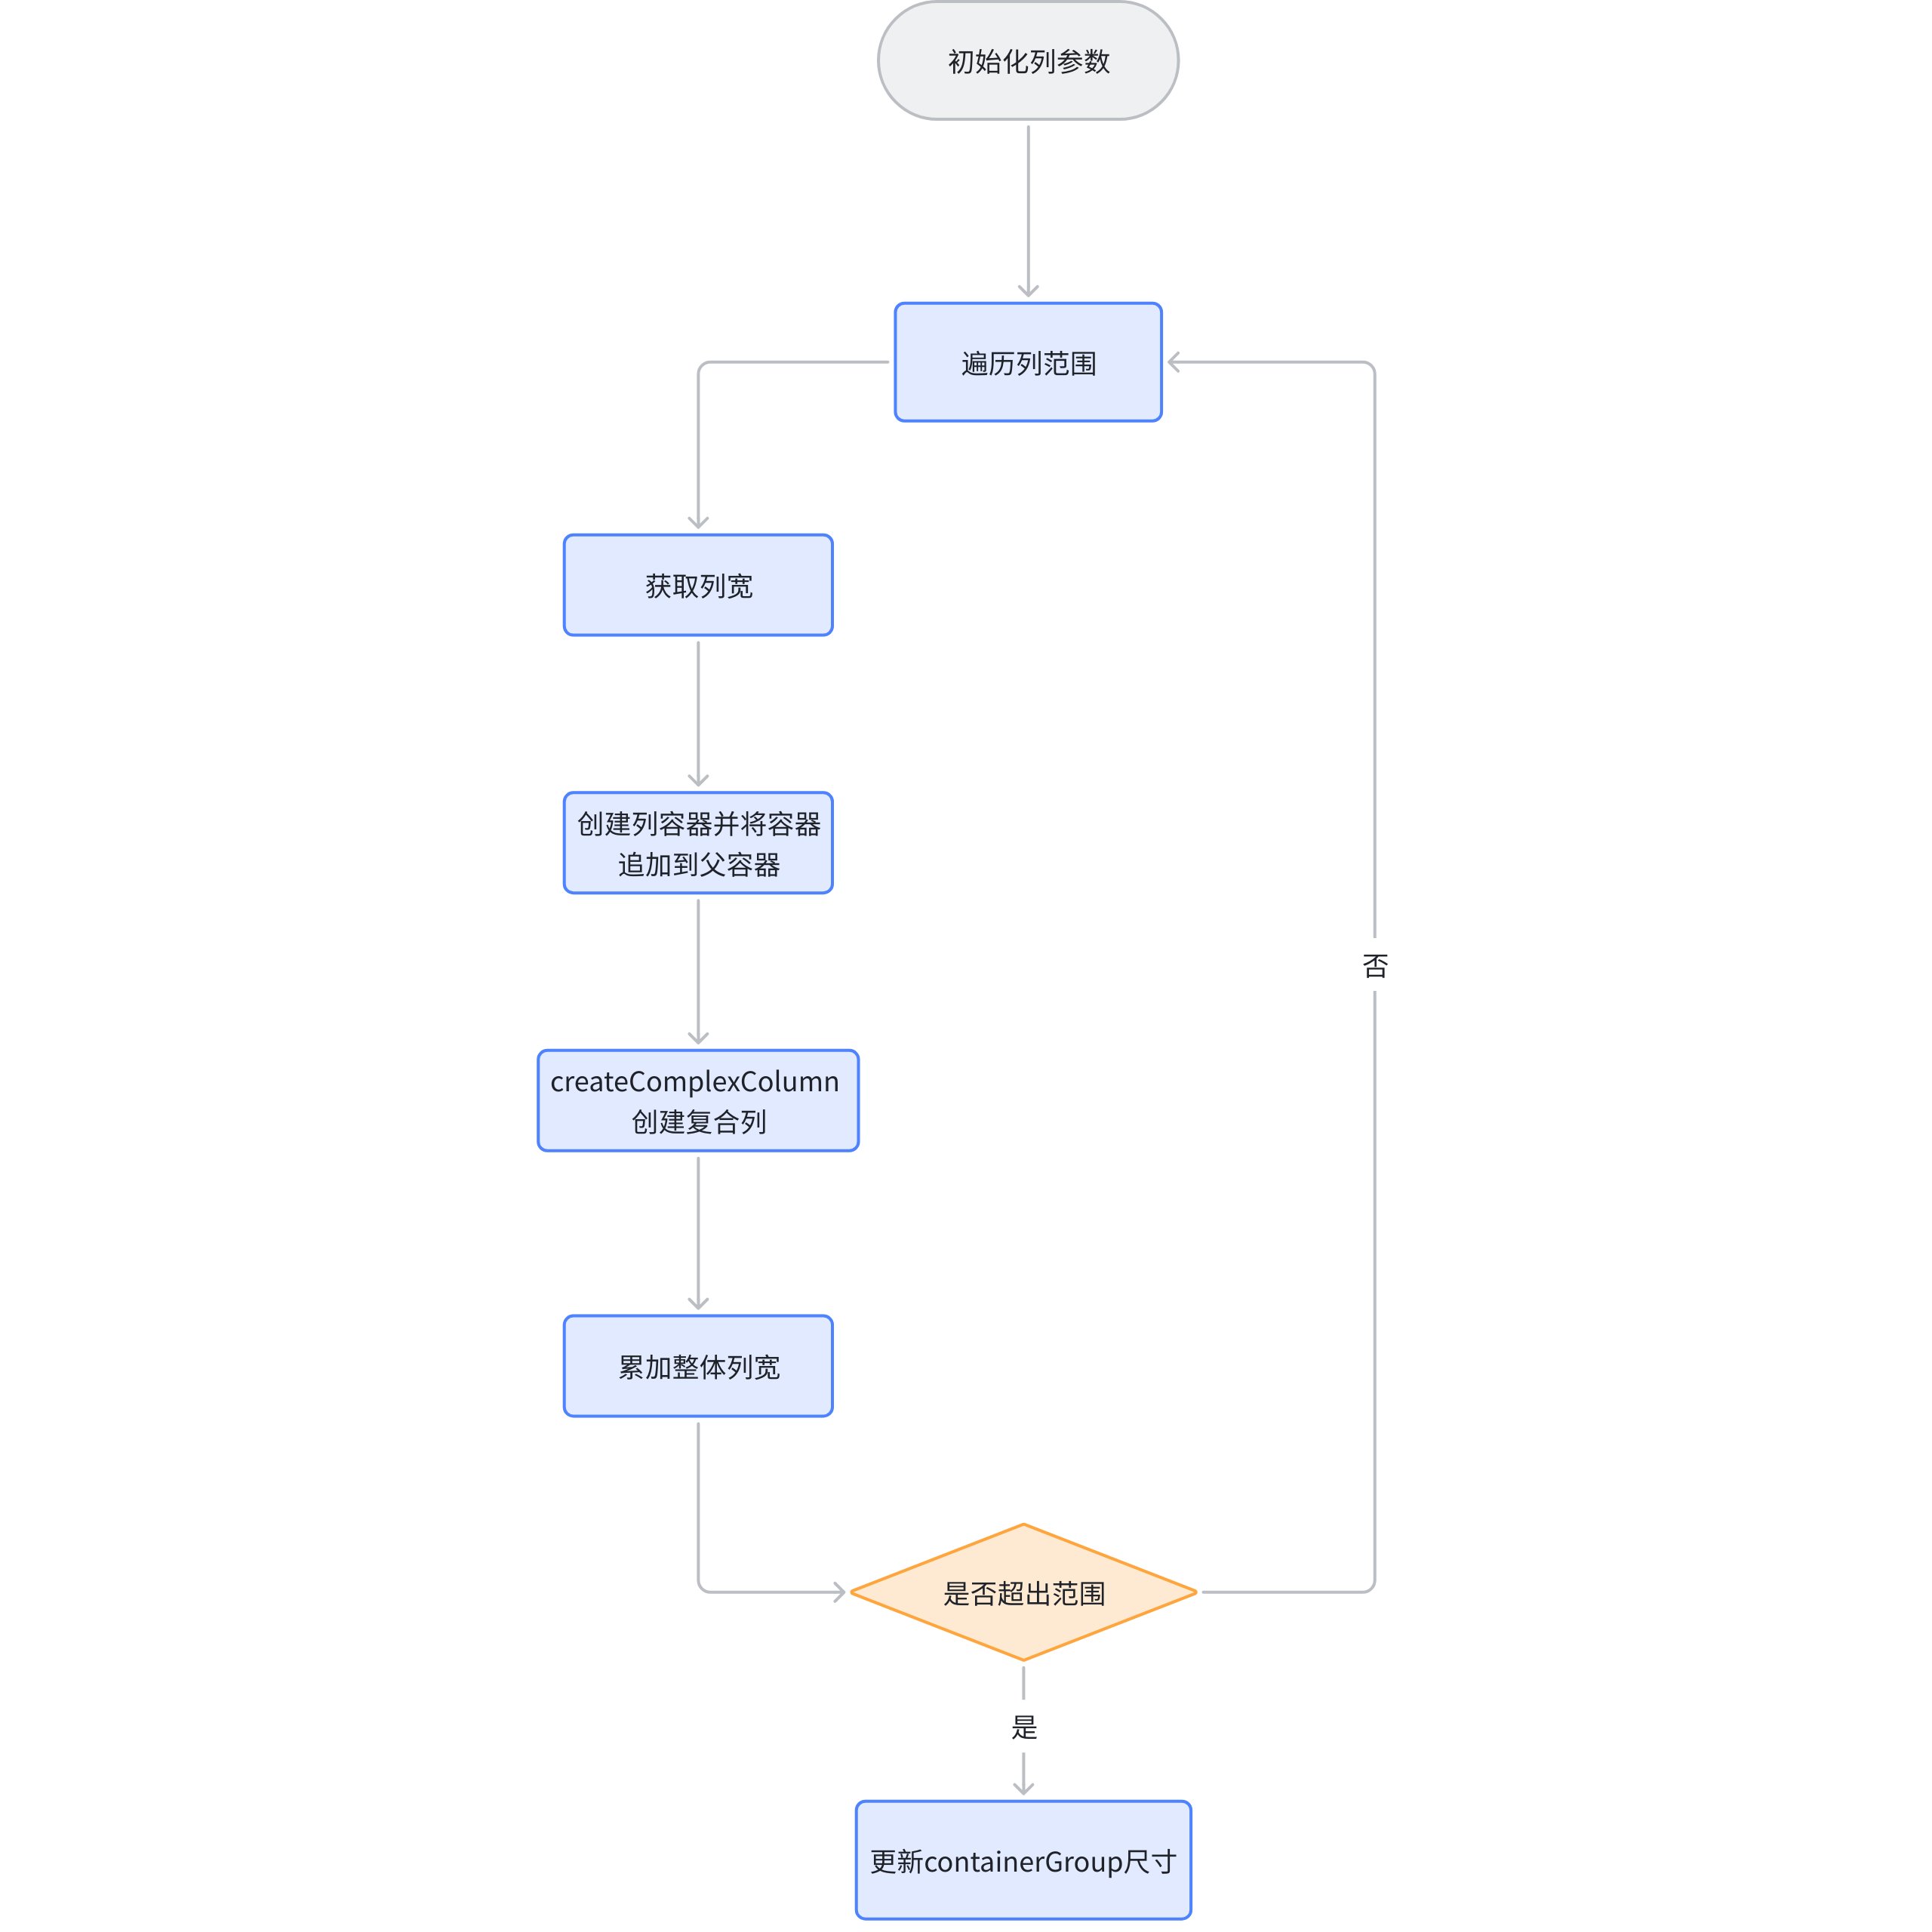
Generate a column scene node, call createComplexColumn to populate the ColumnGroup according to the start and end columns, and update the height of each column.
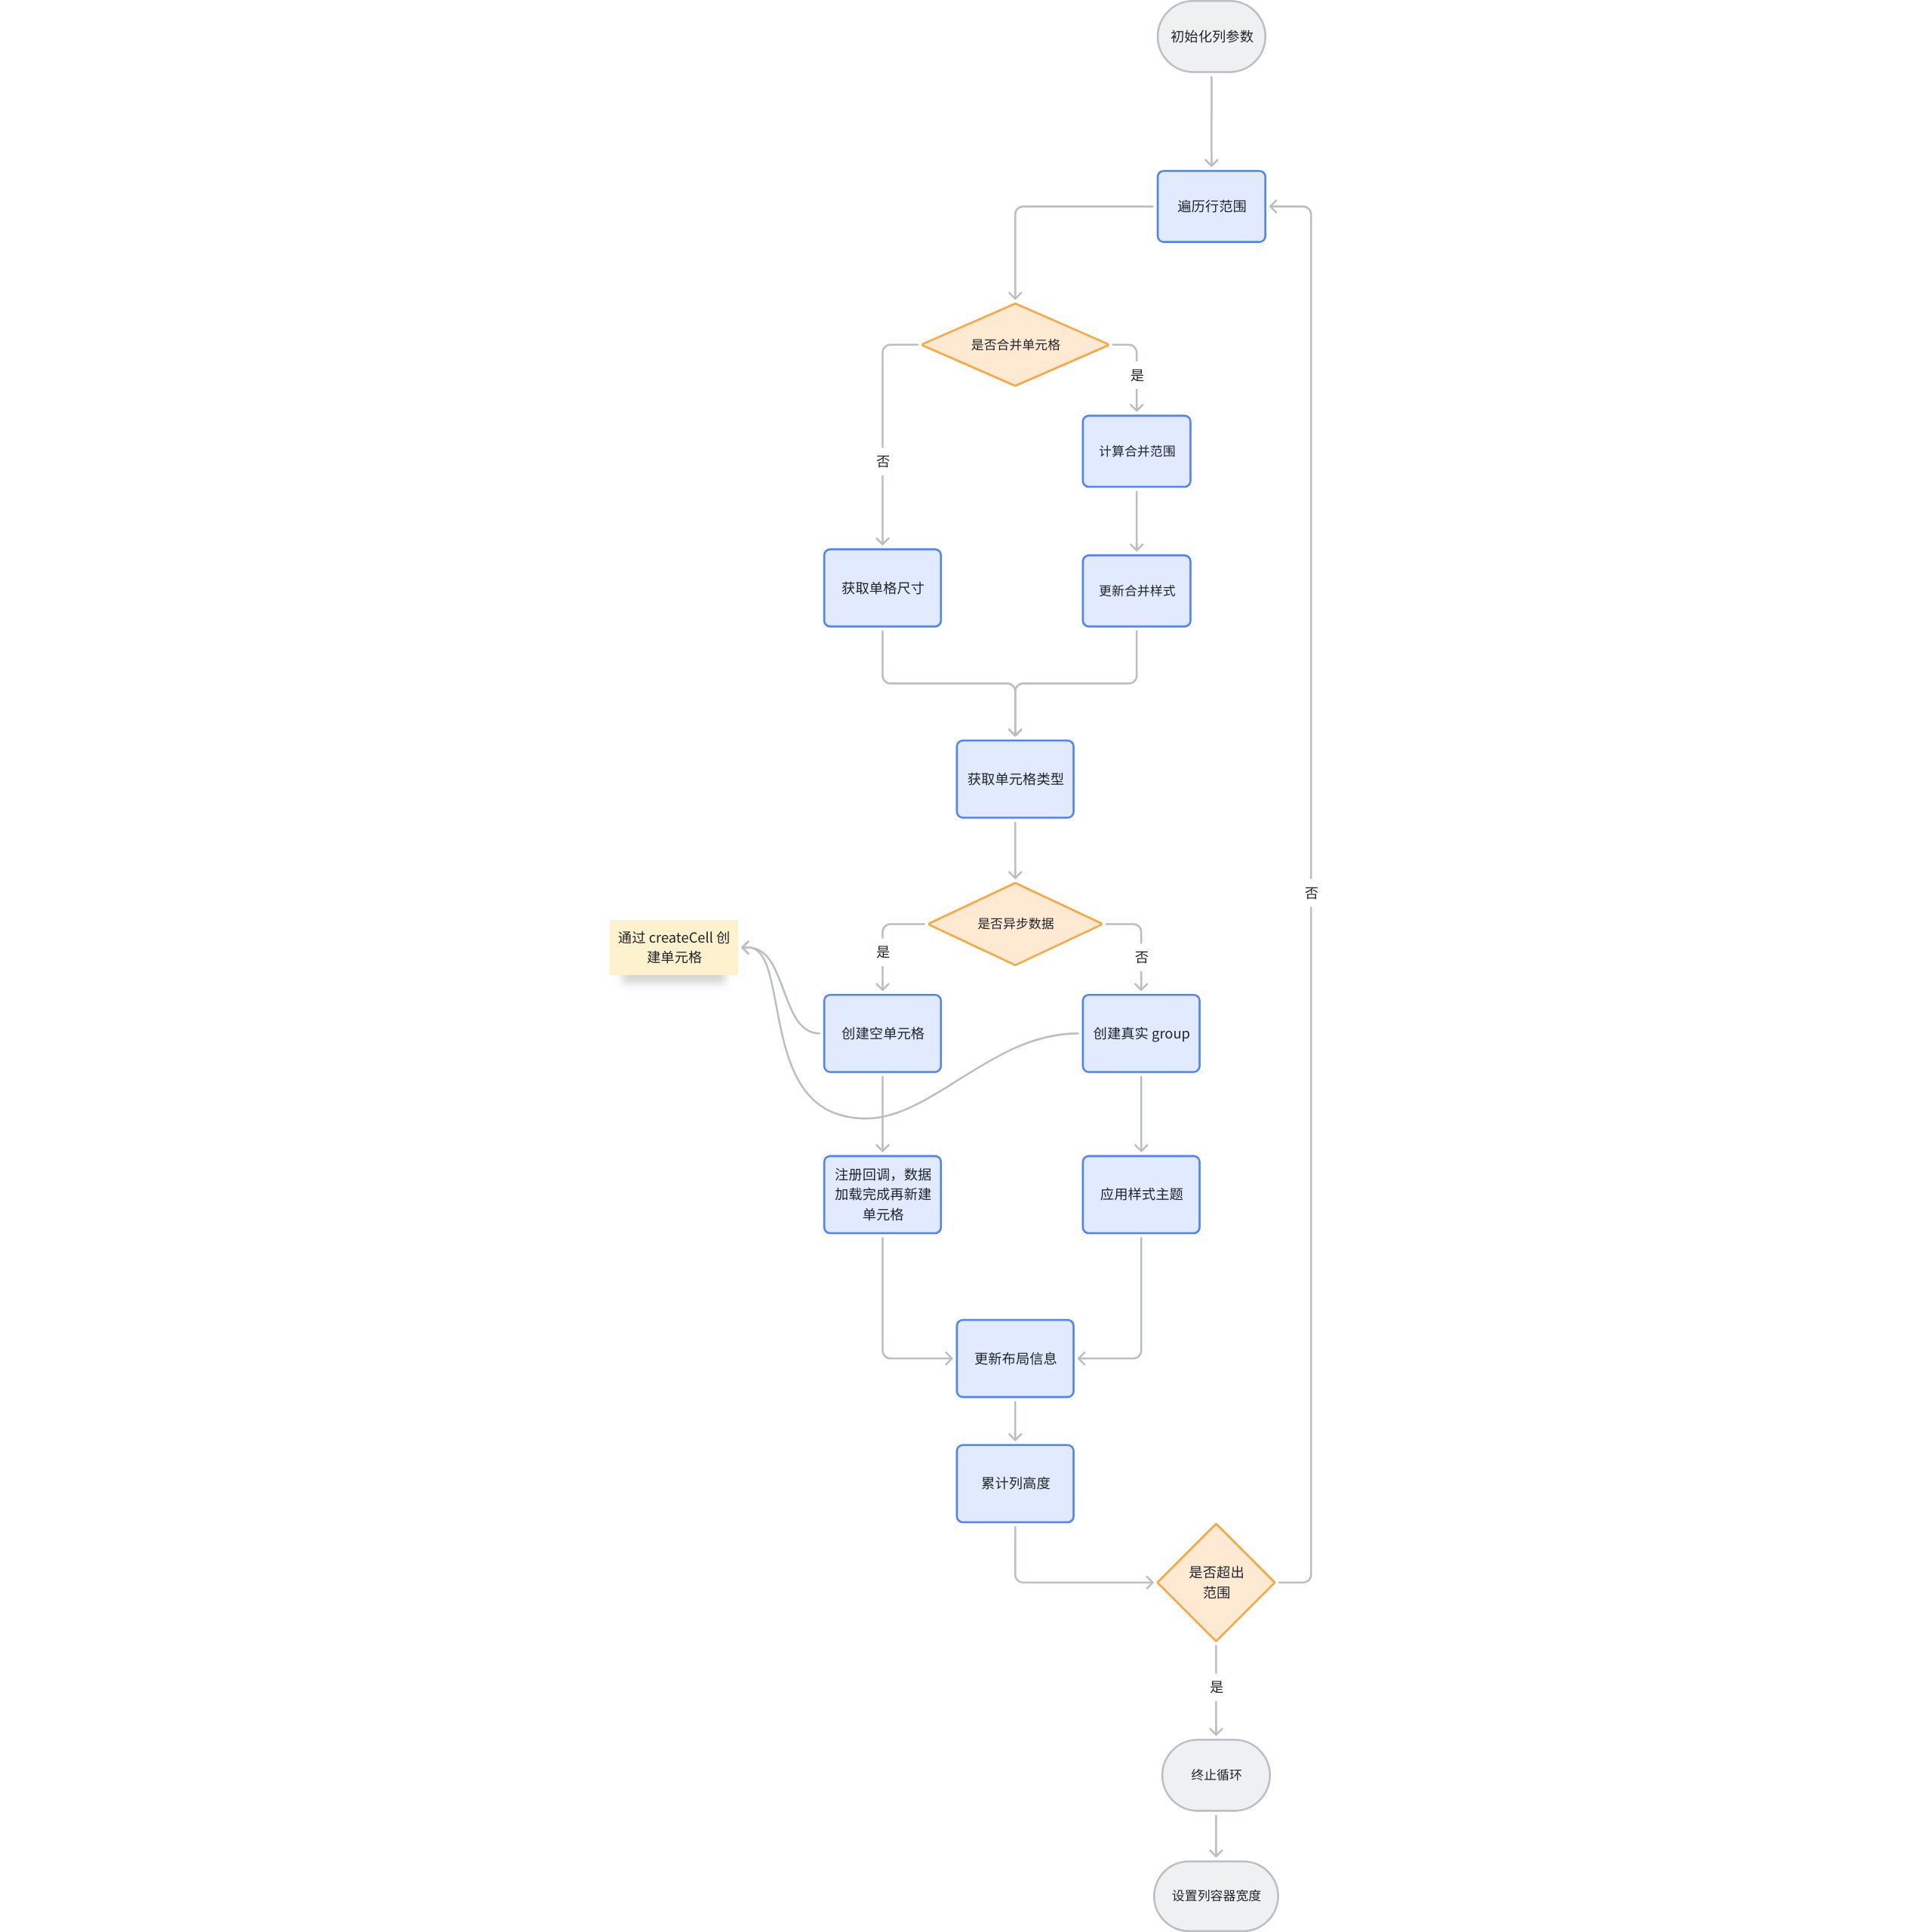
Create a graphic element for each row based on the range of rows, and it will be divided into common cell groups according to the rows.
createCell
From the internal import, it can be found that createCell is the creation closure of the cell container. createCell will create a cell based on the passed configuration and insert it into the corresponding column container, generating different primitives according to different types.
// packages\vtable\src\scenegraph\group-creater\cell-helper.tsimporttype { CreateChartCellGroup } from './cell-type/chart-cell';
importtype { CreateImageCellGroup } from './cell-type/image-cell';
importtype { CreateProgressBarCell } from './cell-type/progress-bar-cell';
importtype { CreateSparkLineCellGroup } from './cell-type/spark-line-cell';
importtype { CreateTextCellGroup } from './cell-type/text-cell';
importtype { CreateVideoCellGroup } from './cell-type/video-cell';
Basic Table Layout Organization Full Process
From the above logic, the basic display process of VTbale first creates all the necessary containers, including the header container and the body container. Then, it iterates through the columns to create header column containers, configures each row to create cell containers, and then creates body column containers, continuing to configure rows to generate cell containers.
Simply put, first create each structure container, then create column containers, and finally the cells. \r
Verification
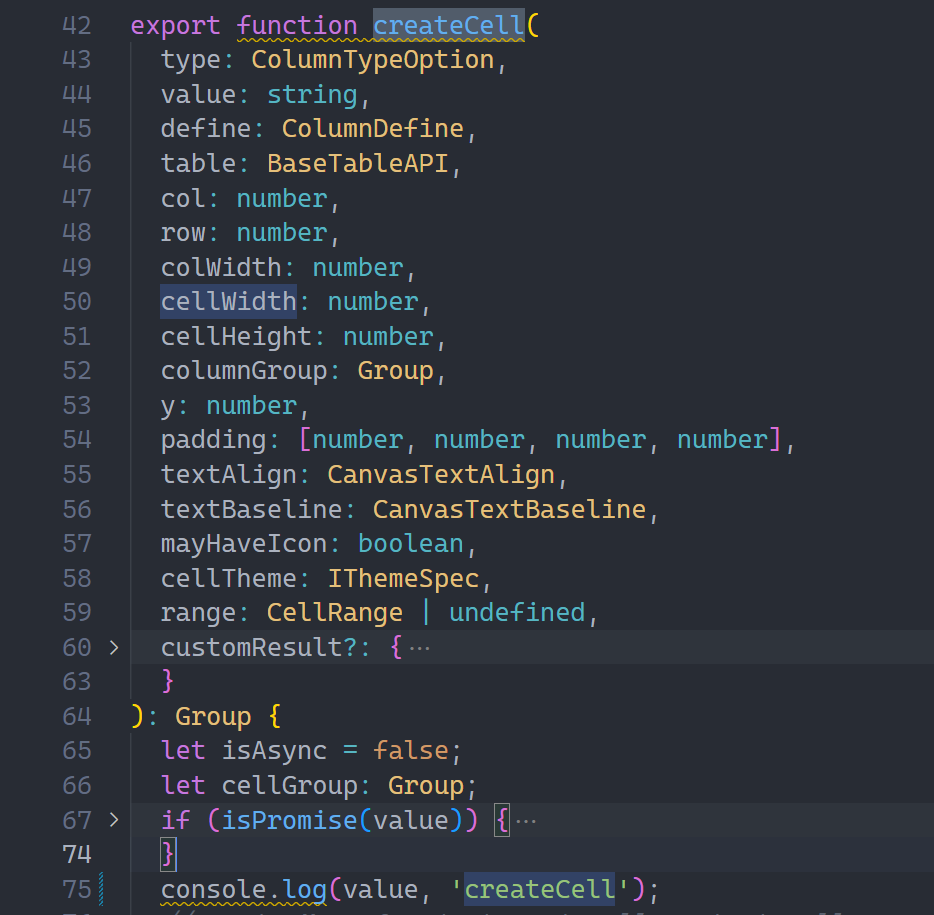
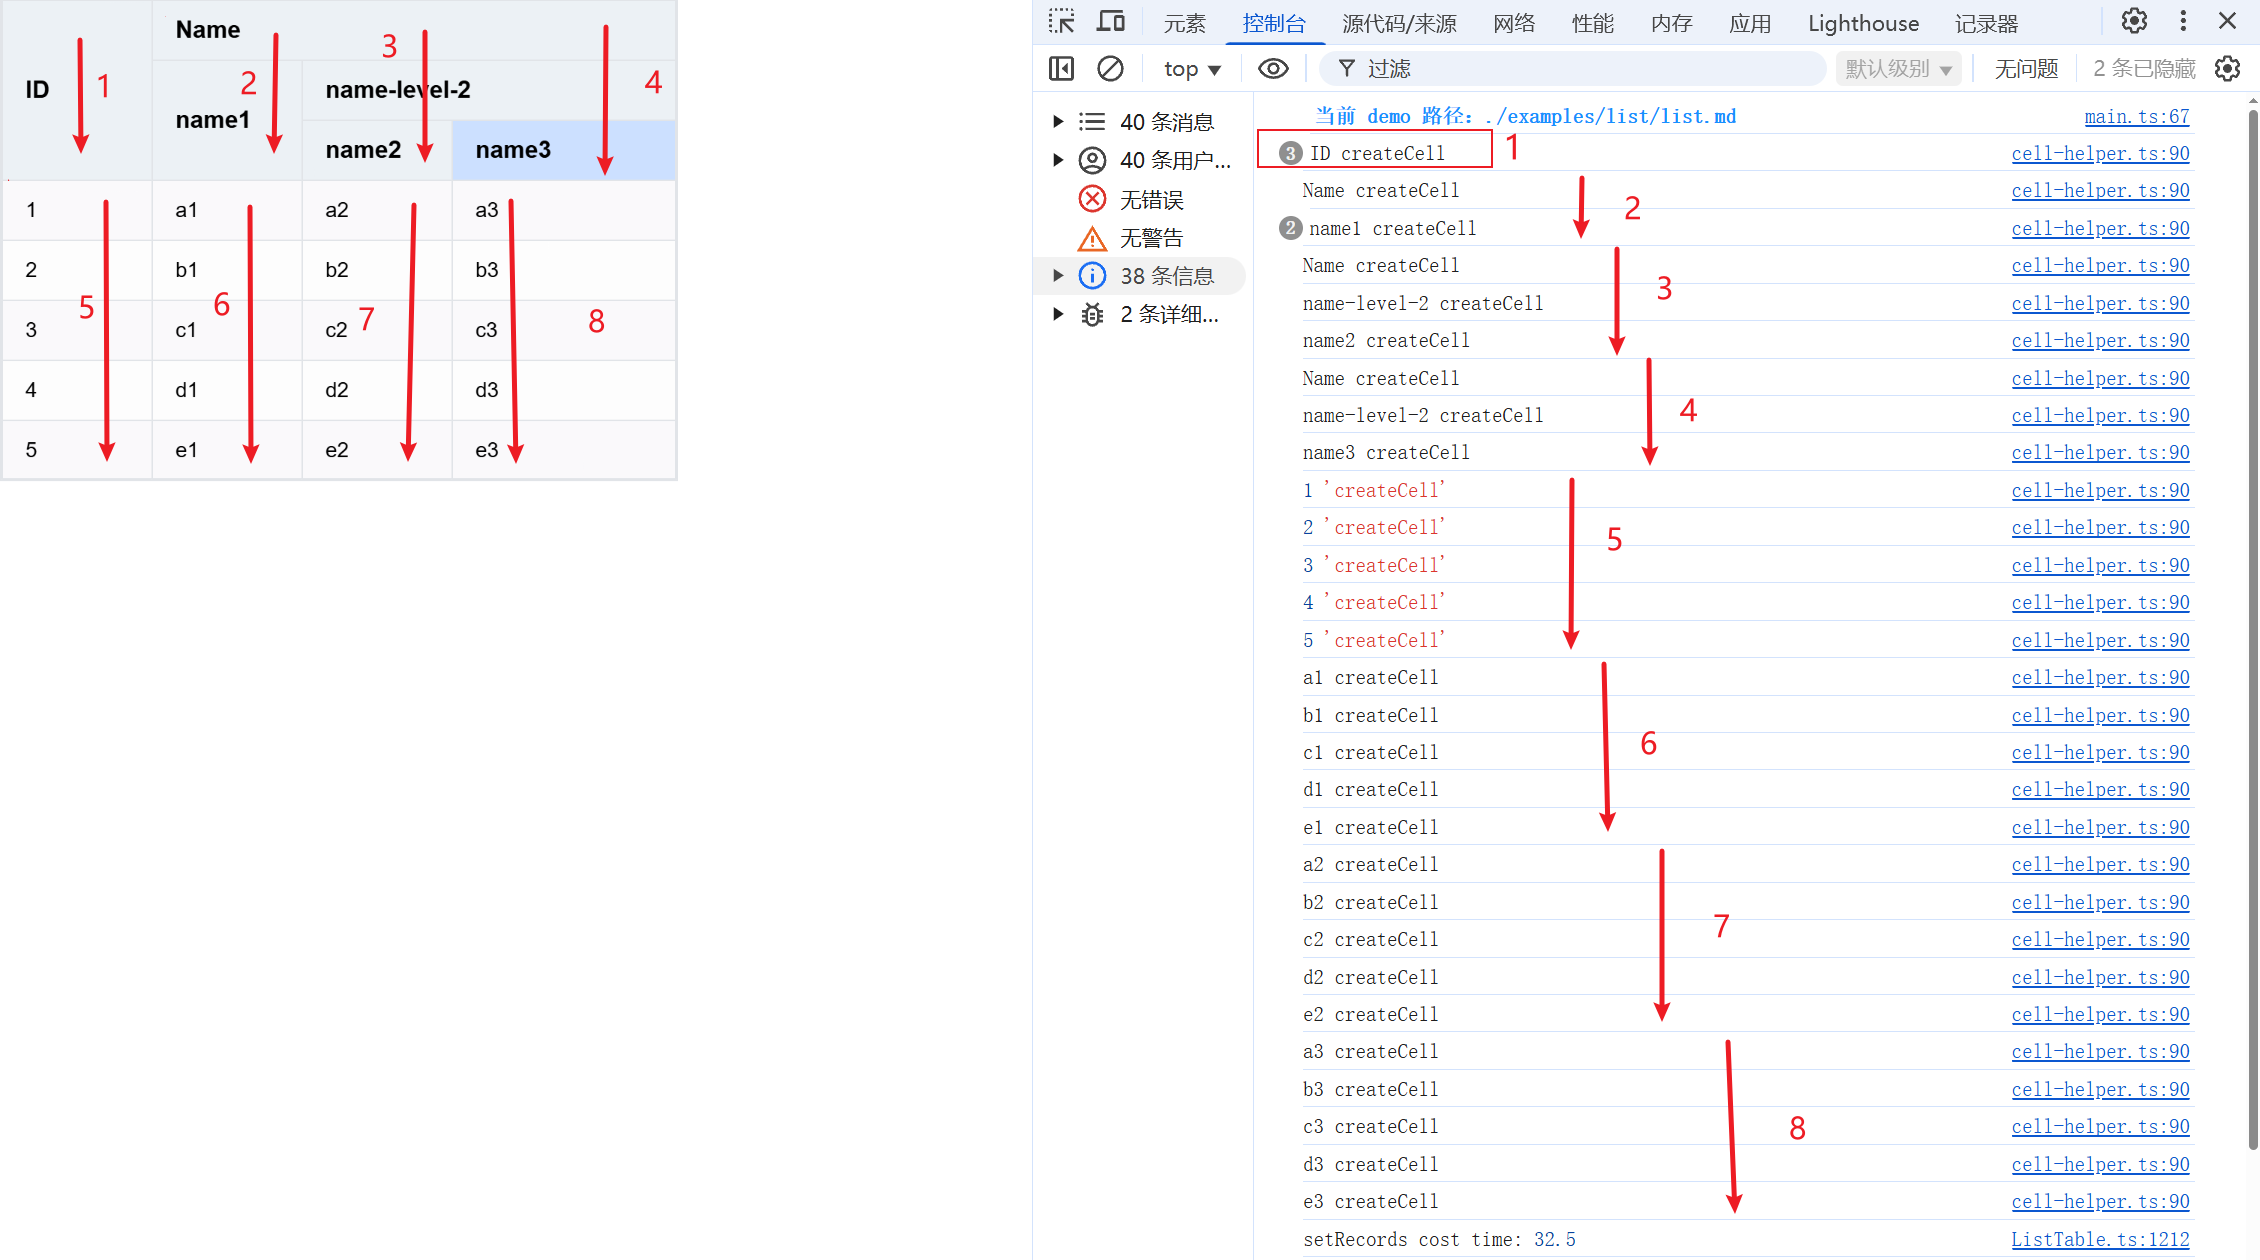
We print the value in createCell to see if the creation order is the same as we analyzed.
Observe the console output, perfectly validating our previous analysis.
Data Presentation
Get the value of a cell
After discussing the layout process of basic tables, let's see how basic tables obtain the value that needs to be displayed in each cell.
Returning to the previously mentioned createComplexColumn, you can see that before creating a cell, it always calls table.getCellValue to get the display value of the current cell. For a basic table, table represents ListTable.
// packages\vtable\src\scenegraph\group-creater\column-helper.tsexport function createComplexColumn() {
// 省略let value = table.getCellValue(col, row);
// 省略}
For the cells in the body section, the lowest level of ListTable.getCellValue will use _currentPagerIndexedData, which represents the index of records corresponding to each row on the current page. It will be updated in the DataSource.updatePagerData method based on pagination and currentIndexedData.
Due to the existence of currentPagerIndexedData, when you want to get the cell value, you only need to find the record in the original data through the index of the current row, and then you can match the original value of the cell according to the column index.
As for obtaining the value of the header cell, it directly retrieves the corresponding configuration from _headerObjectMap, indirectly obtaining the title from columns, then performs some special processing on it, and uses it as the value of the header cell. The specific process will not be elaborated here. \r
currentIndexedData
Regarding currentIndexedData, it has already been mentioned before. Here, we will emphasize its meaning and usage again. \r
Due to the various interaction methods of ListTable, such as row and column transposition and tree structure, it is very difficult to obtain cell values. Therefore, ListTable introduces currentIndexedData (the index of the source data corresponding to each row) to assist in data processing. \r
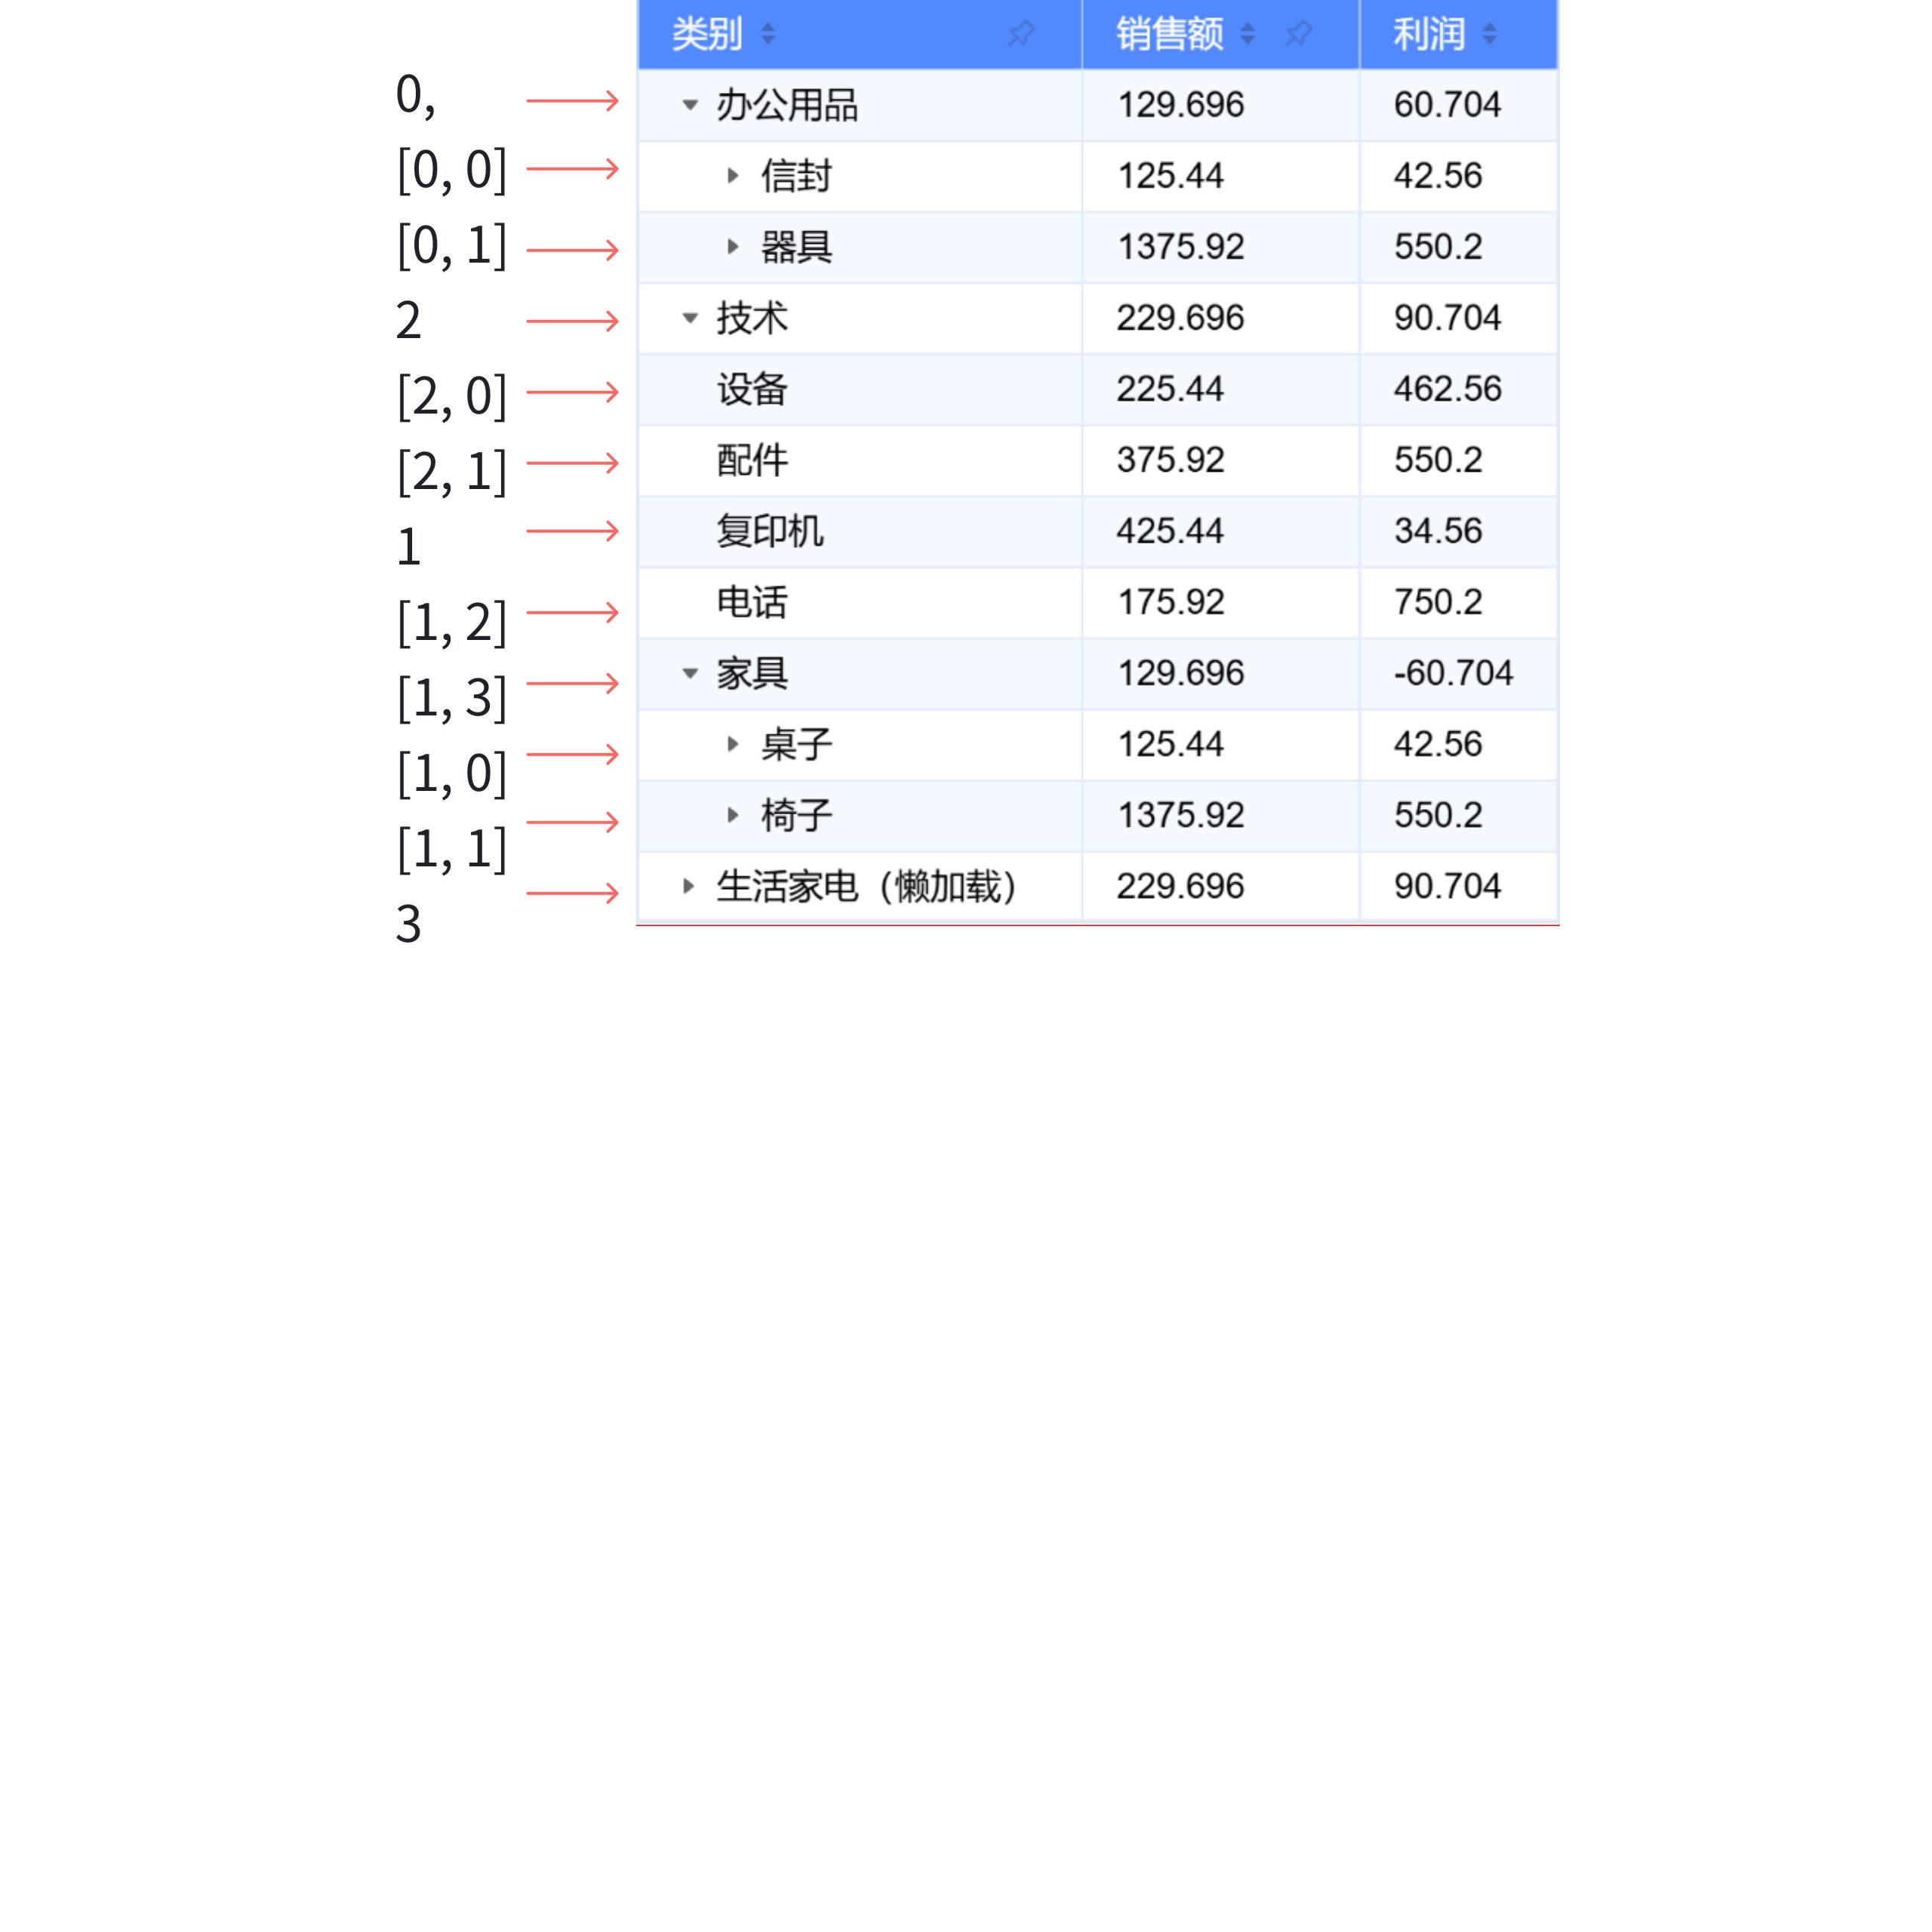
So how to use currentIndexedData? You can refer to the DataSource.getValueFromDeepArray method. For example, to get the data of the second row, the reading method is tableInstance.dataSource.records[0].children[0], which corresponds to [0,0].
By abstracting the direct reading or modification of raw data into a form of adjusting and retrieving the corresponding row record through an index, without needing to modify the original data, it allows for focusing only on the index corresponding to each row when updating the layout, without worrying about the original data, thus reducing cognitive load.
Transpose of Rows and Columns
Concept
Transposing rows and columns is to swap the rows and columns of a table, and this feature is only available in basic tables. \r
Unlike other table component libraries based on native DOM that require complex customization to achieve transposition functionality, ListTable can enable row-column transposition with just one configuration. Let's see how ListTable implements this feature.
Scene Tree Creation Process
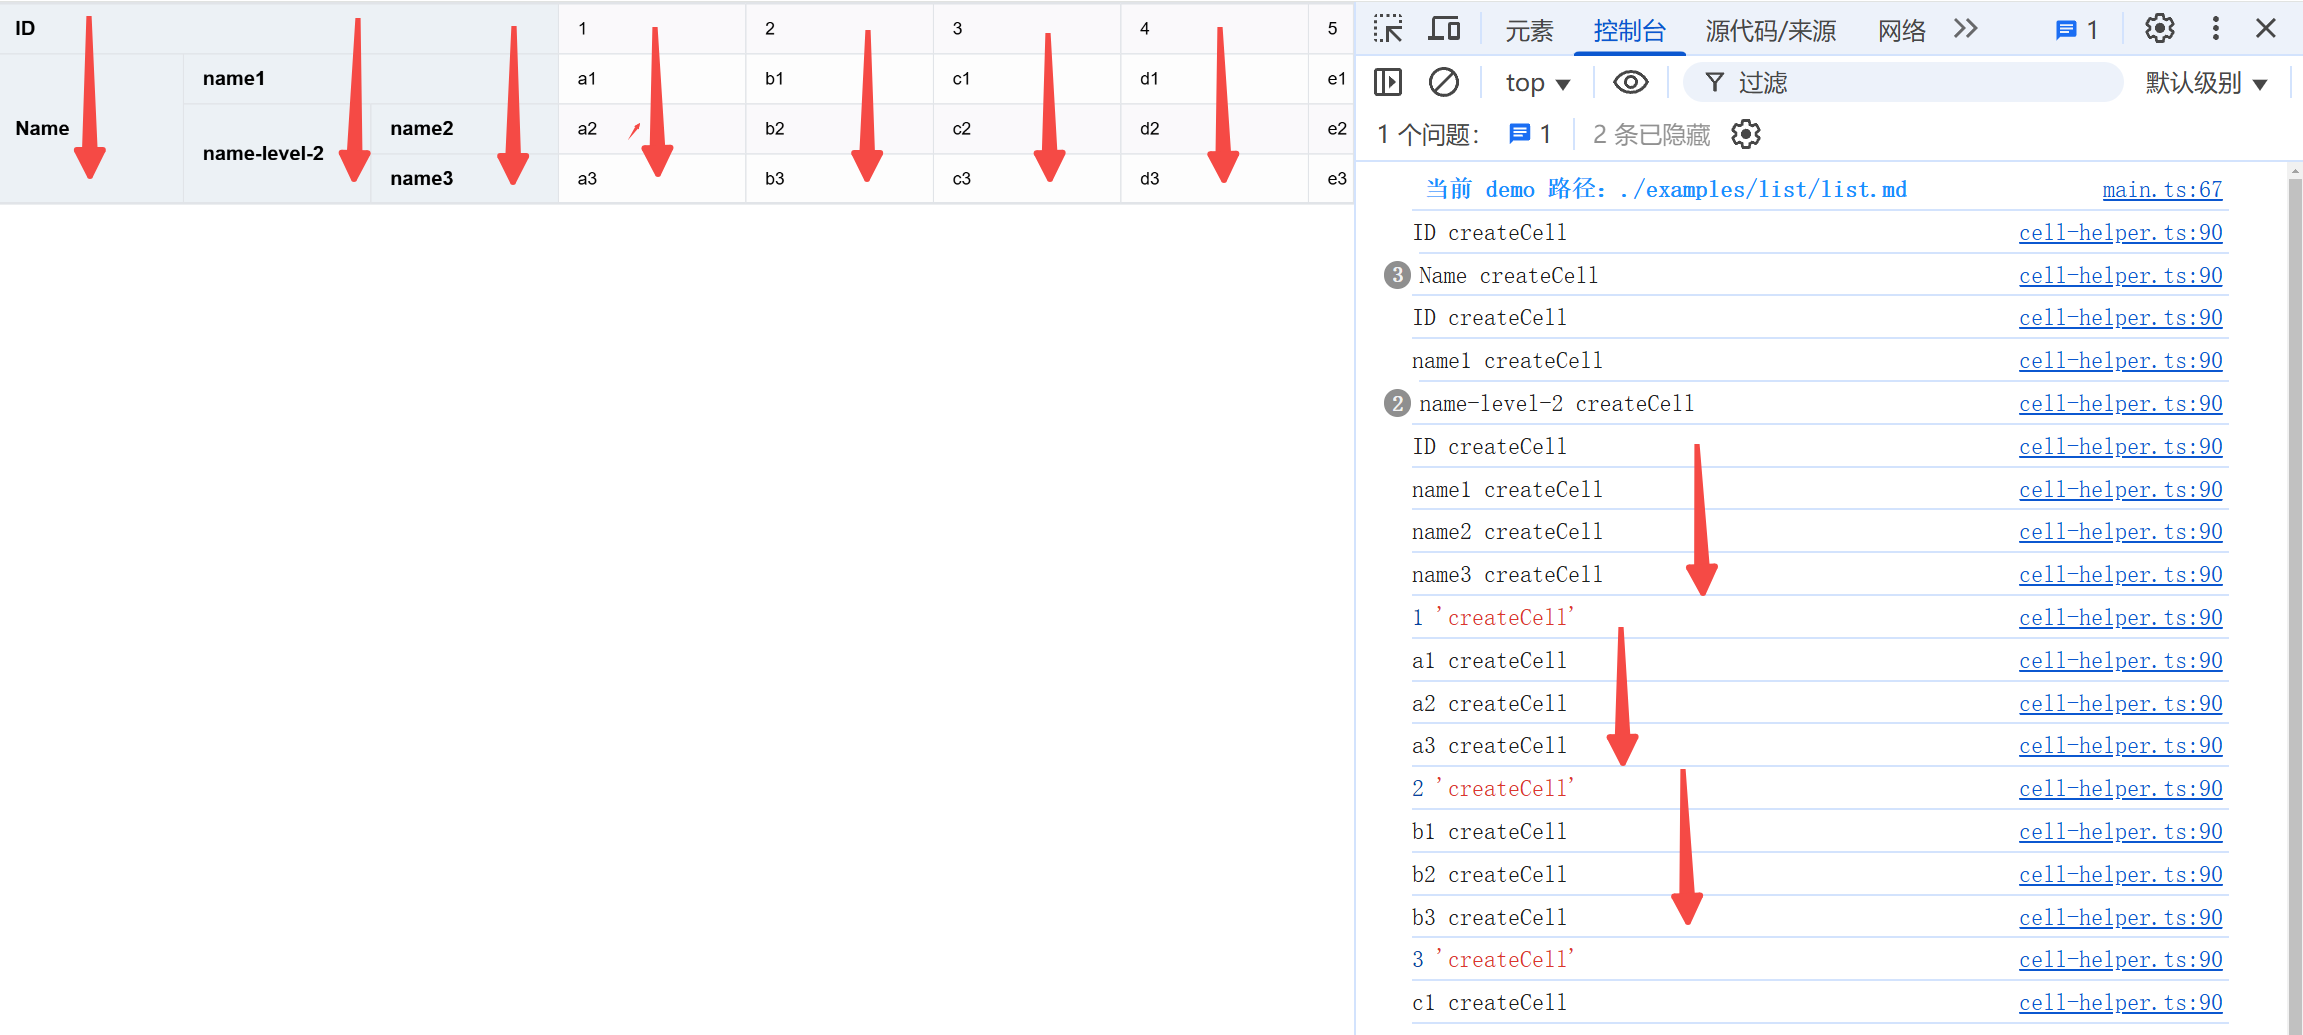
By observing the calls to getCellValue, it is found that the creation process of the scene tree remains the same.
Post-transposition Processing
Think about how to handle the transposed data, two obvious methods come to mind: \r
Directly change records
Specially handle data reading based on whether to transpose or not \r
ListTable internally adopts the second solution. The reason for not adopting the first solution is that there is too much dependency on records internally, including data addition, deletion, modification, and query. If records are directly modified, it affects many areas, not to mention the situation where users need to frequently modify data, which requires compatibility in many places. \r
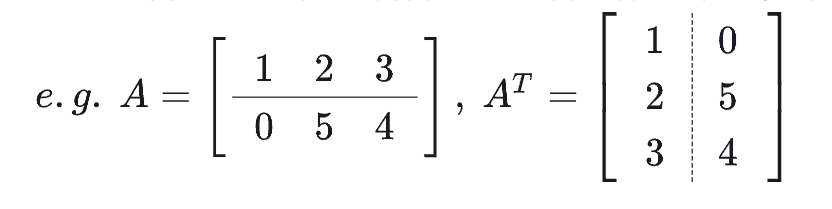
We use the transpose matrix in linear algebra for comparison. A transpose matrix is where the number of rows becomes the number of columns, and the number of columns becomes the number of rows. Originally, values were accessed using records[row][col], but now they should be accessed using records[col][row].
Originally, the header was determined by row, now it needs to be determined by col.
// packages\vtable\src\layout\simple-header-layout.ts isHeader(col: number, row: number): boolean {
if (
this.transpose &&
col >= this.leftRowSeriesNumberColumnCount &&
col < this.headerLevelCount + this.leftRowSeriesNumberColumnCount
) {
returntrue;
}
if (!this.transpose && row >= 0 && row < this.headerLevelCount) {
returntrue;
}
returnfalse;
}
From the special handling part of transpose within ListTable, transposition not only affects the judgment logic of the header and body parts, but also affects the conversion of the number of rows and columns, the adjustment of col and row when fetching data, and the calculation of table width and height in multiple places. \r
Tree Structure
Background of Use
When users need to view hierarchical data, a tree structure is used. \r
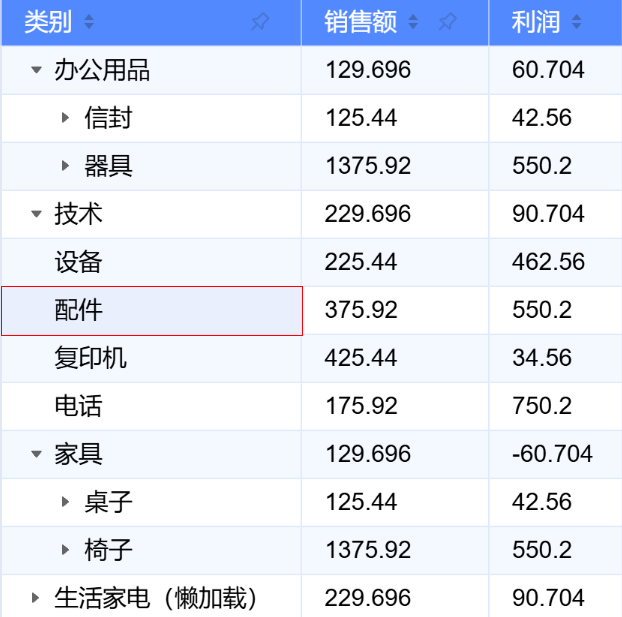
Below is an example of a ListTable tree structure: \r
Configuration
ListTable uses commonly used data configurations in the market, implementing a tree structure by nesting data with children and specifying the tree attribute in columns.
Tree Table Processing
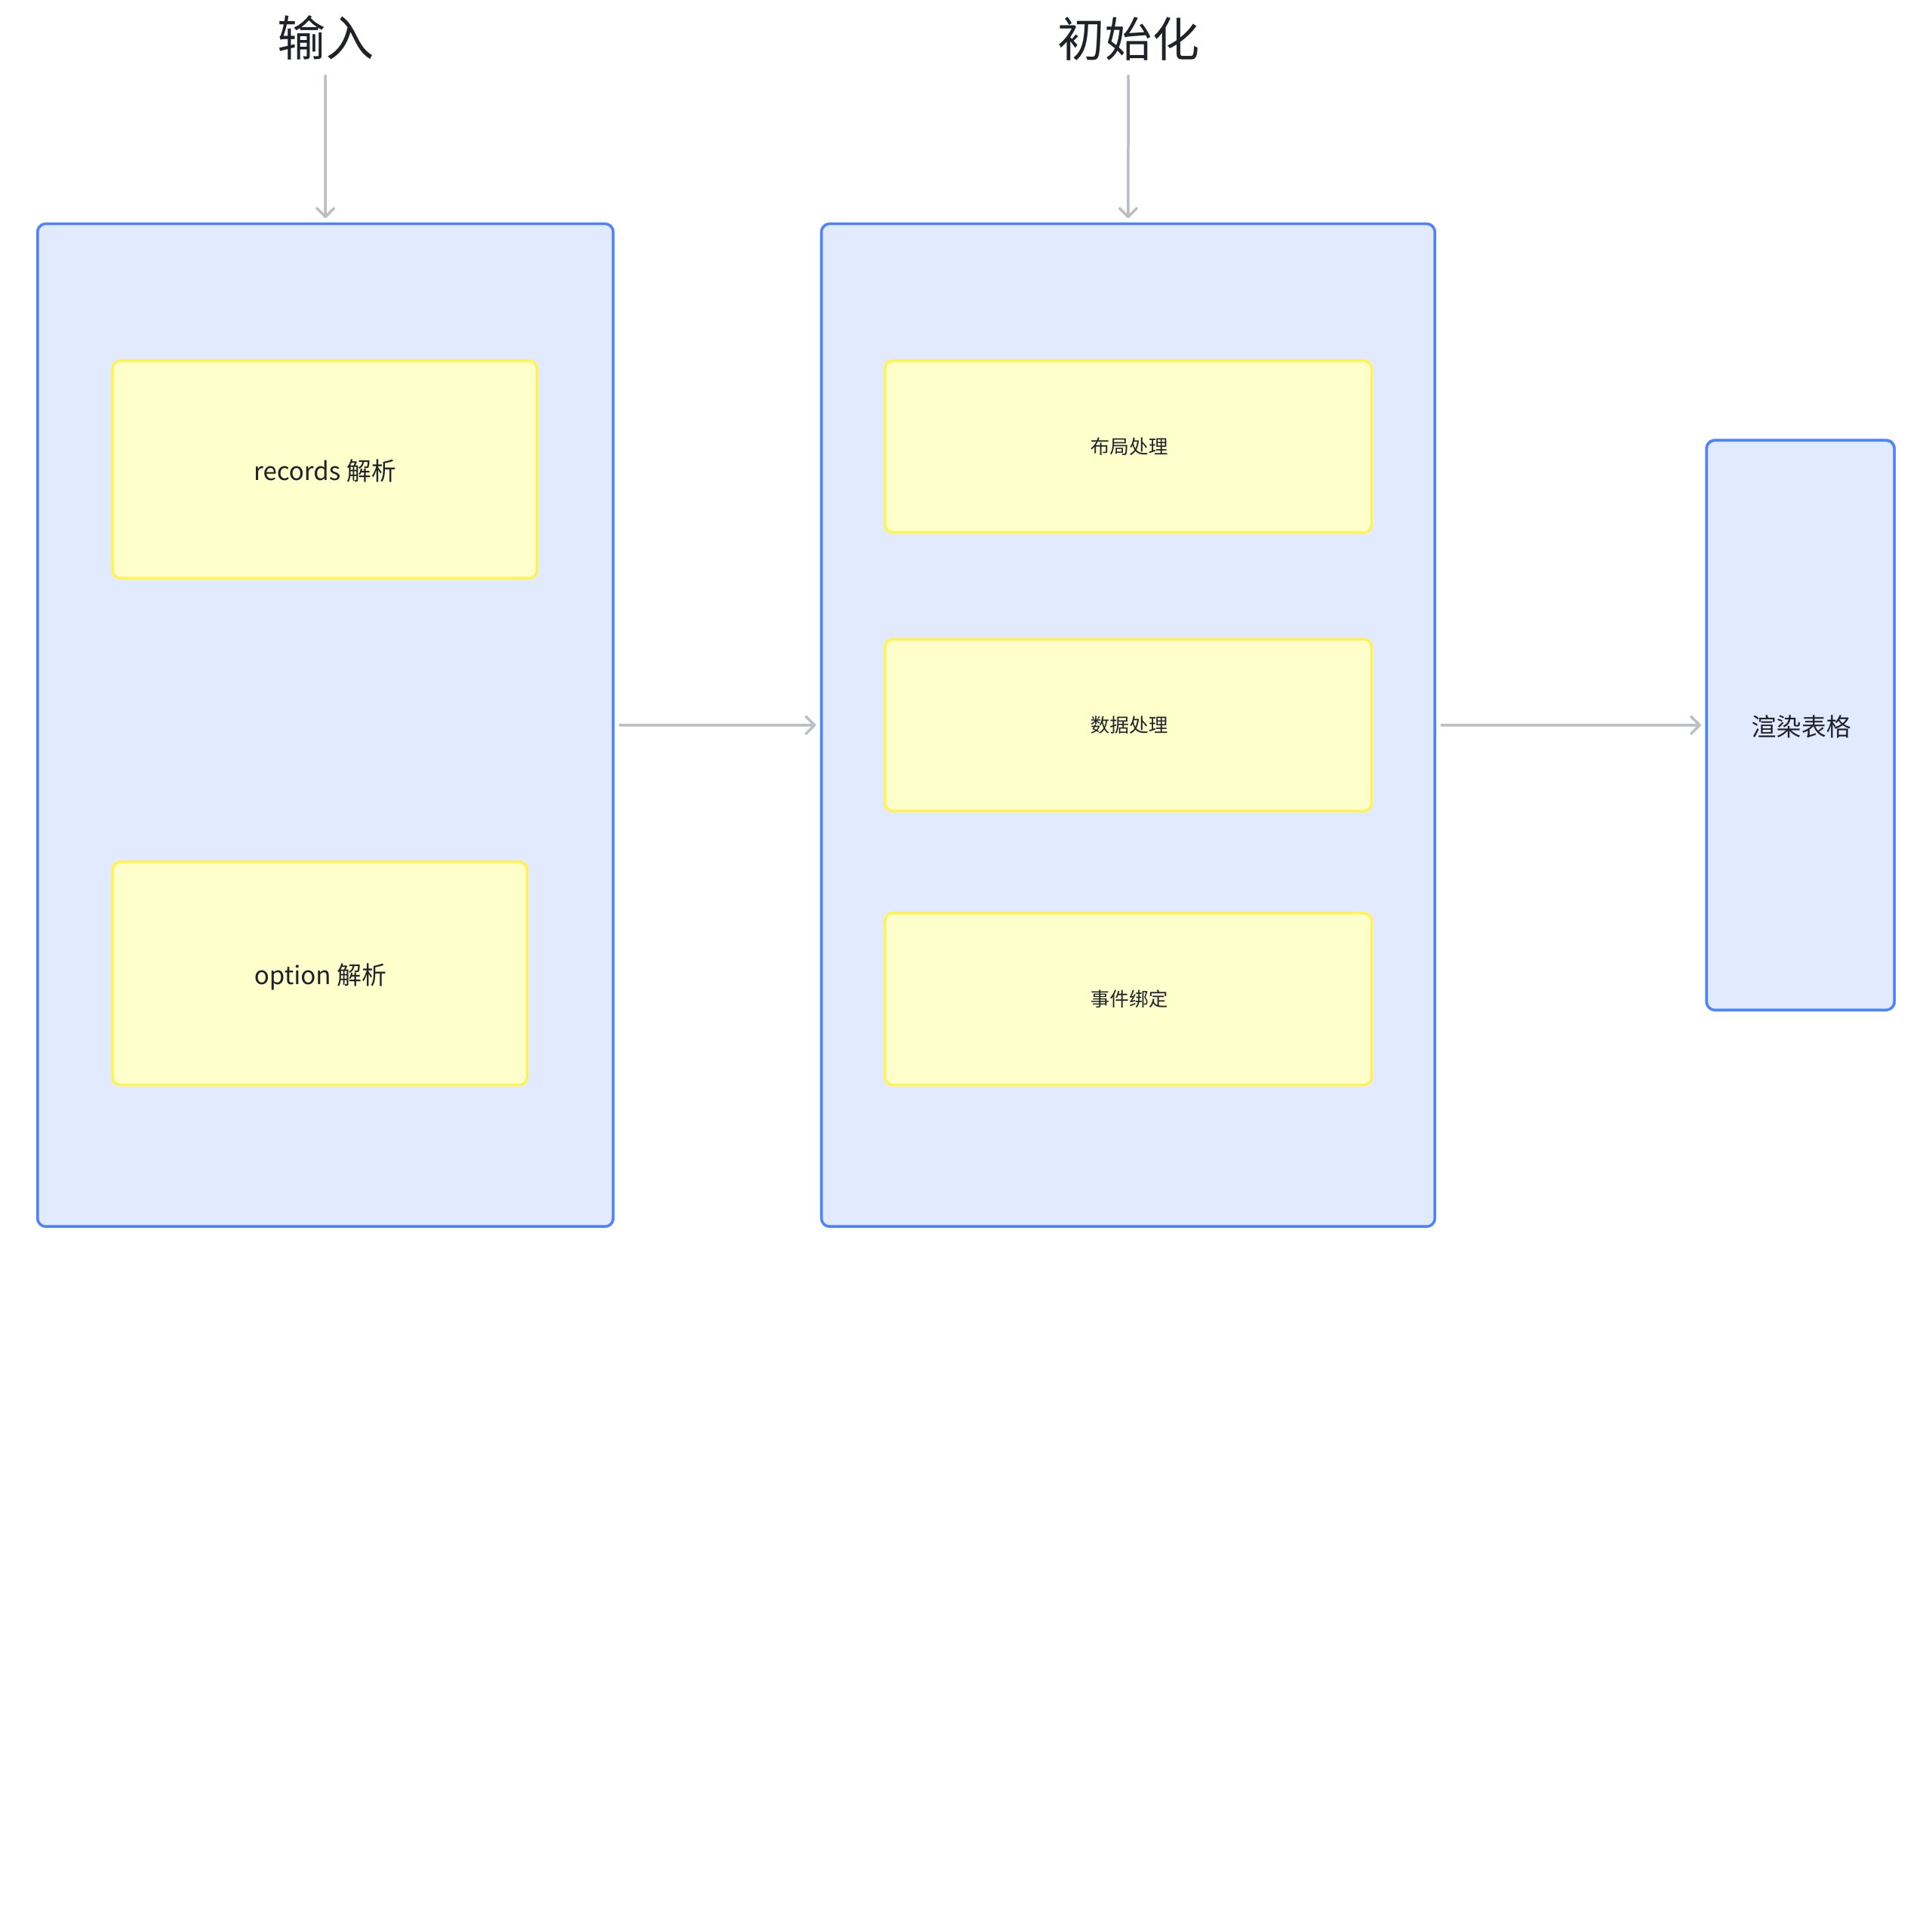
Process Analysis
Parse option:
When initializing the layoutMap, the rowHierarchyType will be dynamically adjusted based on whether the column configuration includes a tree field or a groupBy configuration. Subsequent special judgments will be made based on the rowHierarchyType.
When rowHierarchyType is true, it will call initTreeHierarchyState to initialize the default cell expansion state, adjusting hierarchyState (the expanded/collapsed state of the cell tree structure) and hierarchyExpandLevel (the number of levels expanded in the tree structure) \r
Handle layout: Calculate the placeholder layout for the collapse/expand button, and position the content display based on the hierarchyIndent distance configured by the user for child nodes; \r
Data processing: Special handling of tree-structured data is required, including logic for adding, deleting, updating, querying, and sorting; \r
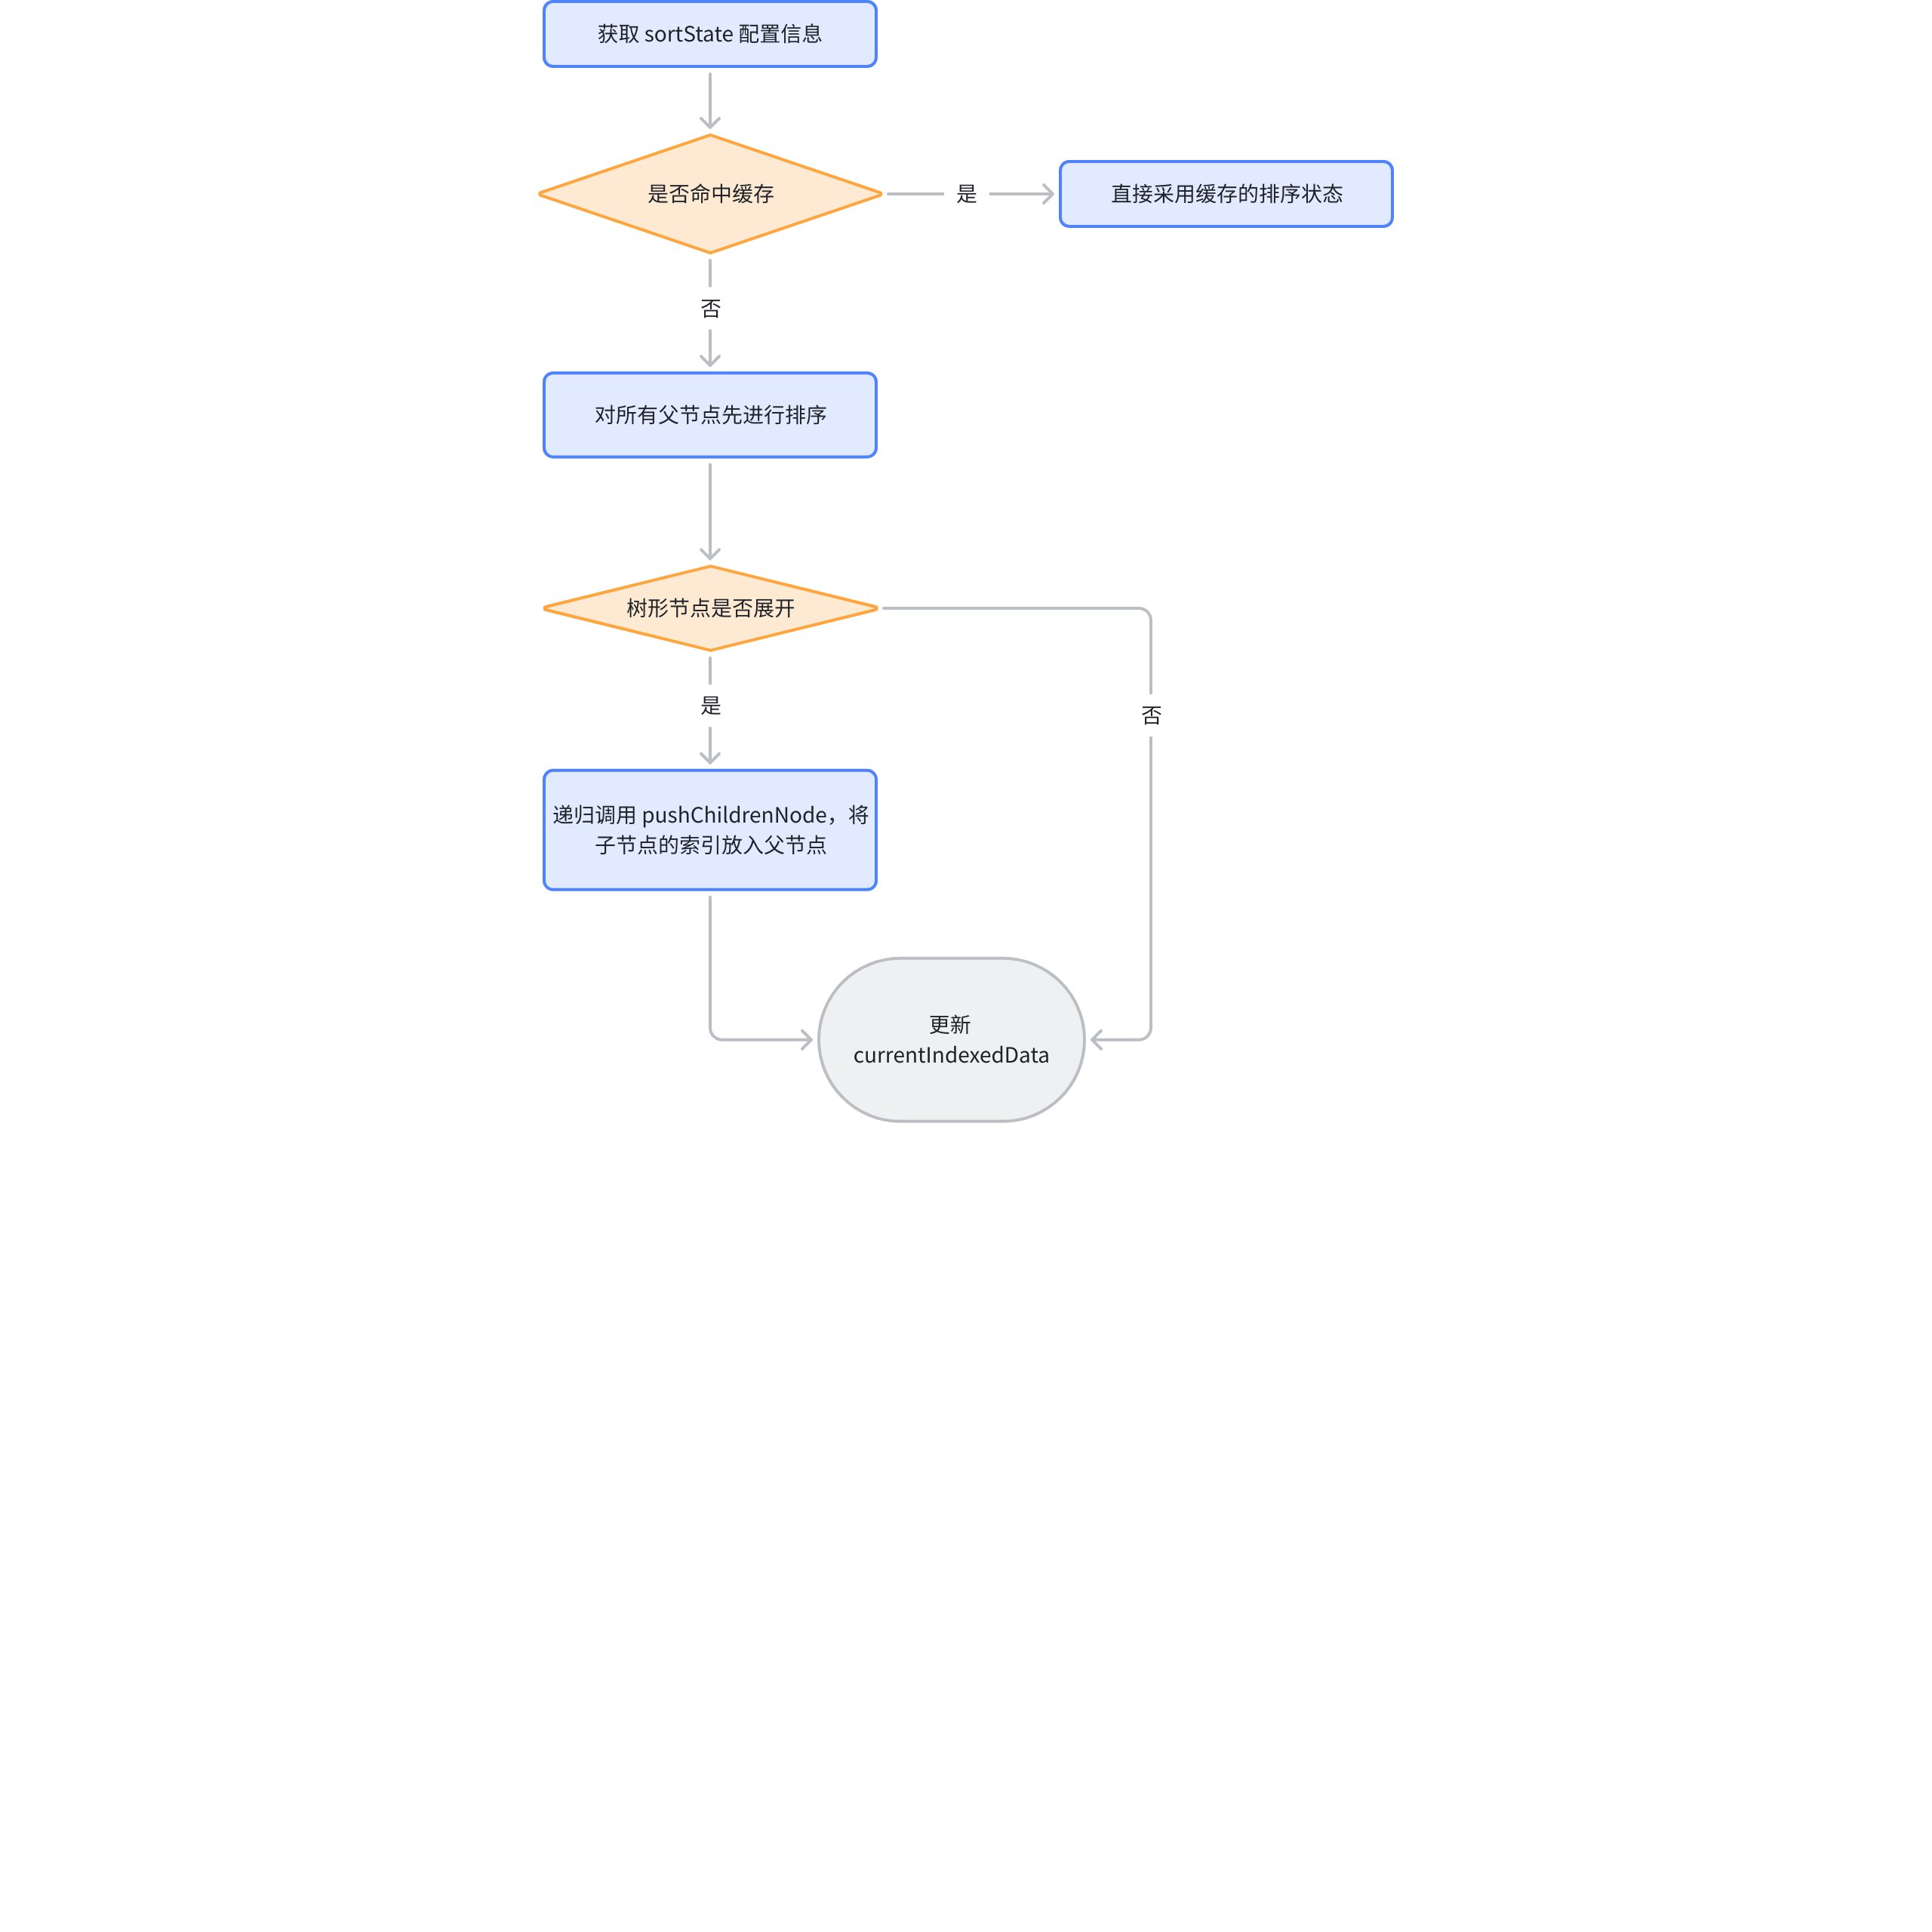
Taking sorting as an example, ListTable internally performs the following steps for the tree structure:
Get the column to be sorted, ListTable supports multi-column sorting; \r
If there is cached data from the previous sorting, use it directly (cache optimization, this cache will be cleared when the data is updated) \r
Traverse all the columns to be sorted obtained from the first step, sort the first layer of the tree structure, and adjust currentIndexedData; the sorting standard of ListTable is based on the column clicked first; \r
Traverse from top to bottom, call pushChildrenNode sequentially to sort the child nodes, and then insert the sorted data under the parent node; \r
Recursively call pushChildrenNode to continuously sort the child nodes; \r
Here is the currentIndexedDatra after clicking the category for ascending order, you can clearly see the corresponding change, Furniture is placed before Technology:
Event Binding: By binding the ICON_CLICK event, when clicking the expand/collapse icon, call table.toggleHierarchyState to adjust the table, while maintaining currentIndexedData, and report the corresponding event and parameters to the user through a callback.
Table rendering: Layout according to table column definitions
When rendering nodes, determine the expand/collapse state and adjust the node's icon accordingly; use the expand/collapse state (hierarchyState) to determine the node's icon. Note that the root node's hierarchyState is NONE, so there is no icon;
Adjust the indentation value of the cells and the calculation method of the column width according to the level; \r
Asynchronous Loading: When dealing with large data volumes, set children to true to enable asynchronous rendering. Listen to the expand and collapse events of the tree structure and manually call setRecordChildren to insert data. \r
Calculation of Indentation
Regarding the indentation of tree structures, it affects two parts: one is the calculation logic of indentation within the cell, and the other is the calculation of the cell's automatic width.
Calculate column width
In the core logic of calculating column width, there is a section of code specifically for handling indentation. \r
In the process of creating a text cell (createTextCellGroup), there is an internal call to a method getHierarchyOffset.
It involves the calculation of the indentation offset value (cellHierarchyIndent), with the formula cellHierarchyIndent = current indentation level * hierarchyIndent + width of the expand/collapse icon. This formula can be used to derive the indentation offset, thereby positioning the text during cell generation and adjusting the offset value in the x direction.
State Transition
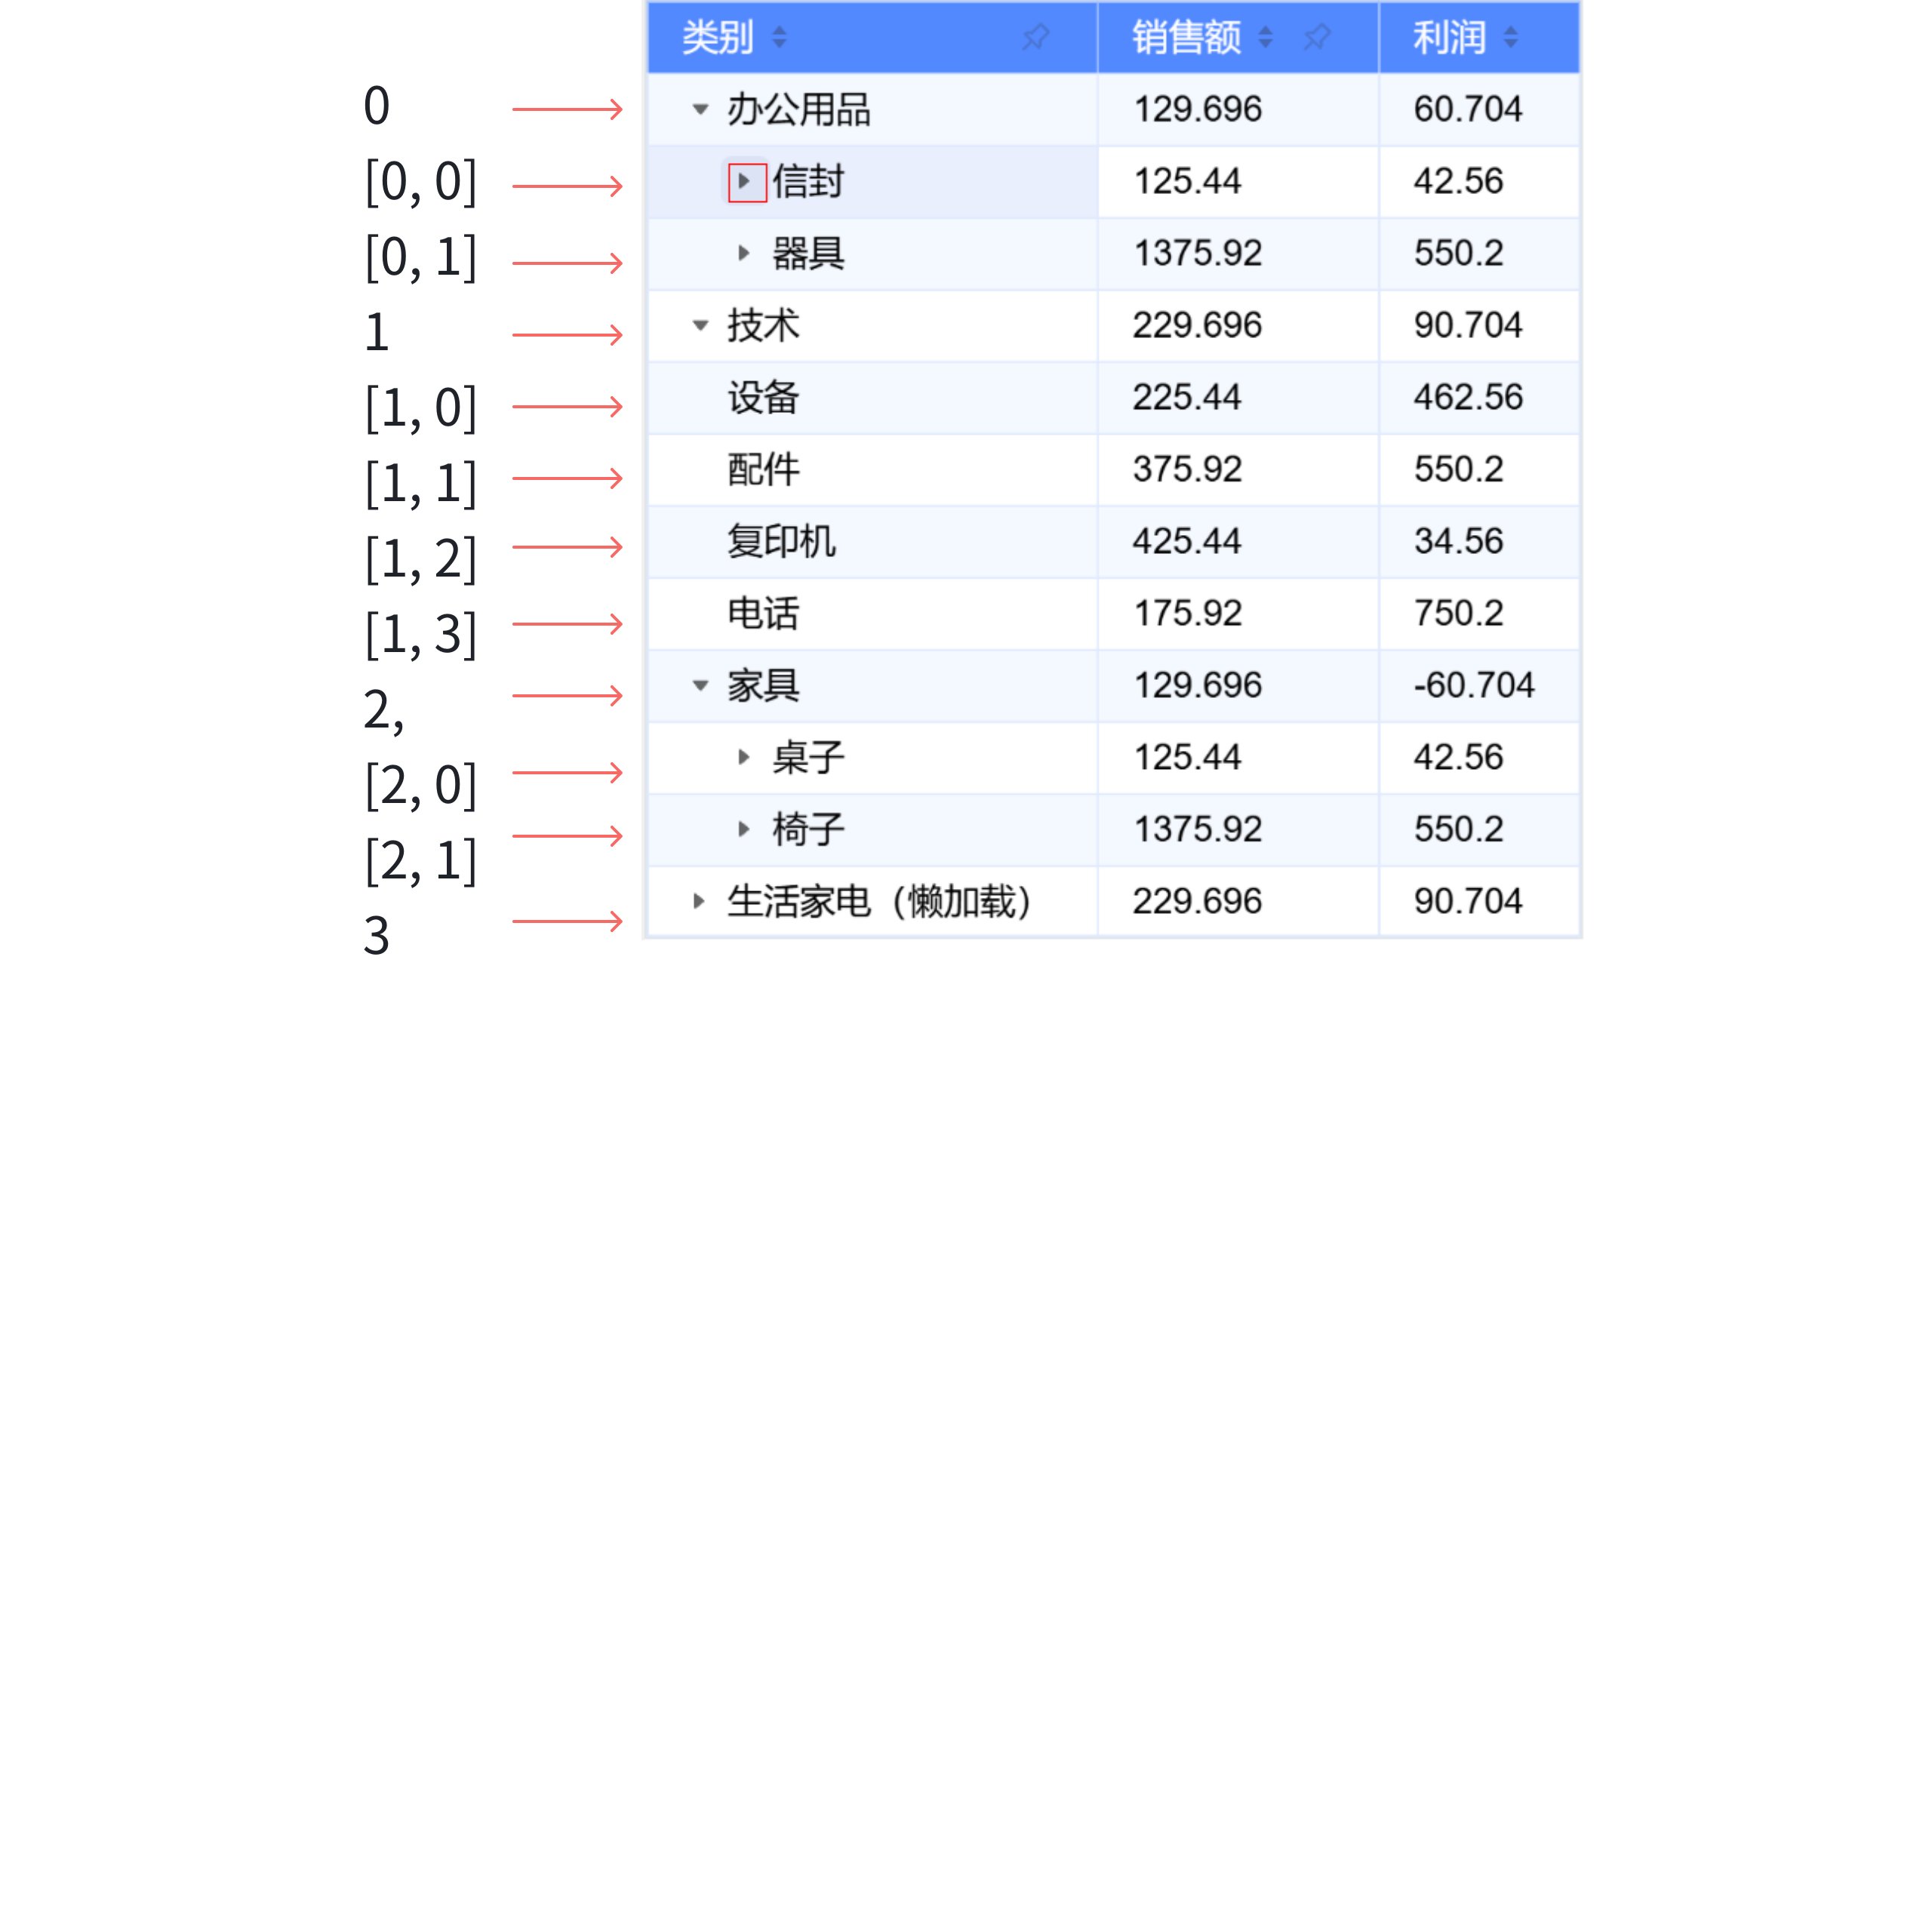
As mentioned earlier, the basic table internally manages data through currentIndexedData. Let's first look at what changes occur when a node is expanded using currentIndexedData: \r
Click envelope before
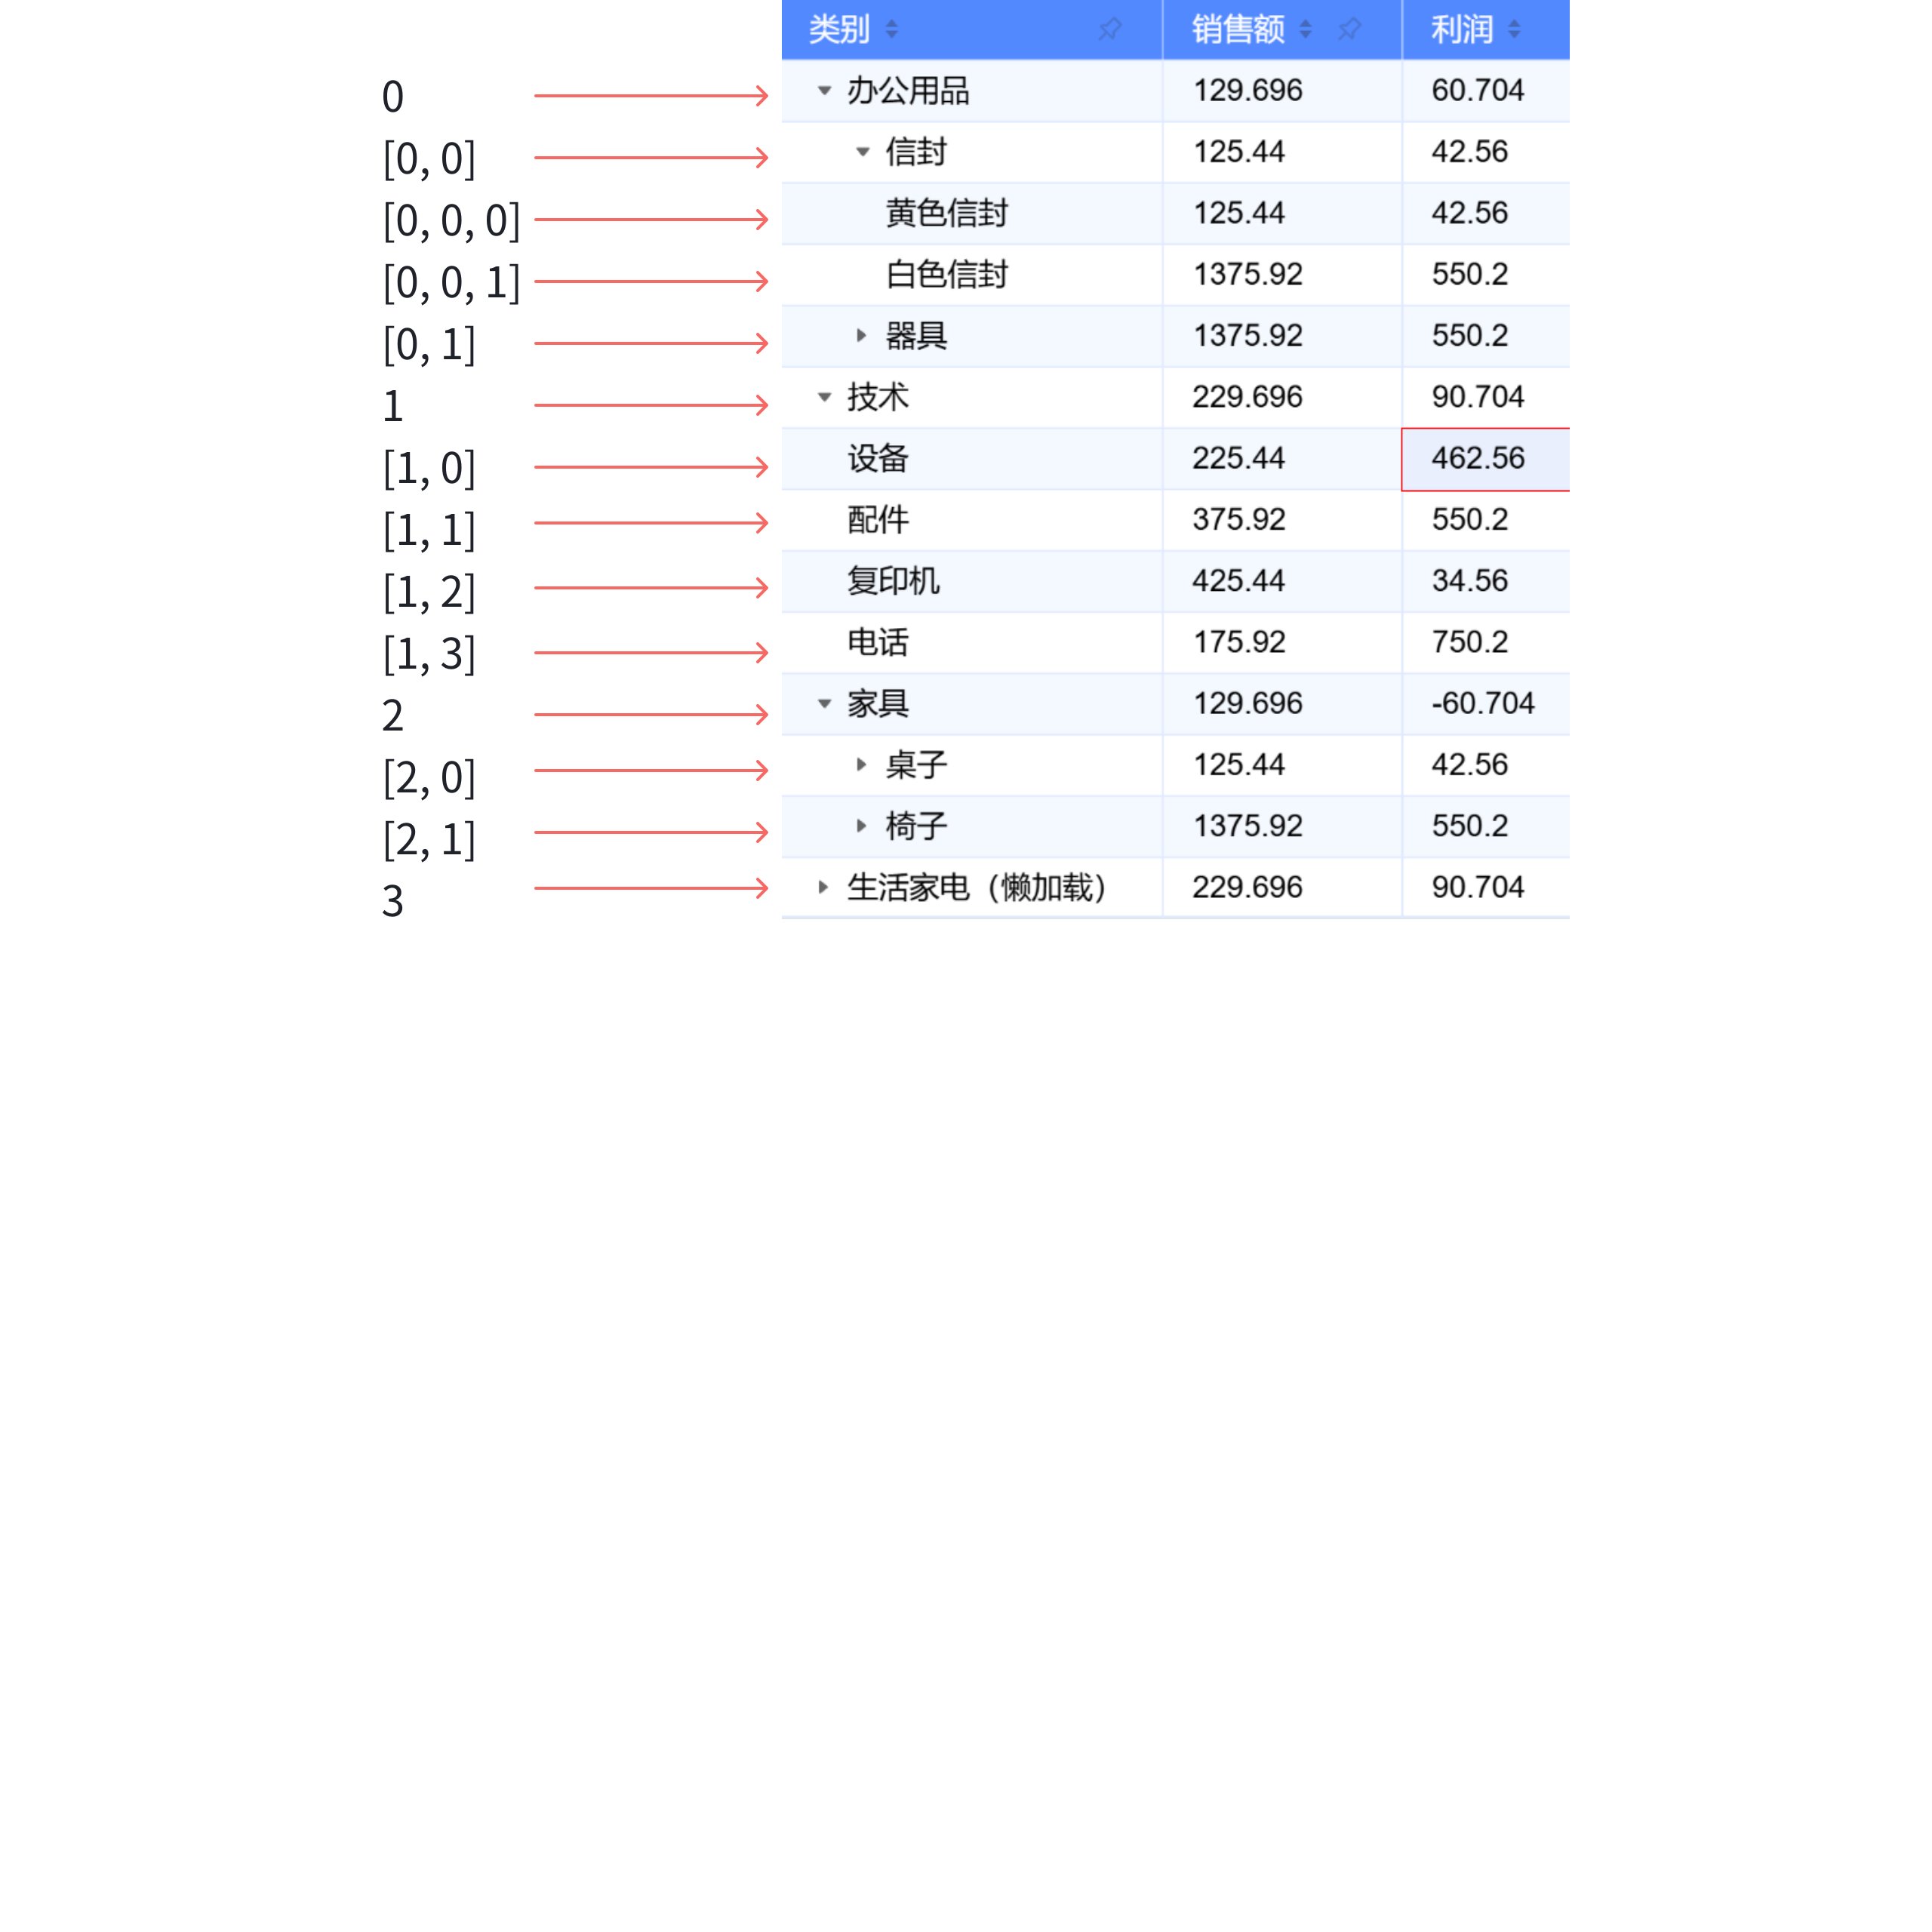
Click 信封 after
It is clearly seen that two lines of data, [0,0,0] and [0,0,1], are inserted under the envelope; they represent the yellow envelope and white envelope respectively.
Observe again the output of getCellValue when clicking the envelope to expand: \r
What can be seen is that all cells below the envelope were updated first, and then other column containers for envelope children were created.
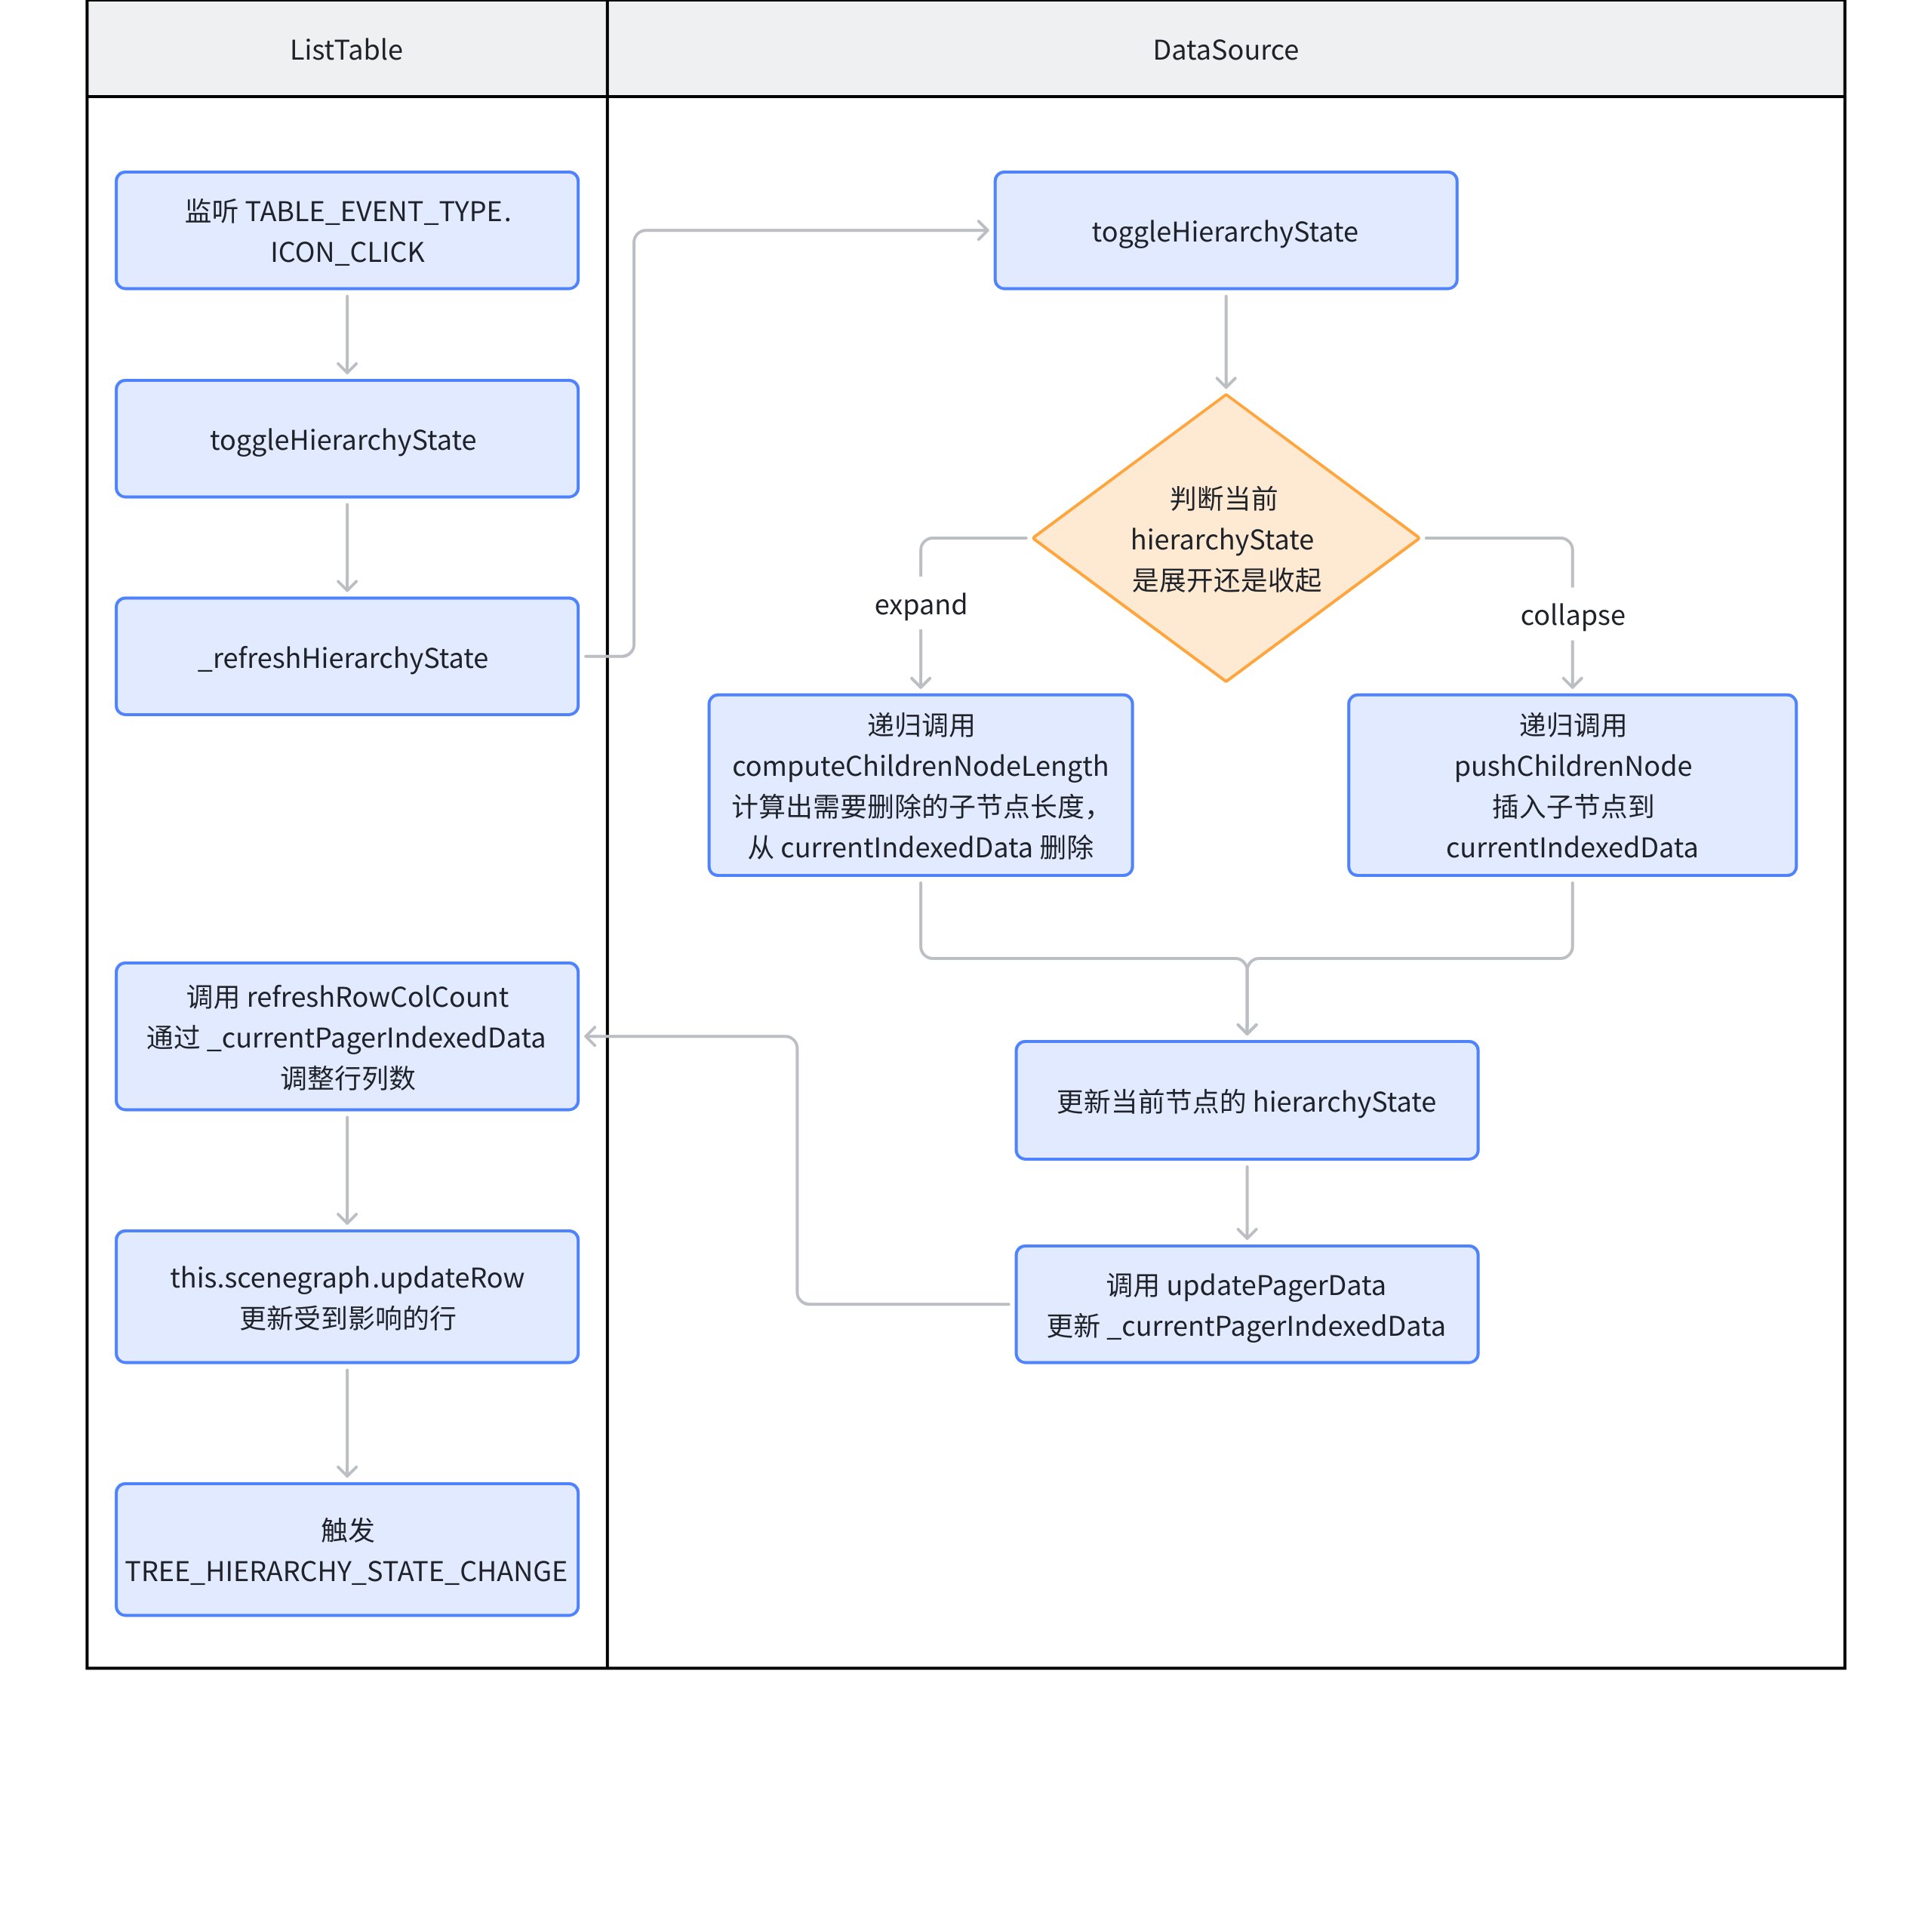
For the expansion toggle of nodes, it can be abstracted into the following steps:
Parent node icon toggle: Adjust the hierarchyState of nodeData to change the expand/collapse icon; \r
Insertion and deletion of child nodes:
When expanding, recursively call pushChildrenNode to insert child nodes and update currentIndexedData;
When deleting, recursively call computeChildrenNodeLength to calculate the number of affected lines, and directly delete currentIndexedData;
Data Update: Update _currentPagerIndexedData through currentIndexedData; \r
Update the number of rows and columns: Adjust the number of rows and columns through _currentPagerIndexedData; \r
Update the scene tree: Call scenegraph.updateRow to update the scene tree;
Trigger the callback TREE_HIERARCHY_STATE_CHANGE passed in by the business party;
Grouping
Scenario Analysis
Basic table grouping display function is applicable to various scenarios, for example: \r
Financial statements: Can be grouped and displayed according to different account types (such as income, expenses, assets, liabilities) to help better understand the financial situation. \r
Sales data analysis: It can be grouped by product category, region, salesperson, etc., making it easy to compare and analyze the sales performance of different categories or regions. \r
The expansion and collapse of tree structures have been discussed earlier. In the grouping section, we will focus on the data processing part.
Internal Data Processing
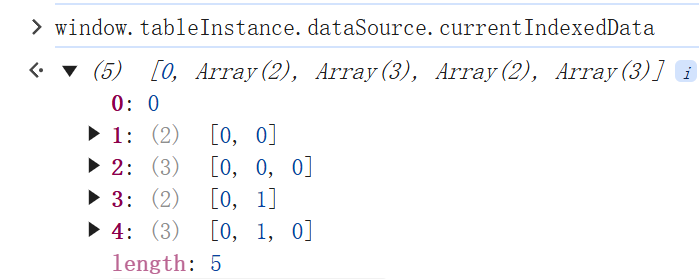
Let's observe the currentIndexedData in the example above. It is obvious that it has five rows, but only two rows were passed in during initialization in records. It is easy to see that ListTable internally inserted three rows for us, which represent the group headers generated internally by ListTable. \r
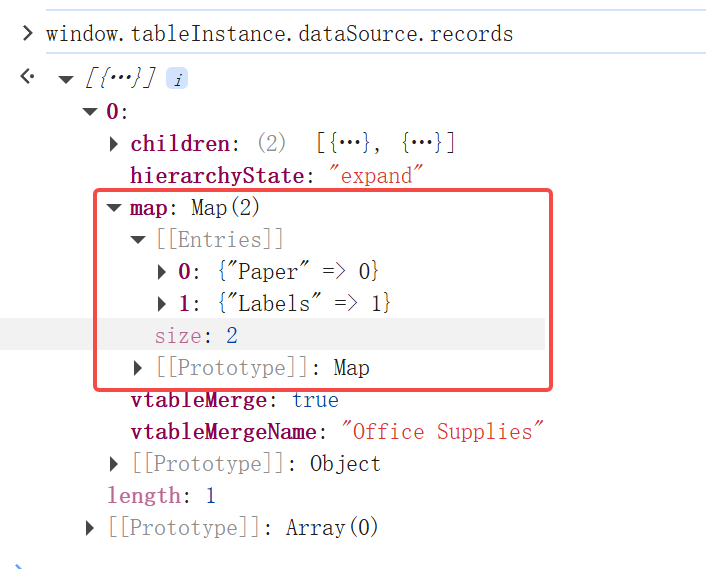
currentIndexedData has changed, indicating that records have definitely been adjusted. Let's take another look at tableInstance.dataSource.records, which is clearly quite different from the original records passed in.
The ListTable converts the original two-dimensional array structure into a tree structure and automatically groups it.
record - The data record currently being processed; \r
children - The array of child nodes at the current level. Before processing all records, a top-level groupResult is generated as children, and subsequently, child elements are inserted recursively; \r
map - The mapping table of the next level group value and corresponding index in the group node children of the current group node; a separate one is maintained at each level of the group node, and when the same group value is encountered later, it will be directly inserted at the same index; \r
groupByKeys - Array of grouping fields, groupBy passed in option; \r
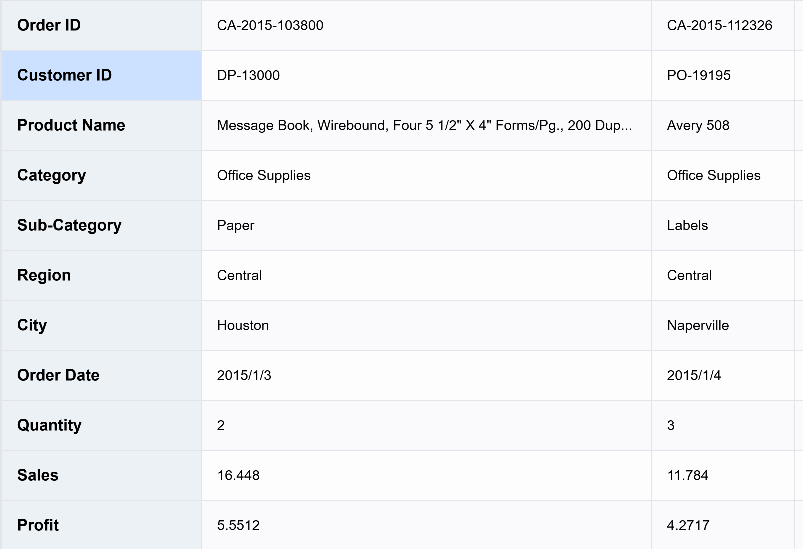
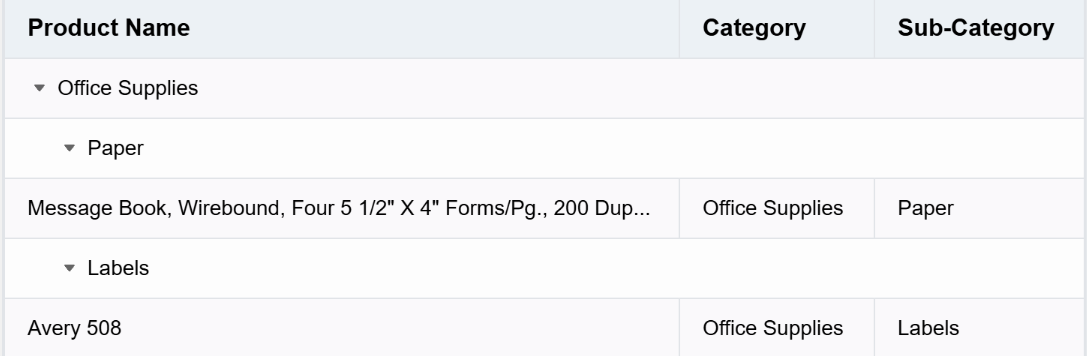
vtableMergeName: The grouping value corresponding to the current record, for example, such a piece of data \r
{
Category: 'Office Supplies',
'Sub-Category': 'Paper',
'Product Name': 'Message Book, Wirebound, Four 5 1/2" X 4" Forms/Pg., 200 Dupl. Sets/Book'}
If the groupKey corresponding to the current level is Category, then for the grouping node at this level, the vtableMergeName is Office Supplies
vtableMerge: Due to grouping, for group headers, it is always assumed that the entire row needs to be merged; \r
children: The children corresponding to the current group, as there may be multiple groups, it is a tree structure; \r
map: A mapping table of the group values and their corresponding indices in the children under the current group node, ensuring that the same subgroup can be quickly inserted into the correct position when encountered next time. \r
Taking the grouping in the example above as an example, the outermost Map looks like this. This means that if data from the Office Supplies -> Paper group is encountered later, it can be directly inserted into children[0].
Before traversing the records, an outermost groupMap and groupResult are generated. The groupResult serves as the first layer of the tree structure. Due to address referencing, all subsequent record insertions will be inserted into the groupResult. After traversing each data entry and completing dealWithGroup, the groupResult is returned as the final records. \r
dealWithGroup Recursive Process
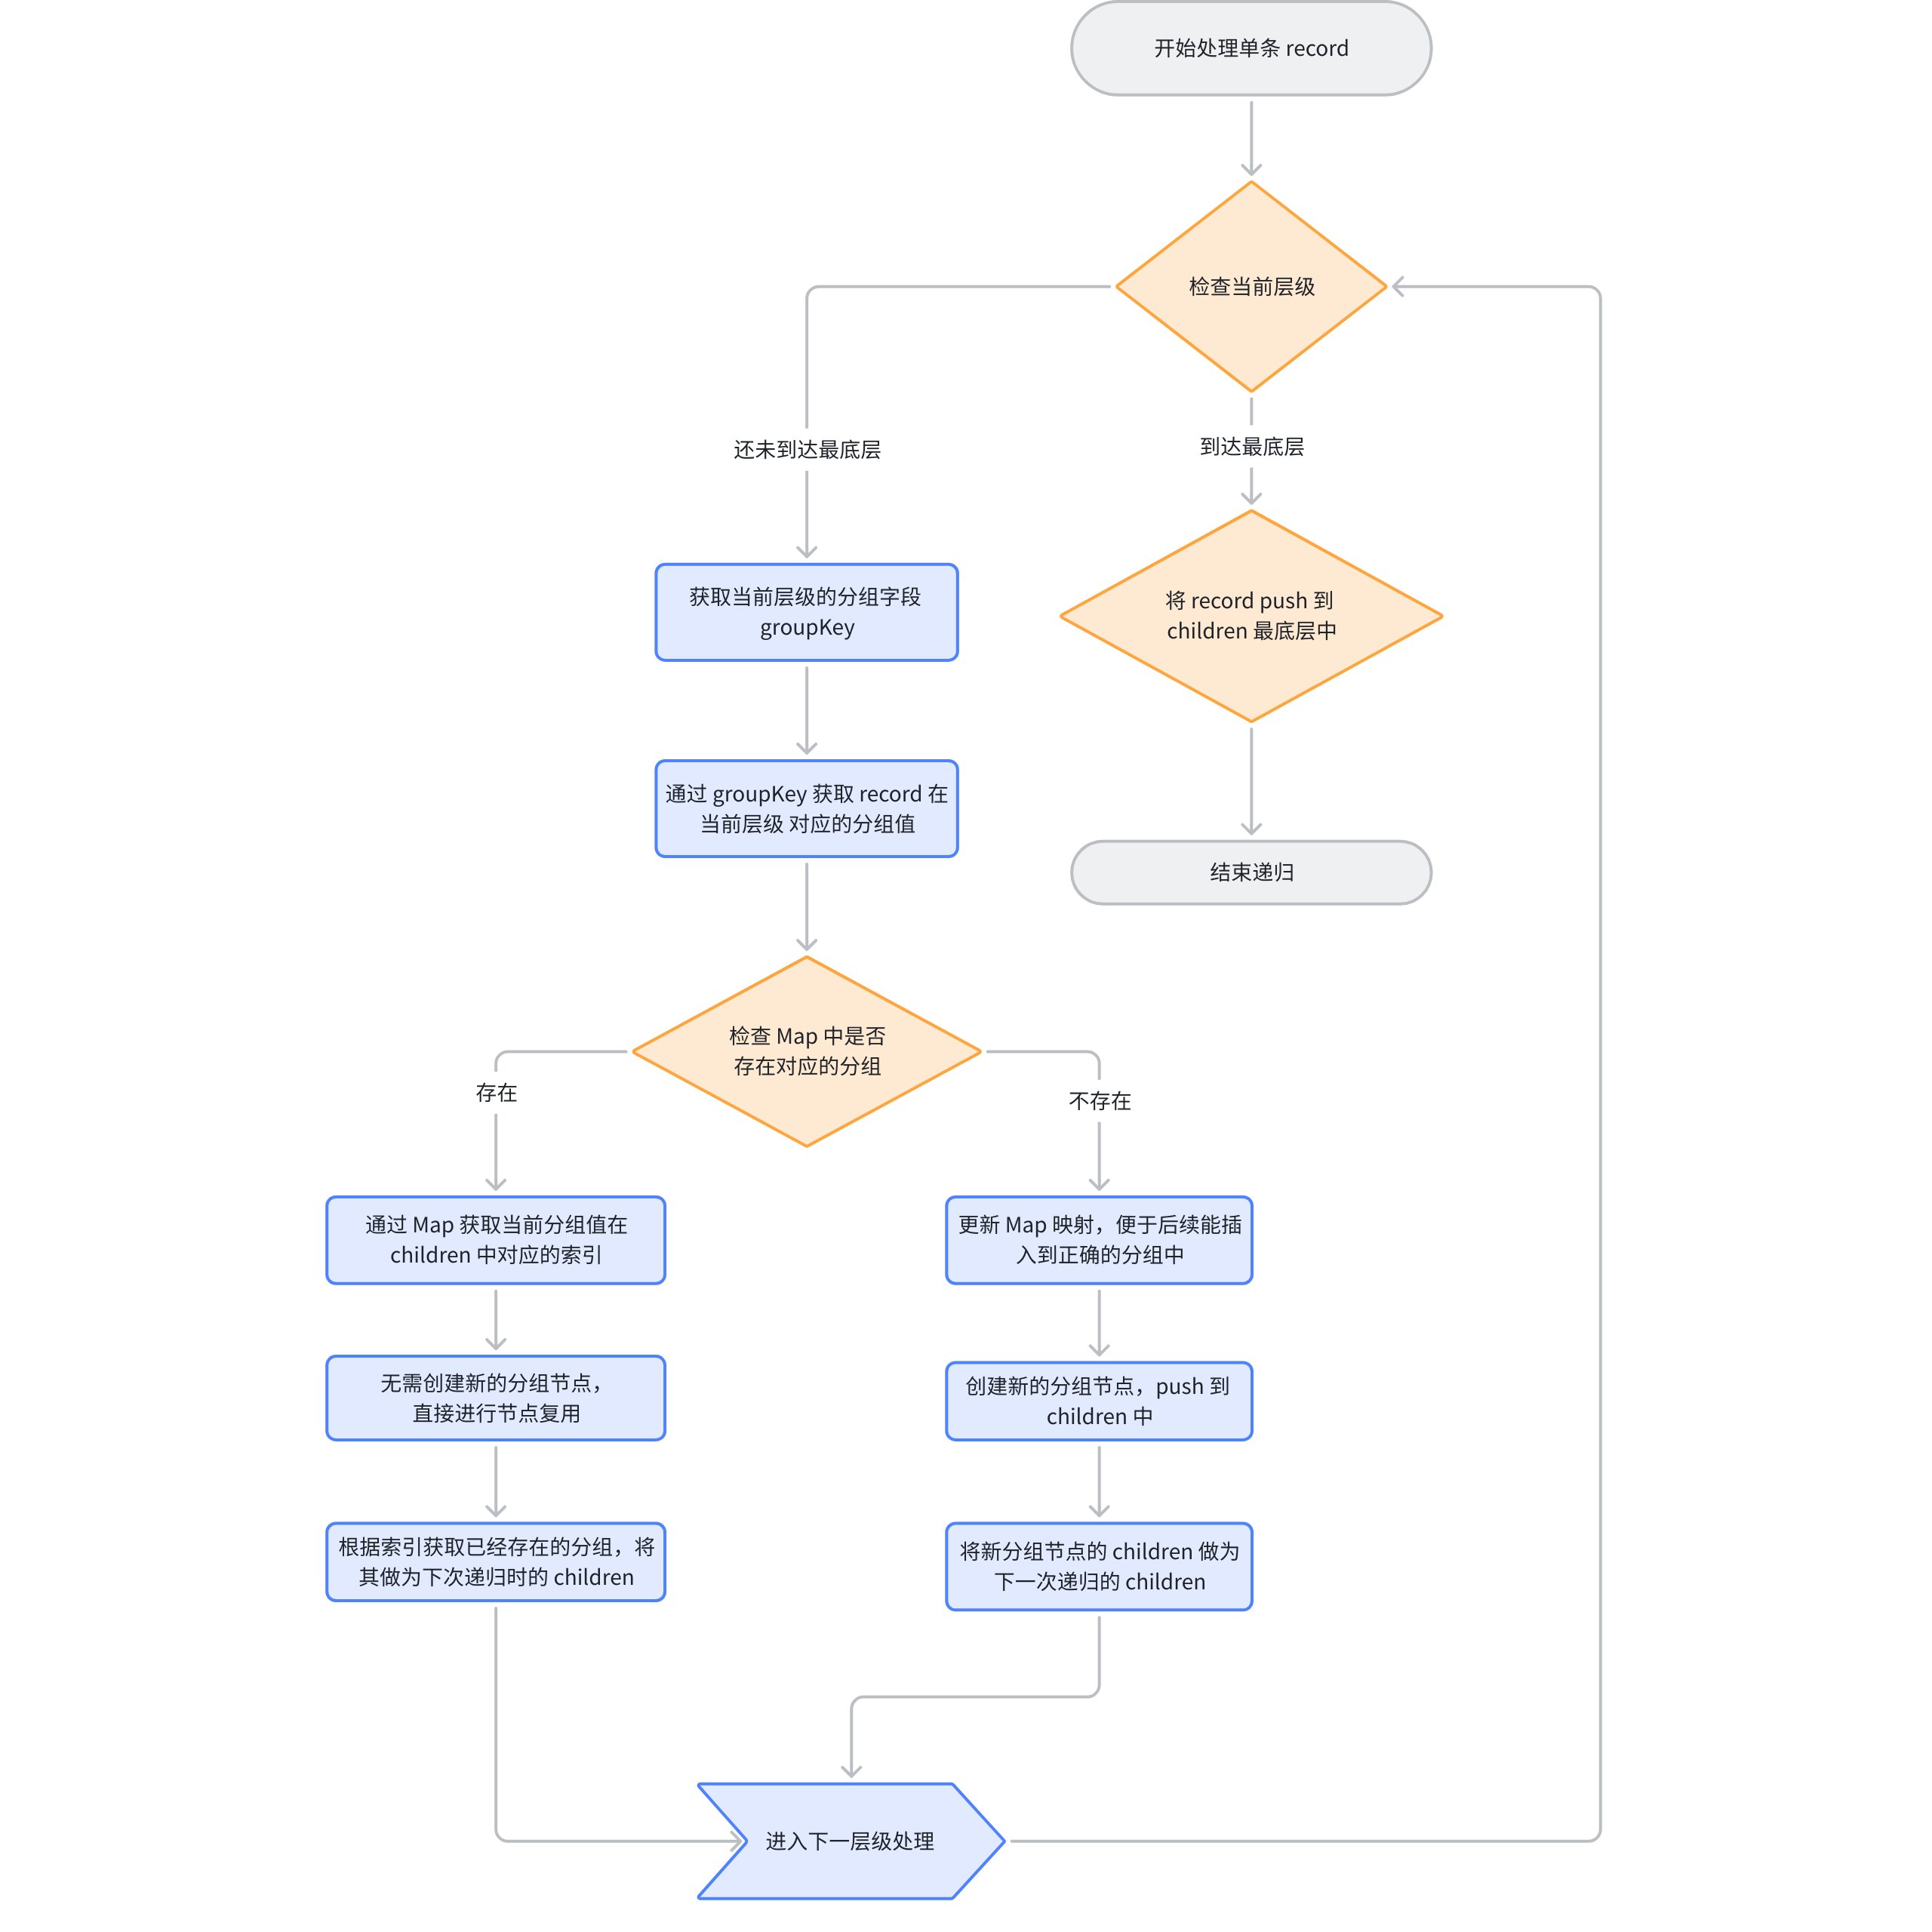
First, obtain the current groupKey and determine whether it has reached the last level. If it is the last level, directly insert it into children, indicating that the recursion is complete:
Use map to determine whether the current value (group value) exists in the children of the previous group node (i.e., the children passed in the current closure). If it exists, it means that this group has already appeared, and the same node is reused and passed as children to the next recursive logic; \r
If the map does not exist, it means there is no corresponding group node, and a new group node needs to be created. Then update the map of the previous group node, and append the new node to the end of children of the previous group node (i.e., the children passed in the current closure). Use this newly created node as the children parameter for the next recursion, because the current record has been determined to belong to this group. Return the result after recursive processing.
At this point, the dealWithGroup for a single record has been completed. Below is the corresponding flowchart: \r
Case Study
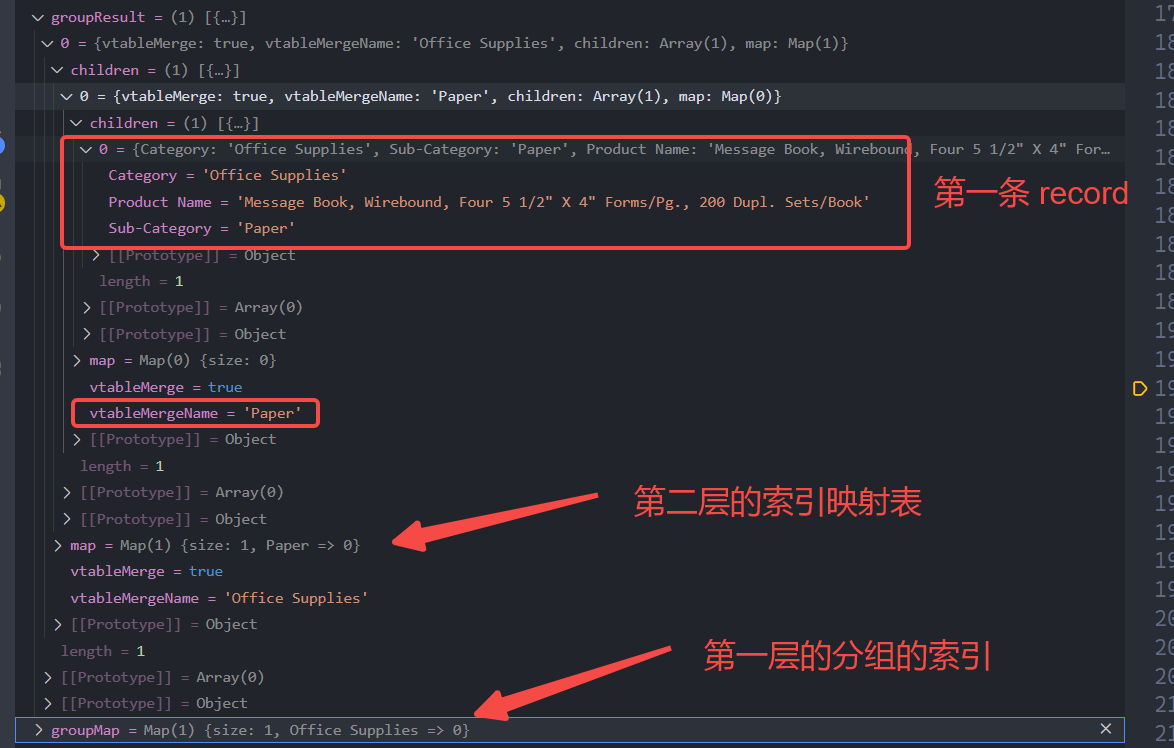
Let's take the records above as an example. After processing the first record, let's see the status of groupResult and groupMap: \r
You can see that the first record has been correctly grouped and inserted into groupResult[0].children[0], and the index corresponding to the Office Supplies group has already been stored in groupMap.
So when inserting the second record, a new group node will not be created at the first level, but at the second level Sub Category level, since there is no record of the Labels node in children[0].map, a new Paper node will be created, and the record will be placed in the children corresponding to that node.
If there is more data, it will follow this pattern. After processing all records, the final groupResult will be assigned to tableInstance.dataSource.records, completing the grouped data processing.
Since each node maintains a Map individually, the time complexity is greatly reduced during the recursion process.
Classic Interaction
As mentioned earlier, the underlying layer of VTable is based on VRender, and most interactions are implemented by listening to events provided by VRender. Let's start with a few classic interactions to see how ListTable achieves interactions comparable to native DOM by listening to events provided by VRender. \r
Drag to Adjust Column Width
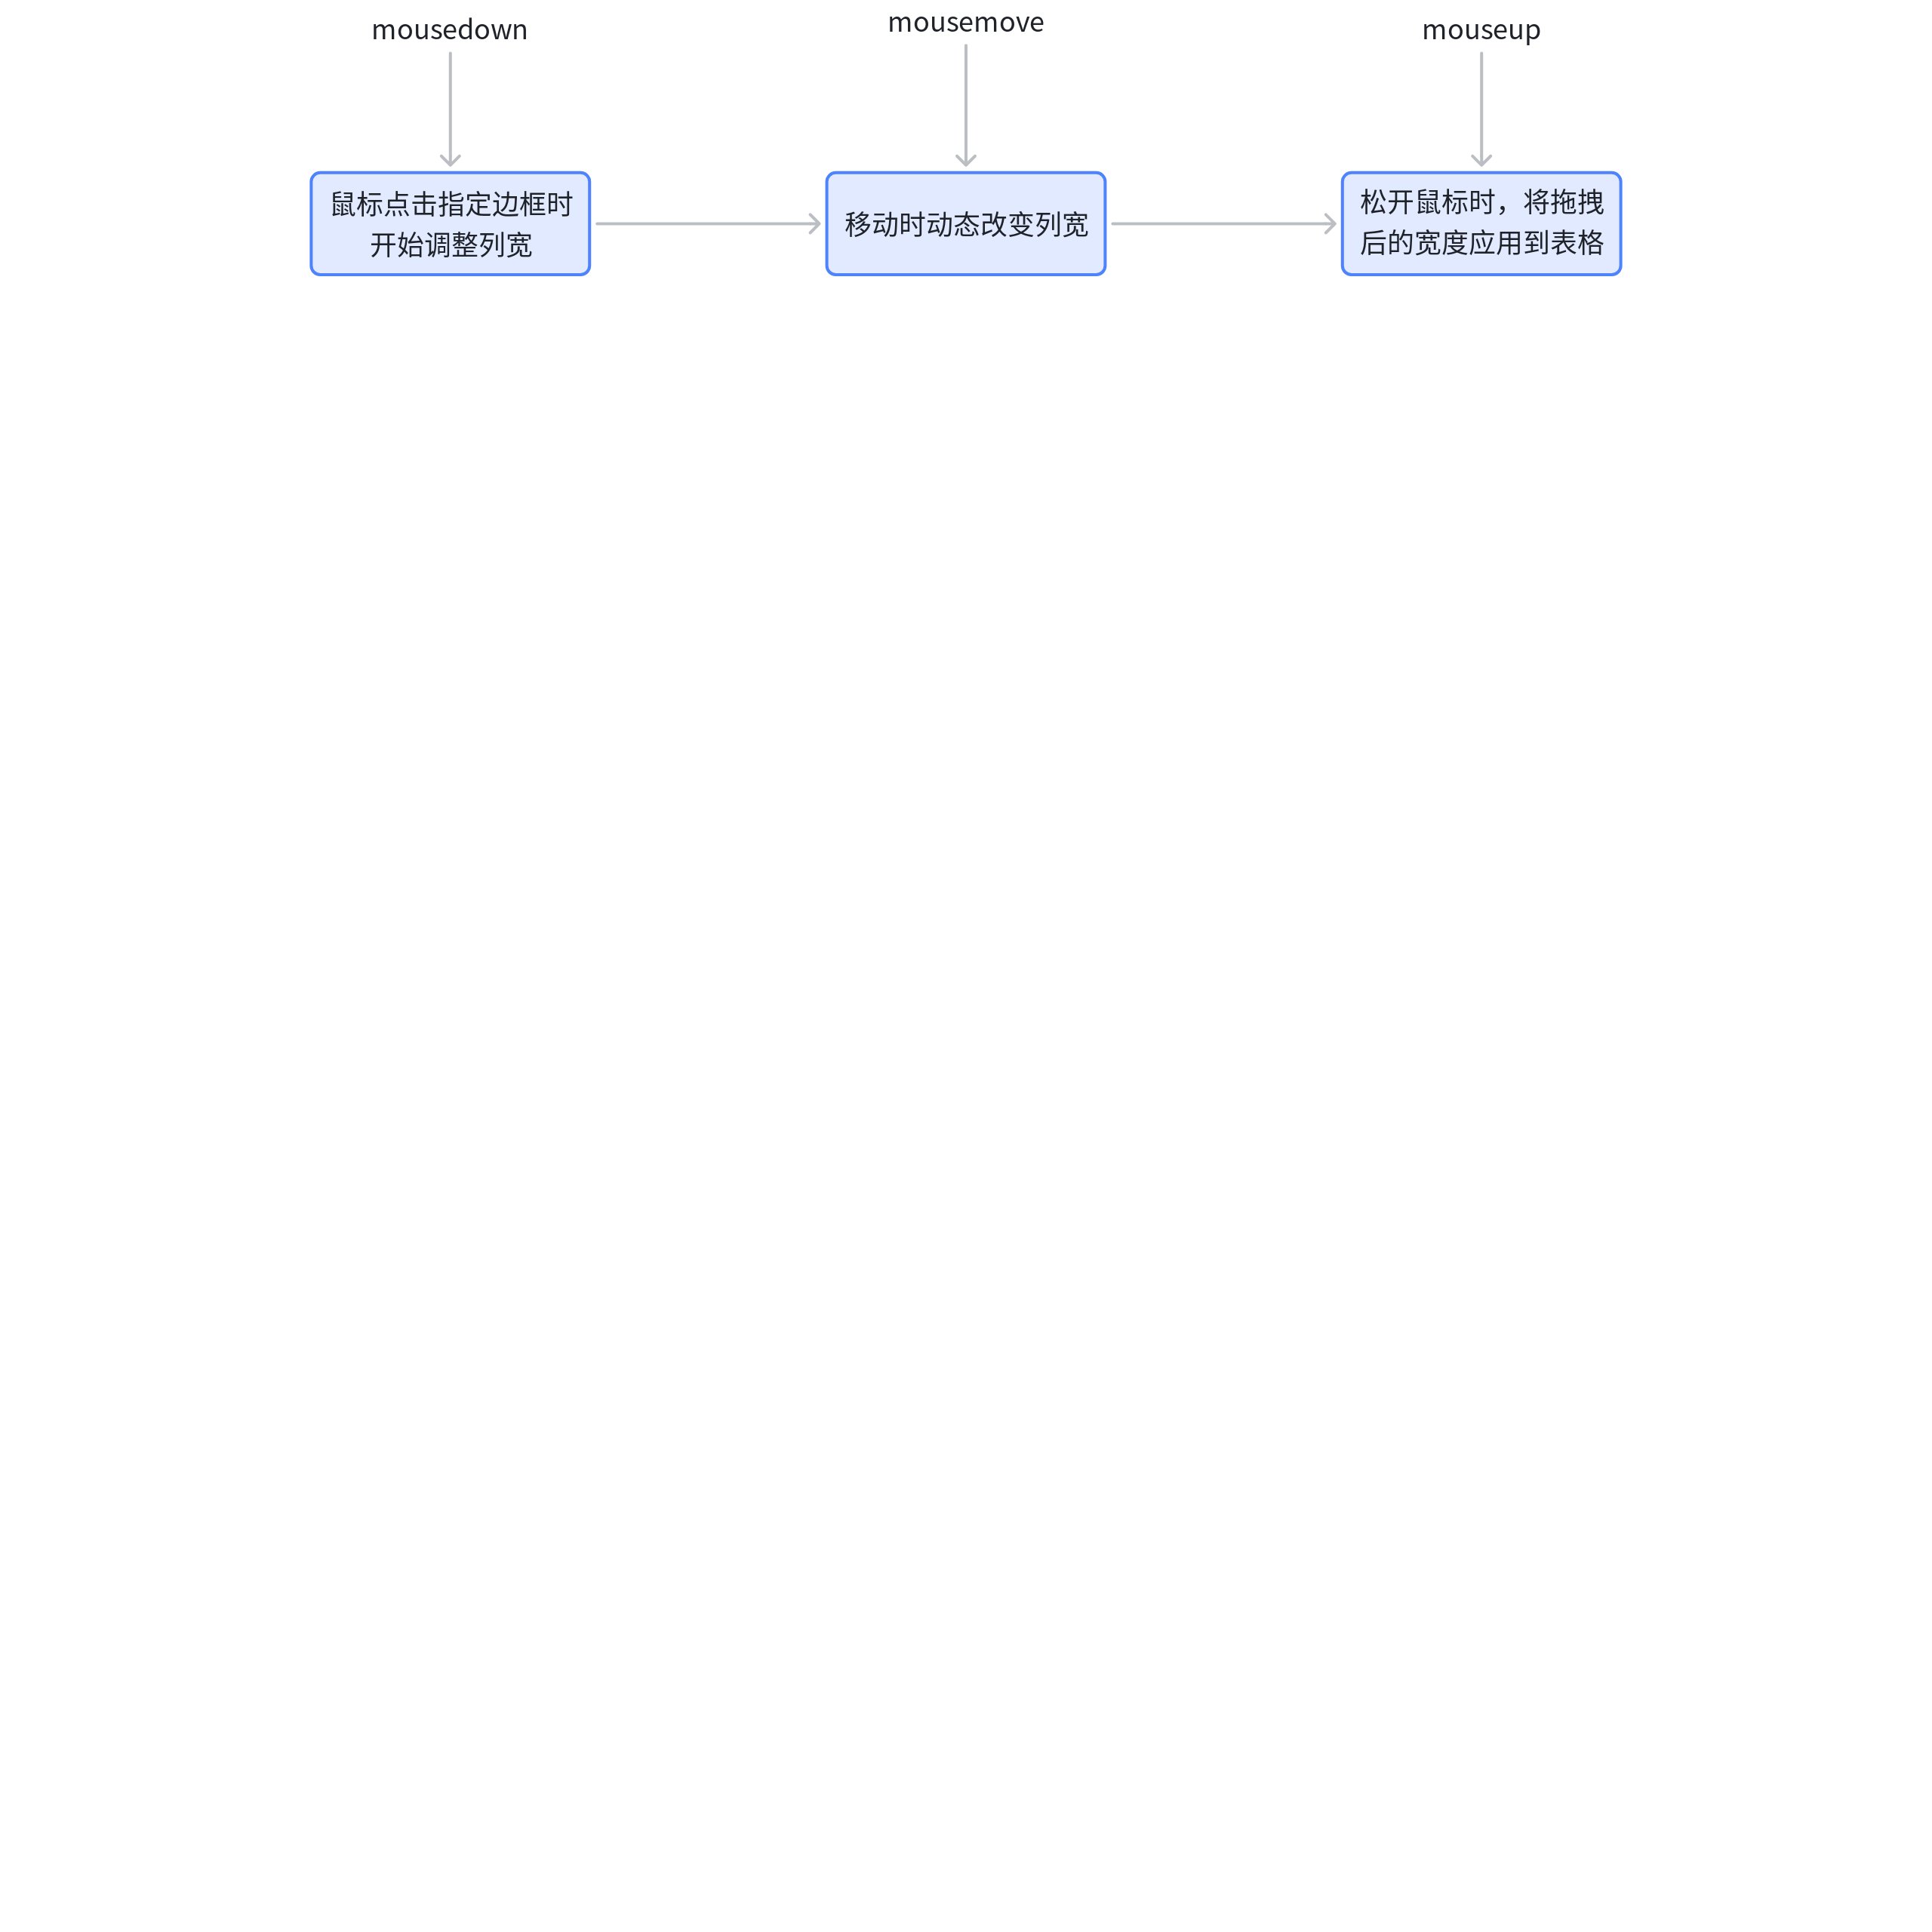
The regular way to adjust column width mainly involves listening to three events: \r
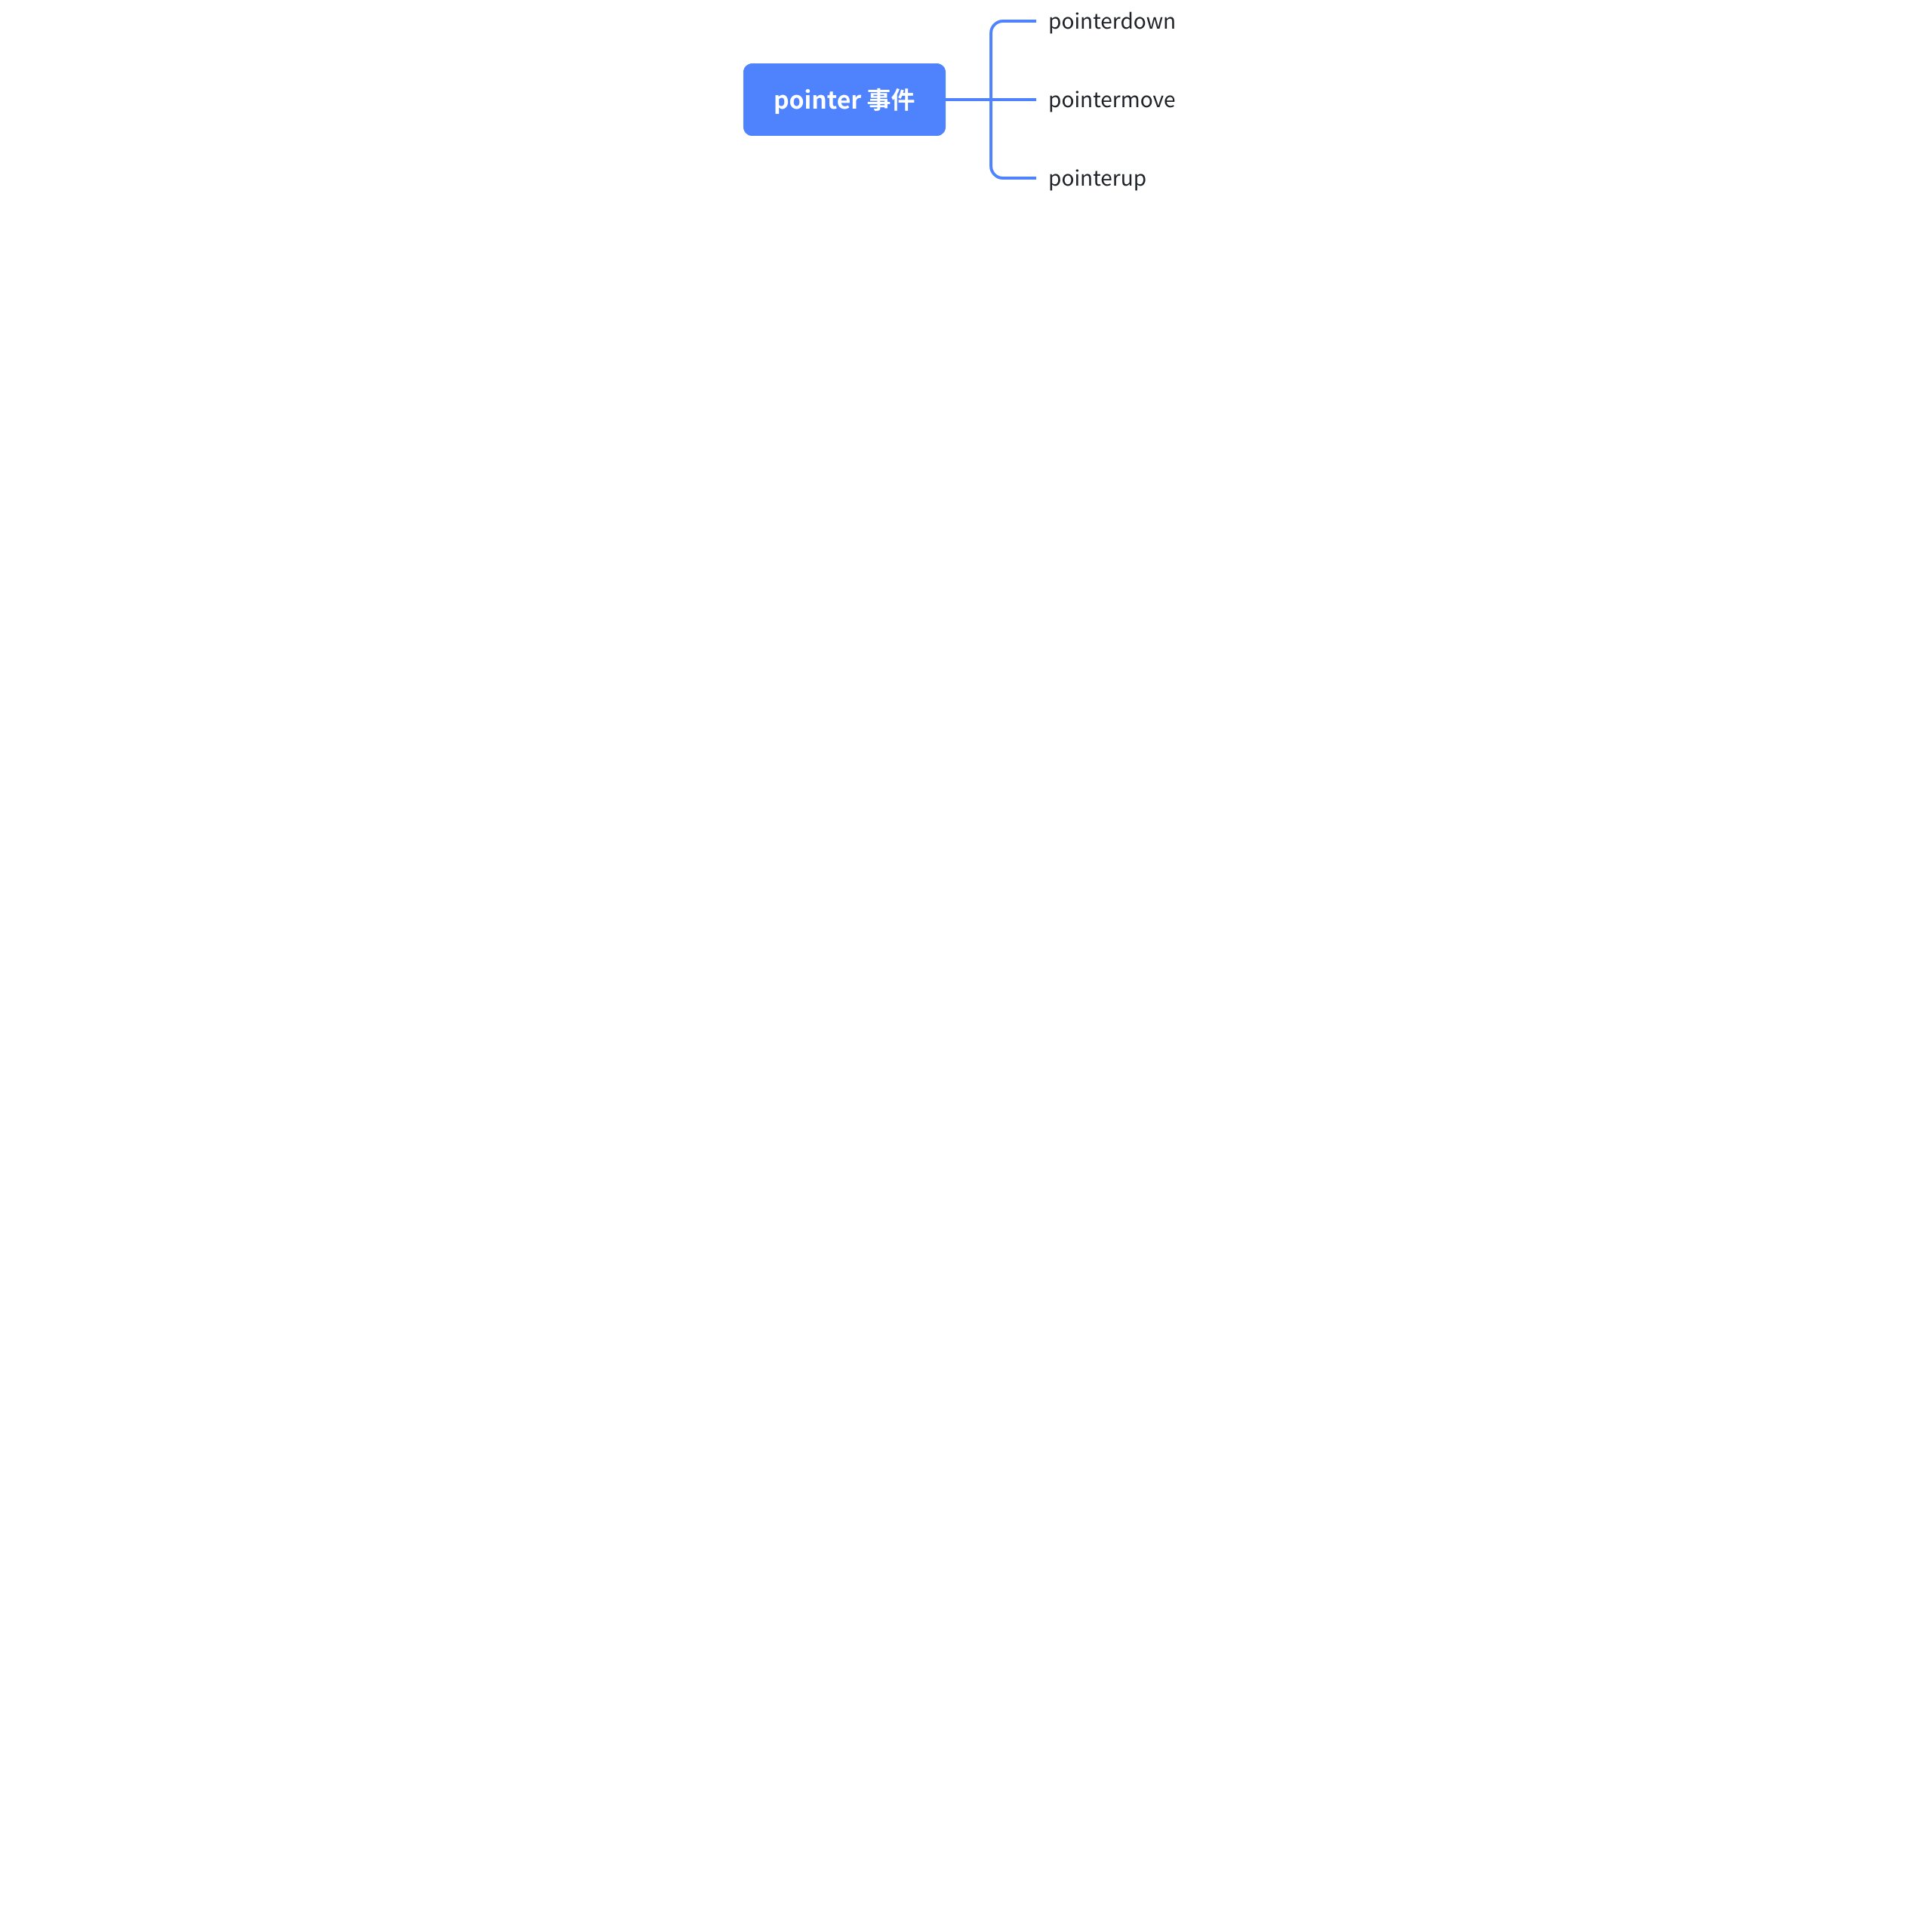
However, in the VTable, adjusting the column width mainly relies on pointer events:
The main reason for using pointer events is that pointer not only supports mouse events but also supports all pointer devices such as stylus and touch screens, providing better compatibility.
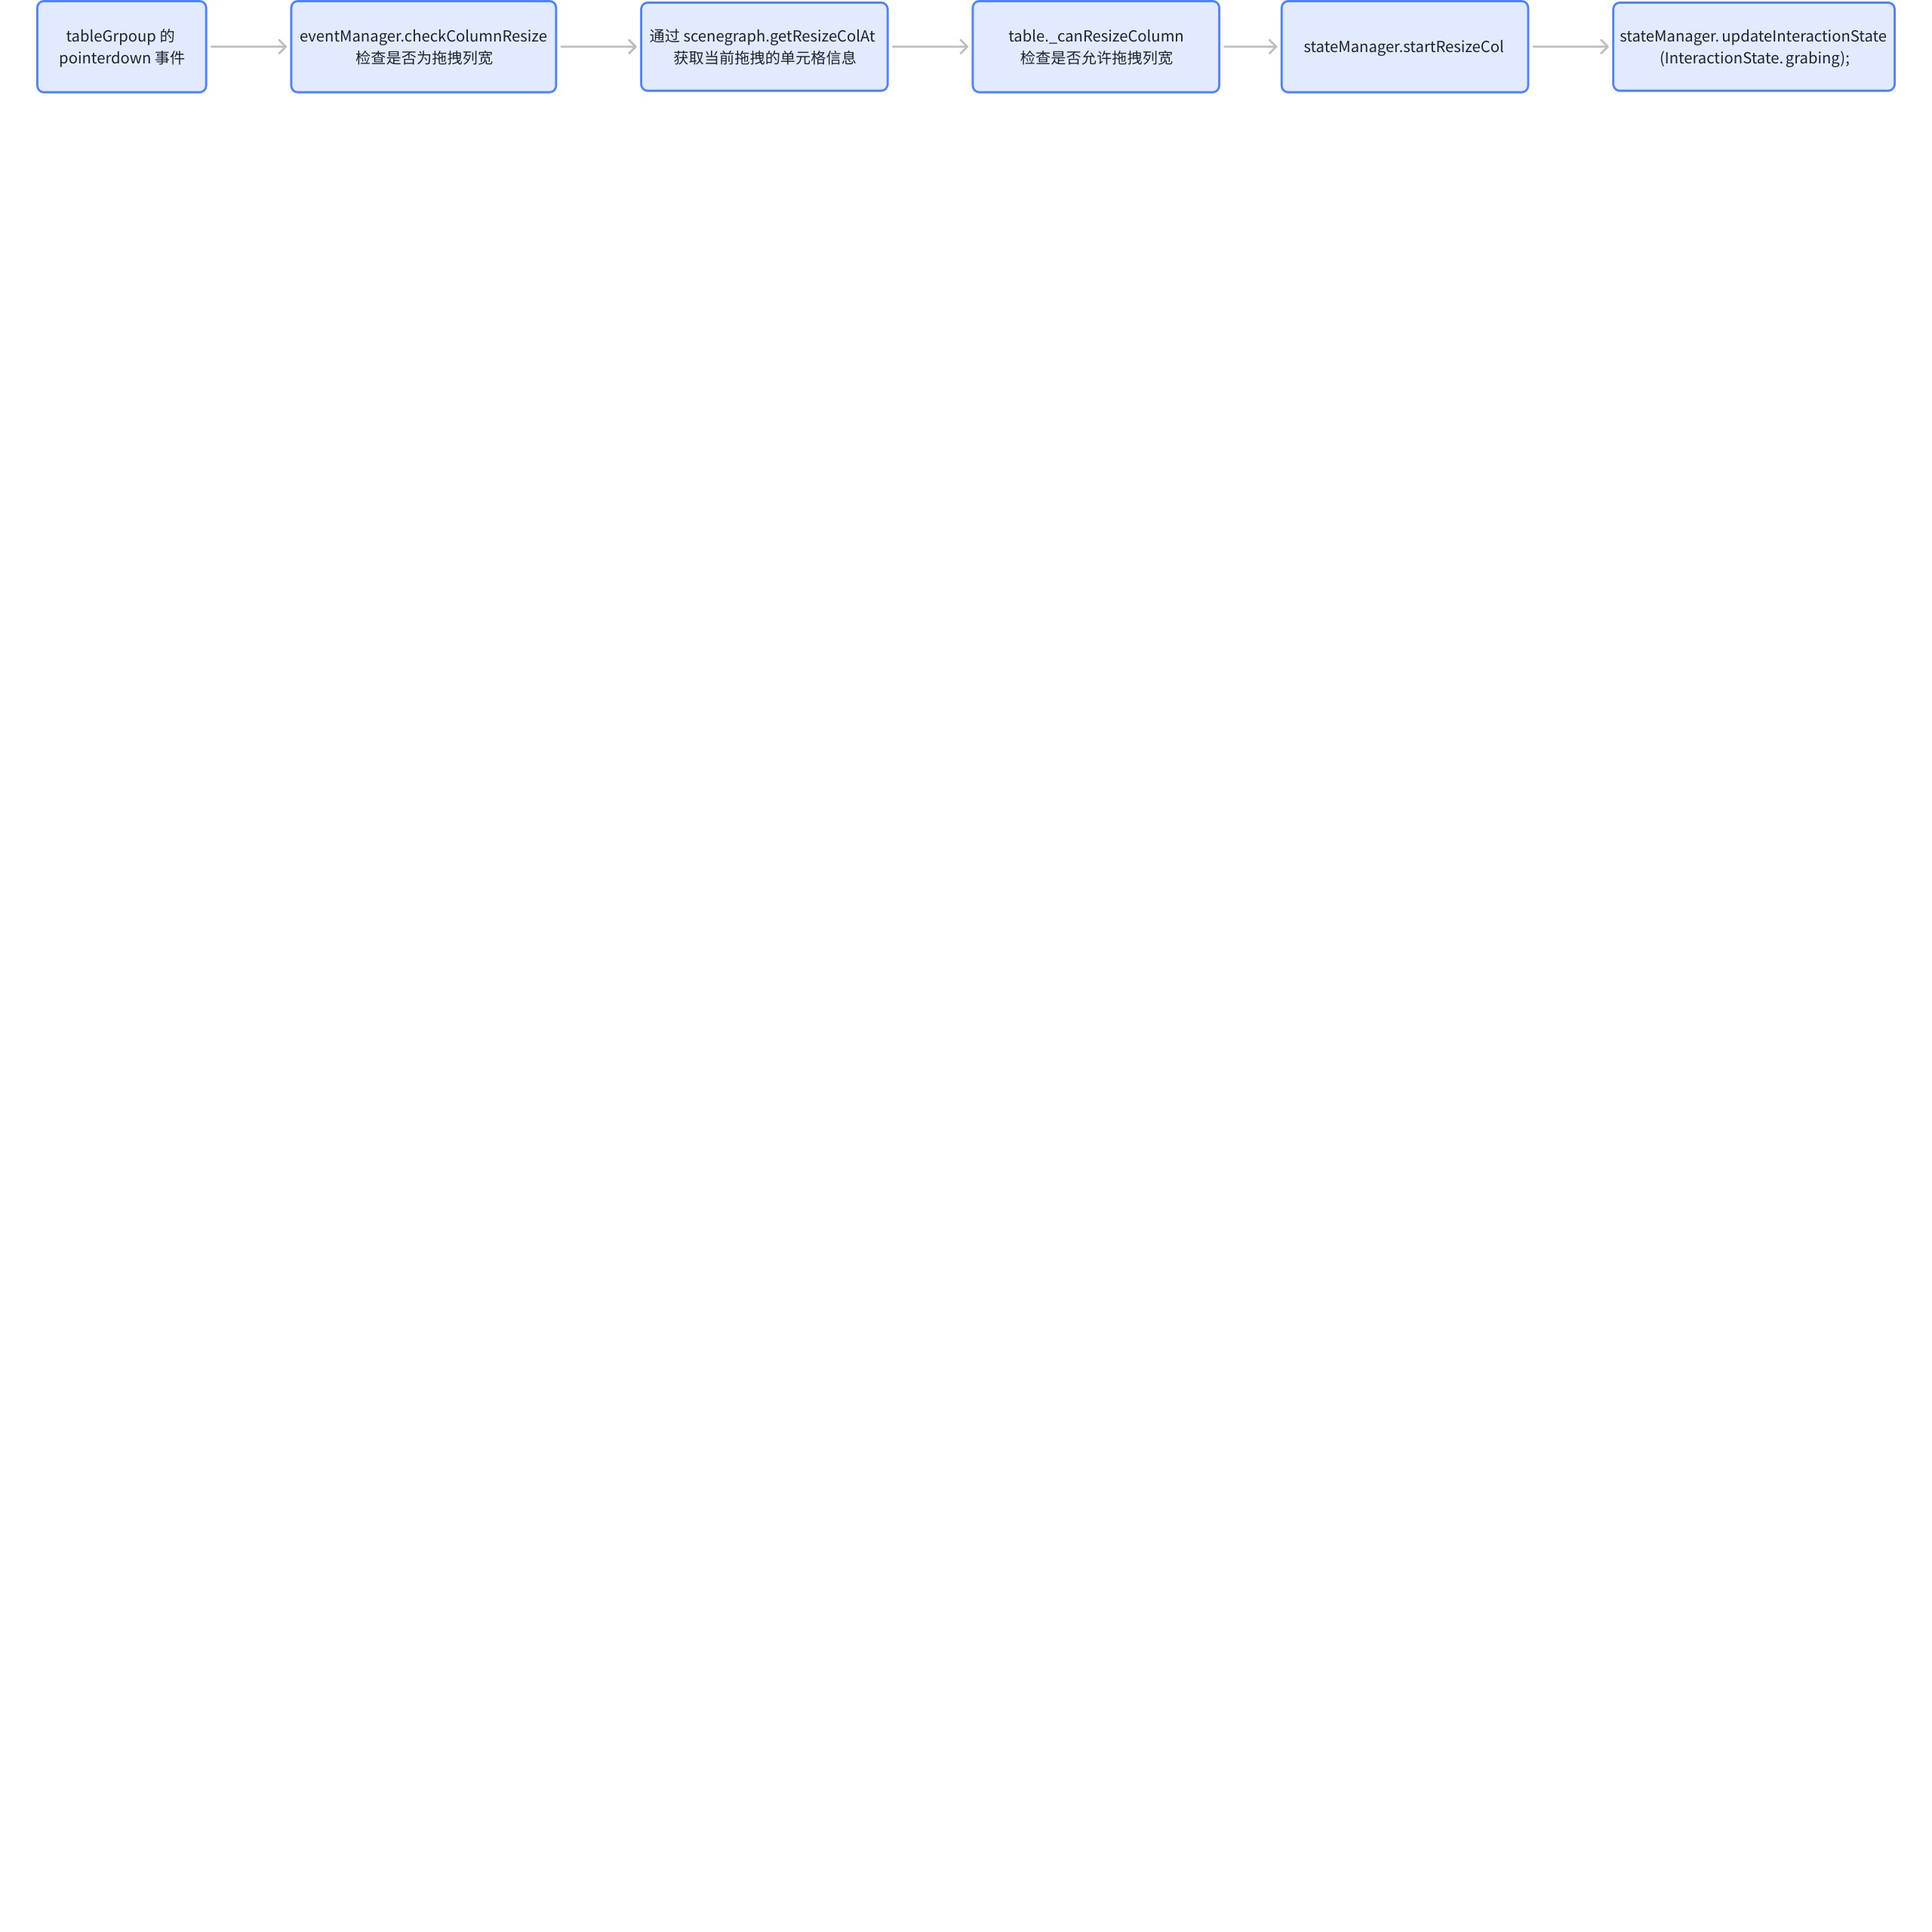
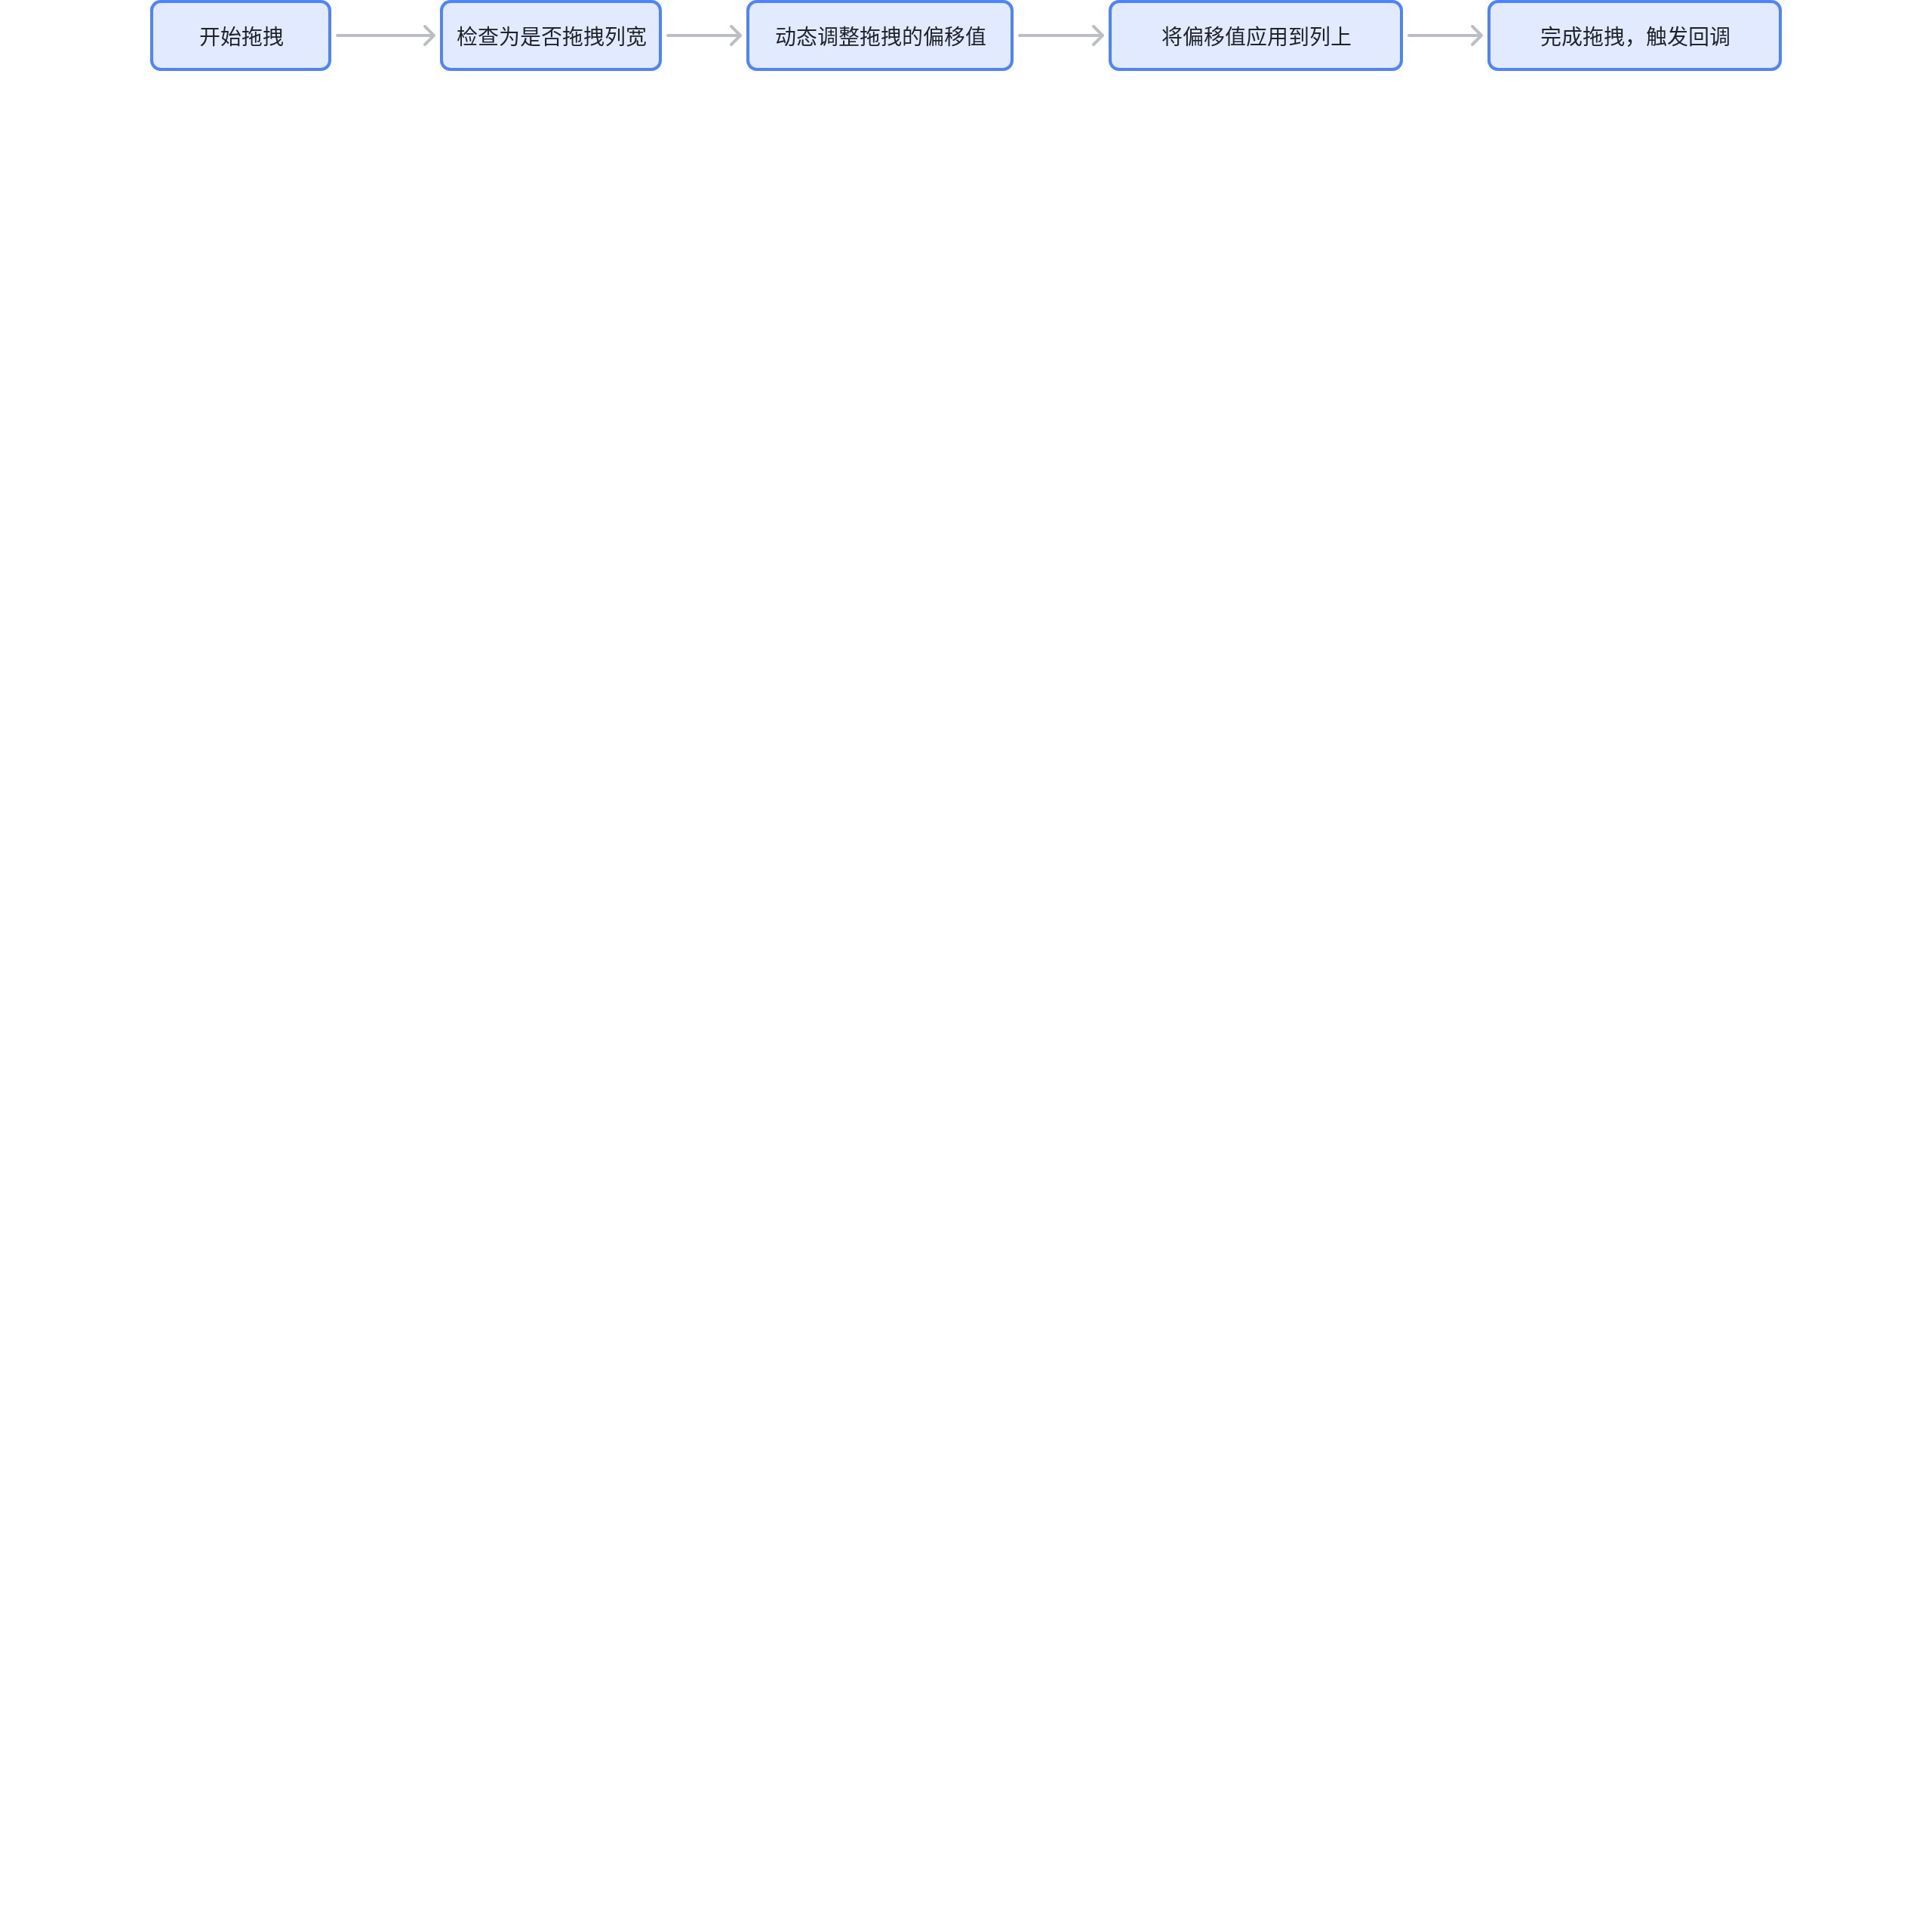
Start dragging to adjust column width
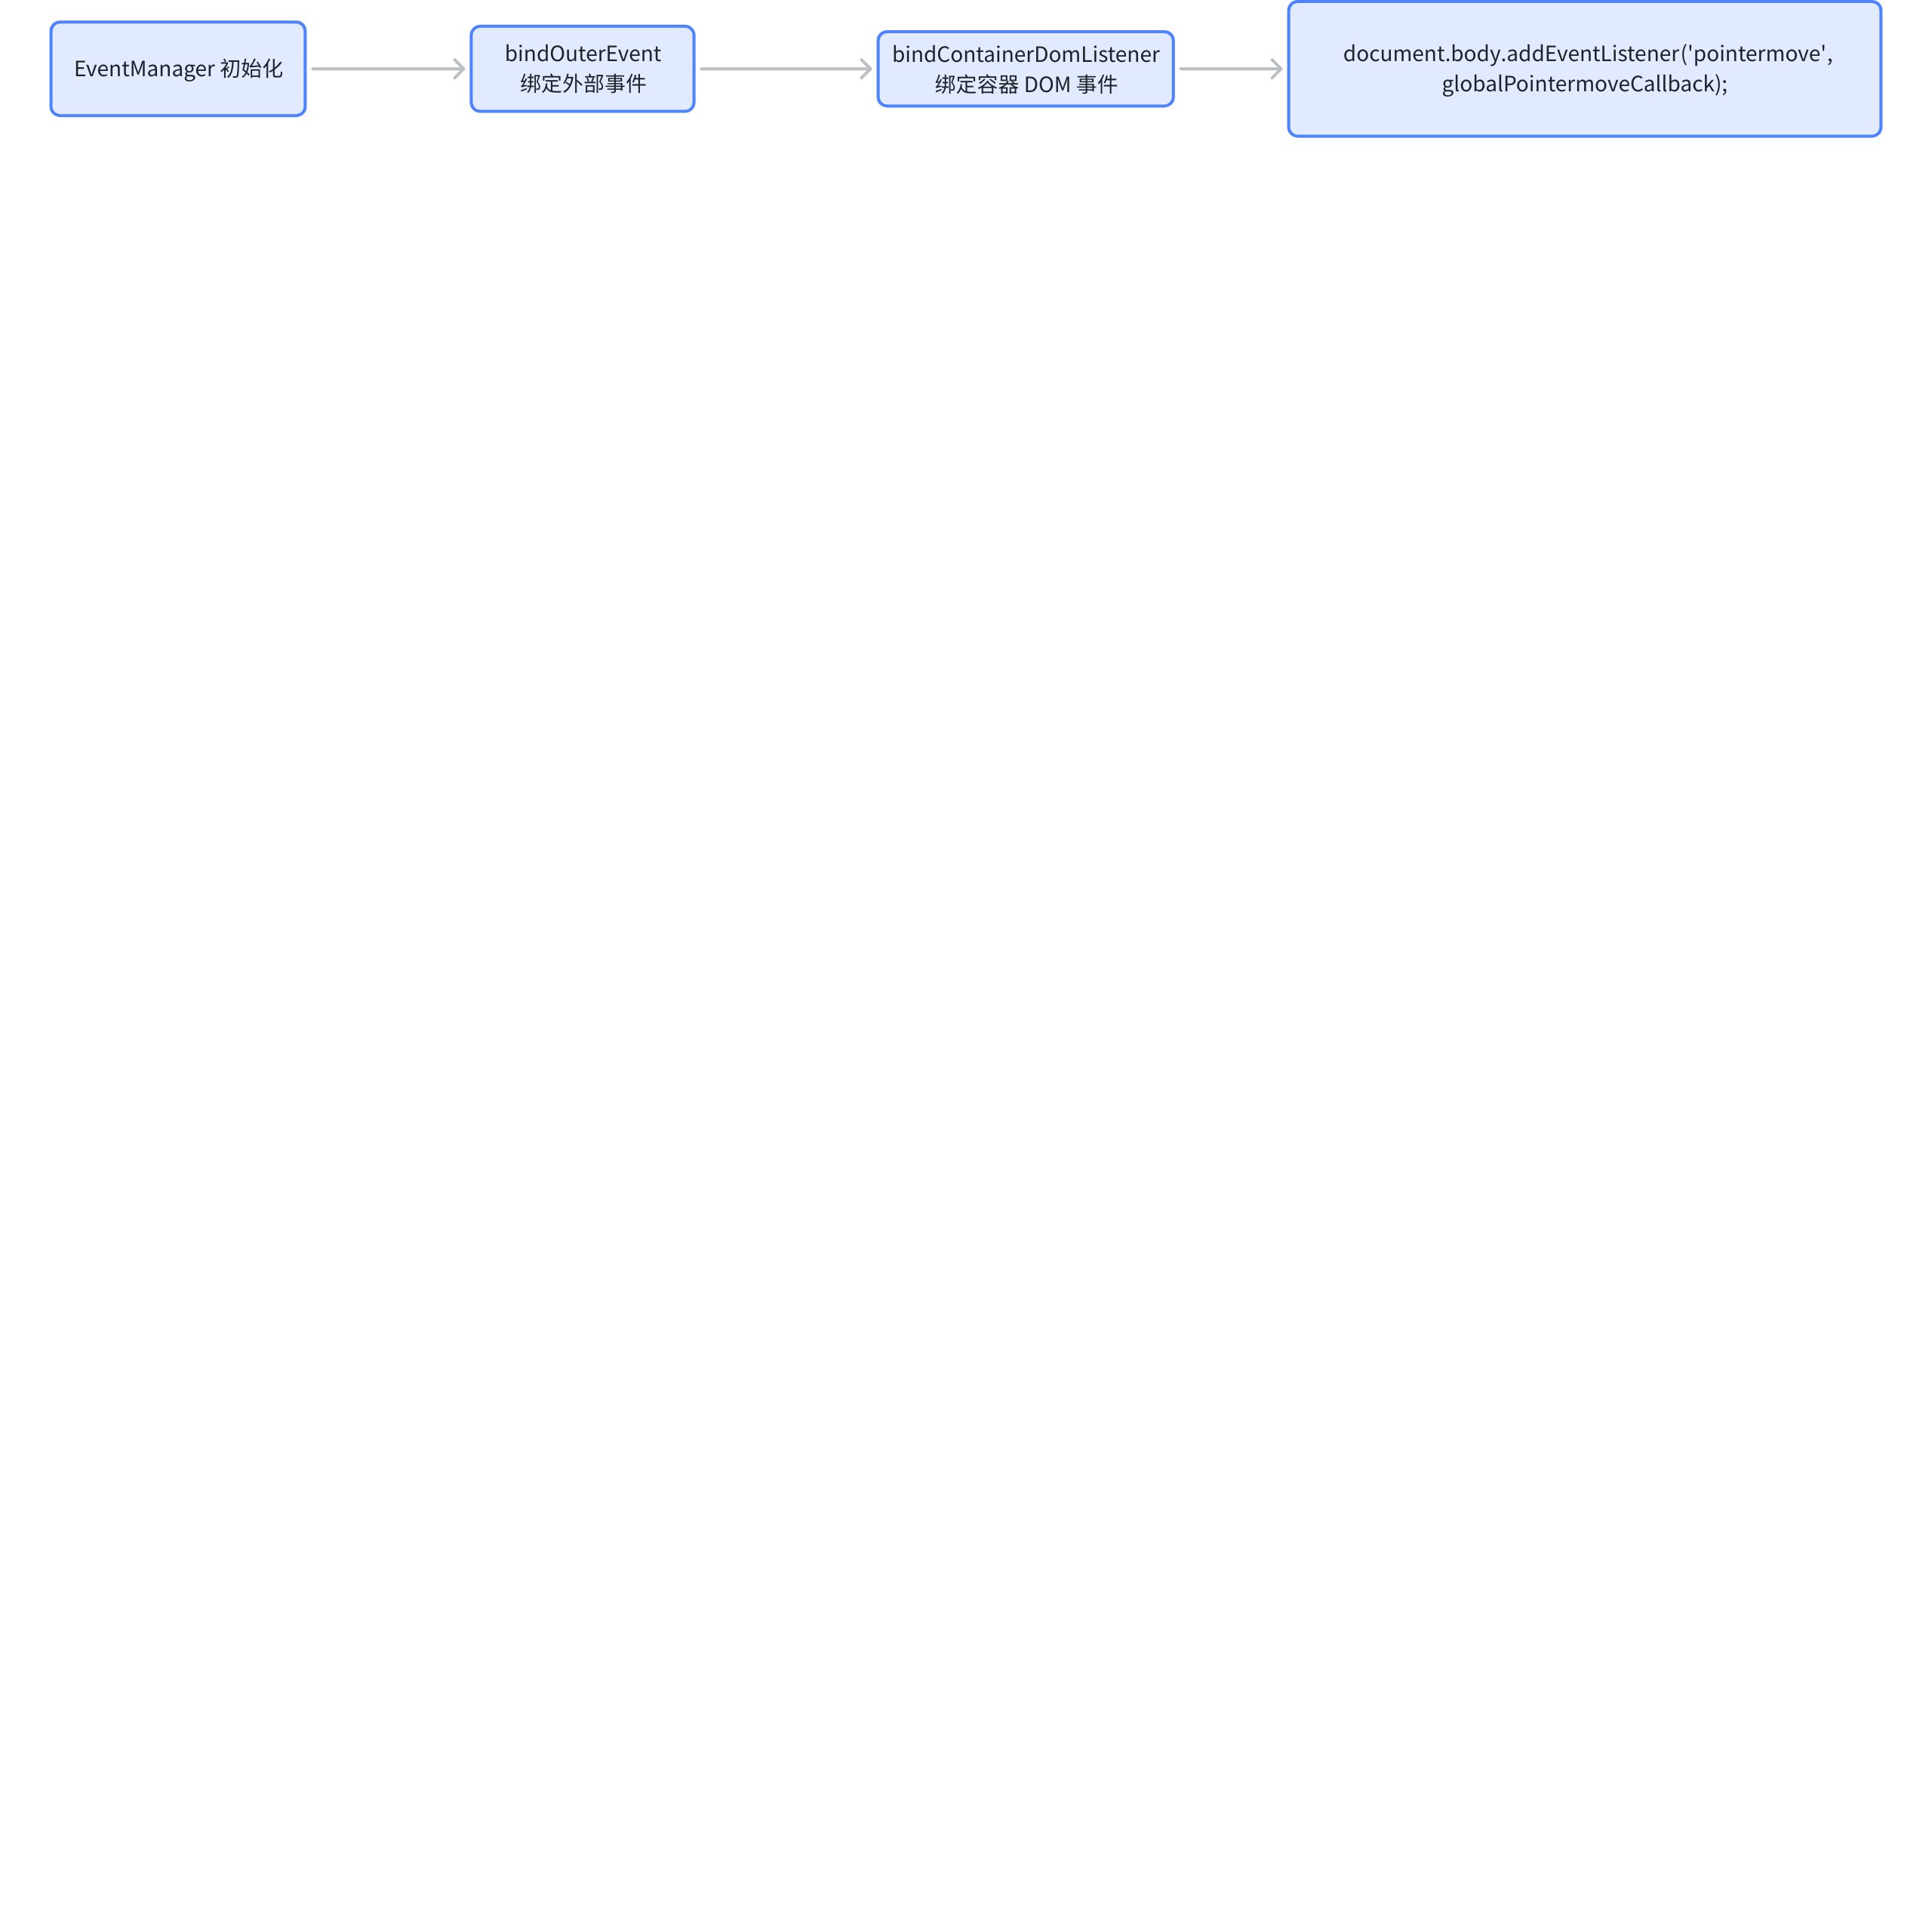
The activation of dragging column width mainly listens to the pointerdown event of the tableGroup. The overall process is roughly as follows: \r
Dragging Hotspot Judgment
You might be curious about how ListTable internally determines whether the current click is on a border or a cell. Let's take a look at how ListTable makes this determination. \r
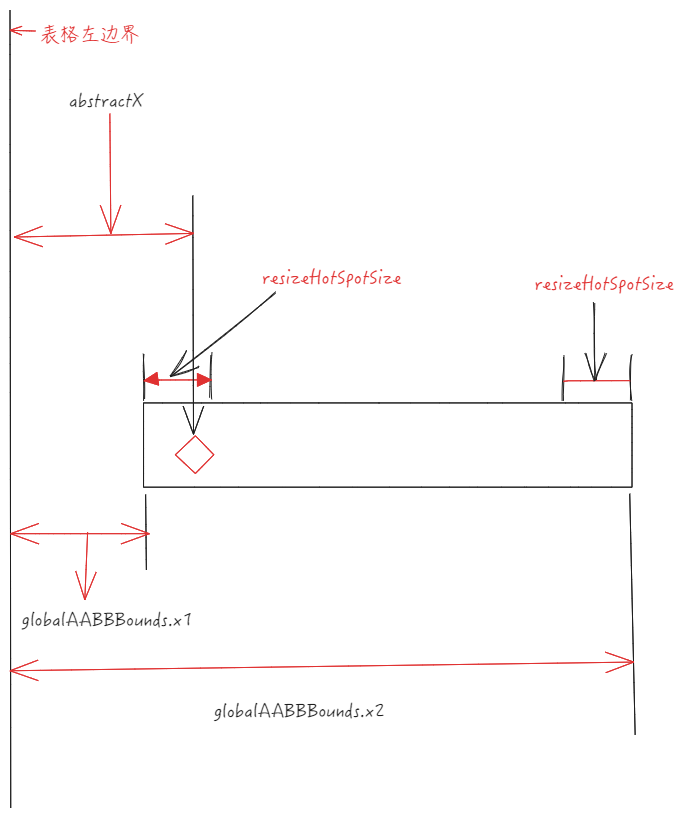
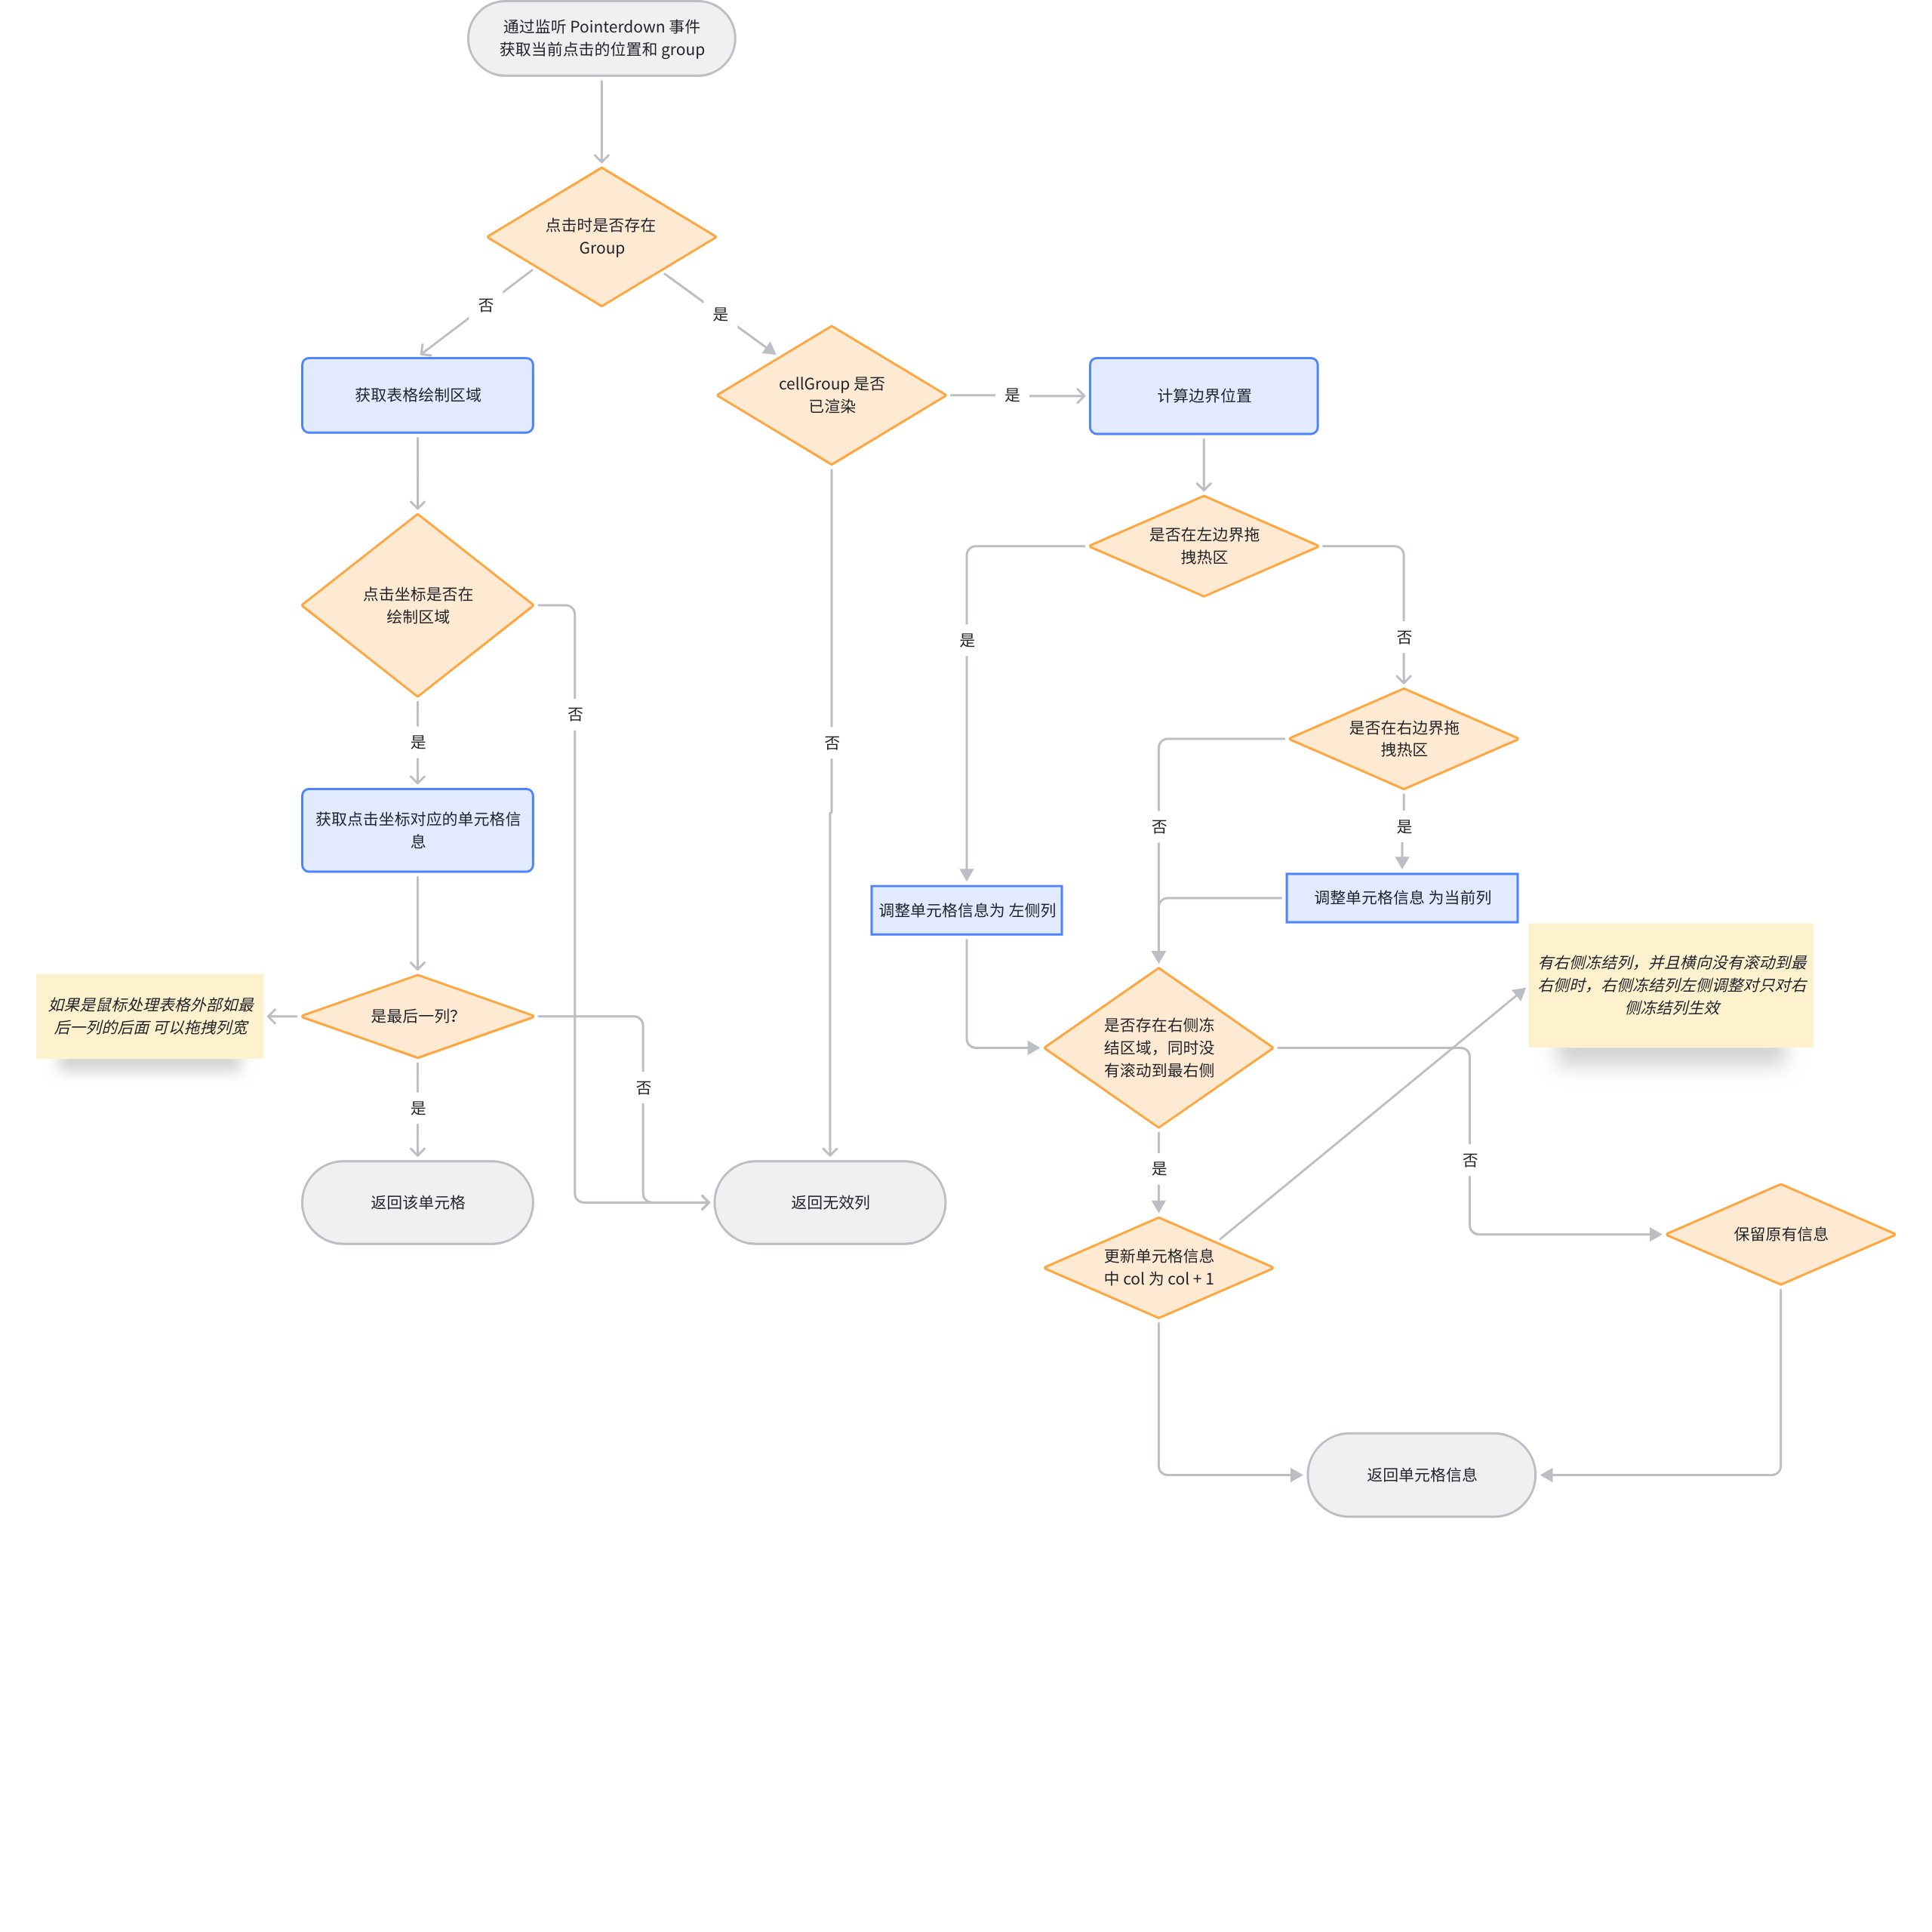
Determine whether the clicked area is within the drag hotspot, mainly relying on scenegraph.getResizeColAt, which contains a core piece of code.
The current clicked X coordinate < the X coordinate of the left boundary of the cell + resizeHotSpotSize means hitting the left drag hotspot, at this time you need to update the information of the current drag cell to the left cell, the same applies to the right drag hotspot.
Below is the overall flowchart of getResizeColAt \r
If you can get the cell information clicked through getResizeColAt, it means that the boundary of a certain column has been hit, and you can continue the action of dragging the column width. \r
Impact of startResizeCol
The startResizeCol in the previous step will update the columnResize state in the StateManager, and later in the pointermove event, it can determine whether the column width is being dragged by checking resizing.
It will also record the x-coordinate and column index at the start of the drag. \r
// packages\vtable\src\event\listener\container-dom.ts
function globalPointermoveCallback() {
  // ...
  if (stateManager.interactionState === InteractionState.grabing) {
      if (stateManager.isResizeCol()) {
        eventManager.dealColumnResize(x, y);
        if ((table as any).hasListeners(TABLE_EVENT_TYPE.RESIZE_COLUMN)) {
          table.fireListeners(TABLE_EVENT_TYPE.RESIZE_COLUMN, {
            col: table.stateManager.columnResize.col,
            colWidth: table.getColWidth(table.stateManager.columnResize.col)
          });
        }
      }
  }
  // ...
 }
The callback will internally determine whether it is in the state of dragging the column width, then call dealColumnResize, and subsequently trigger the callback event configured by the business side.
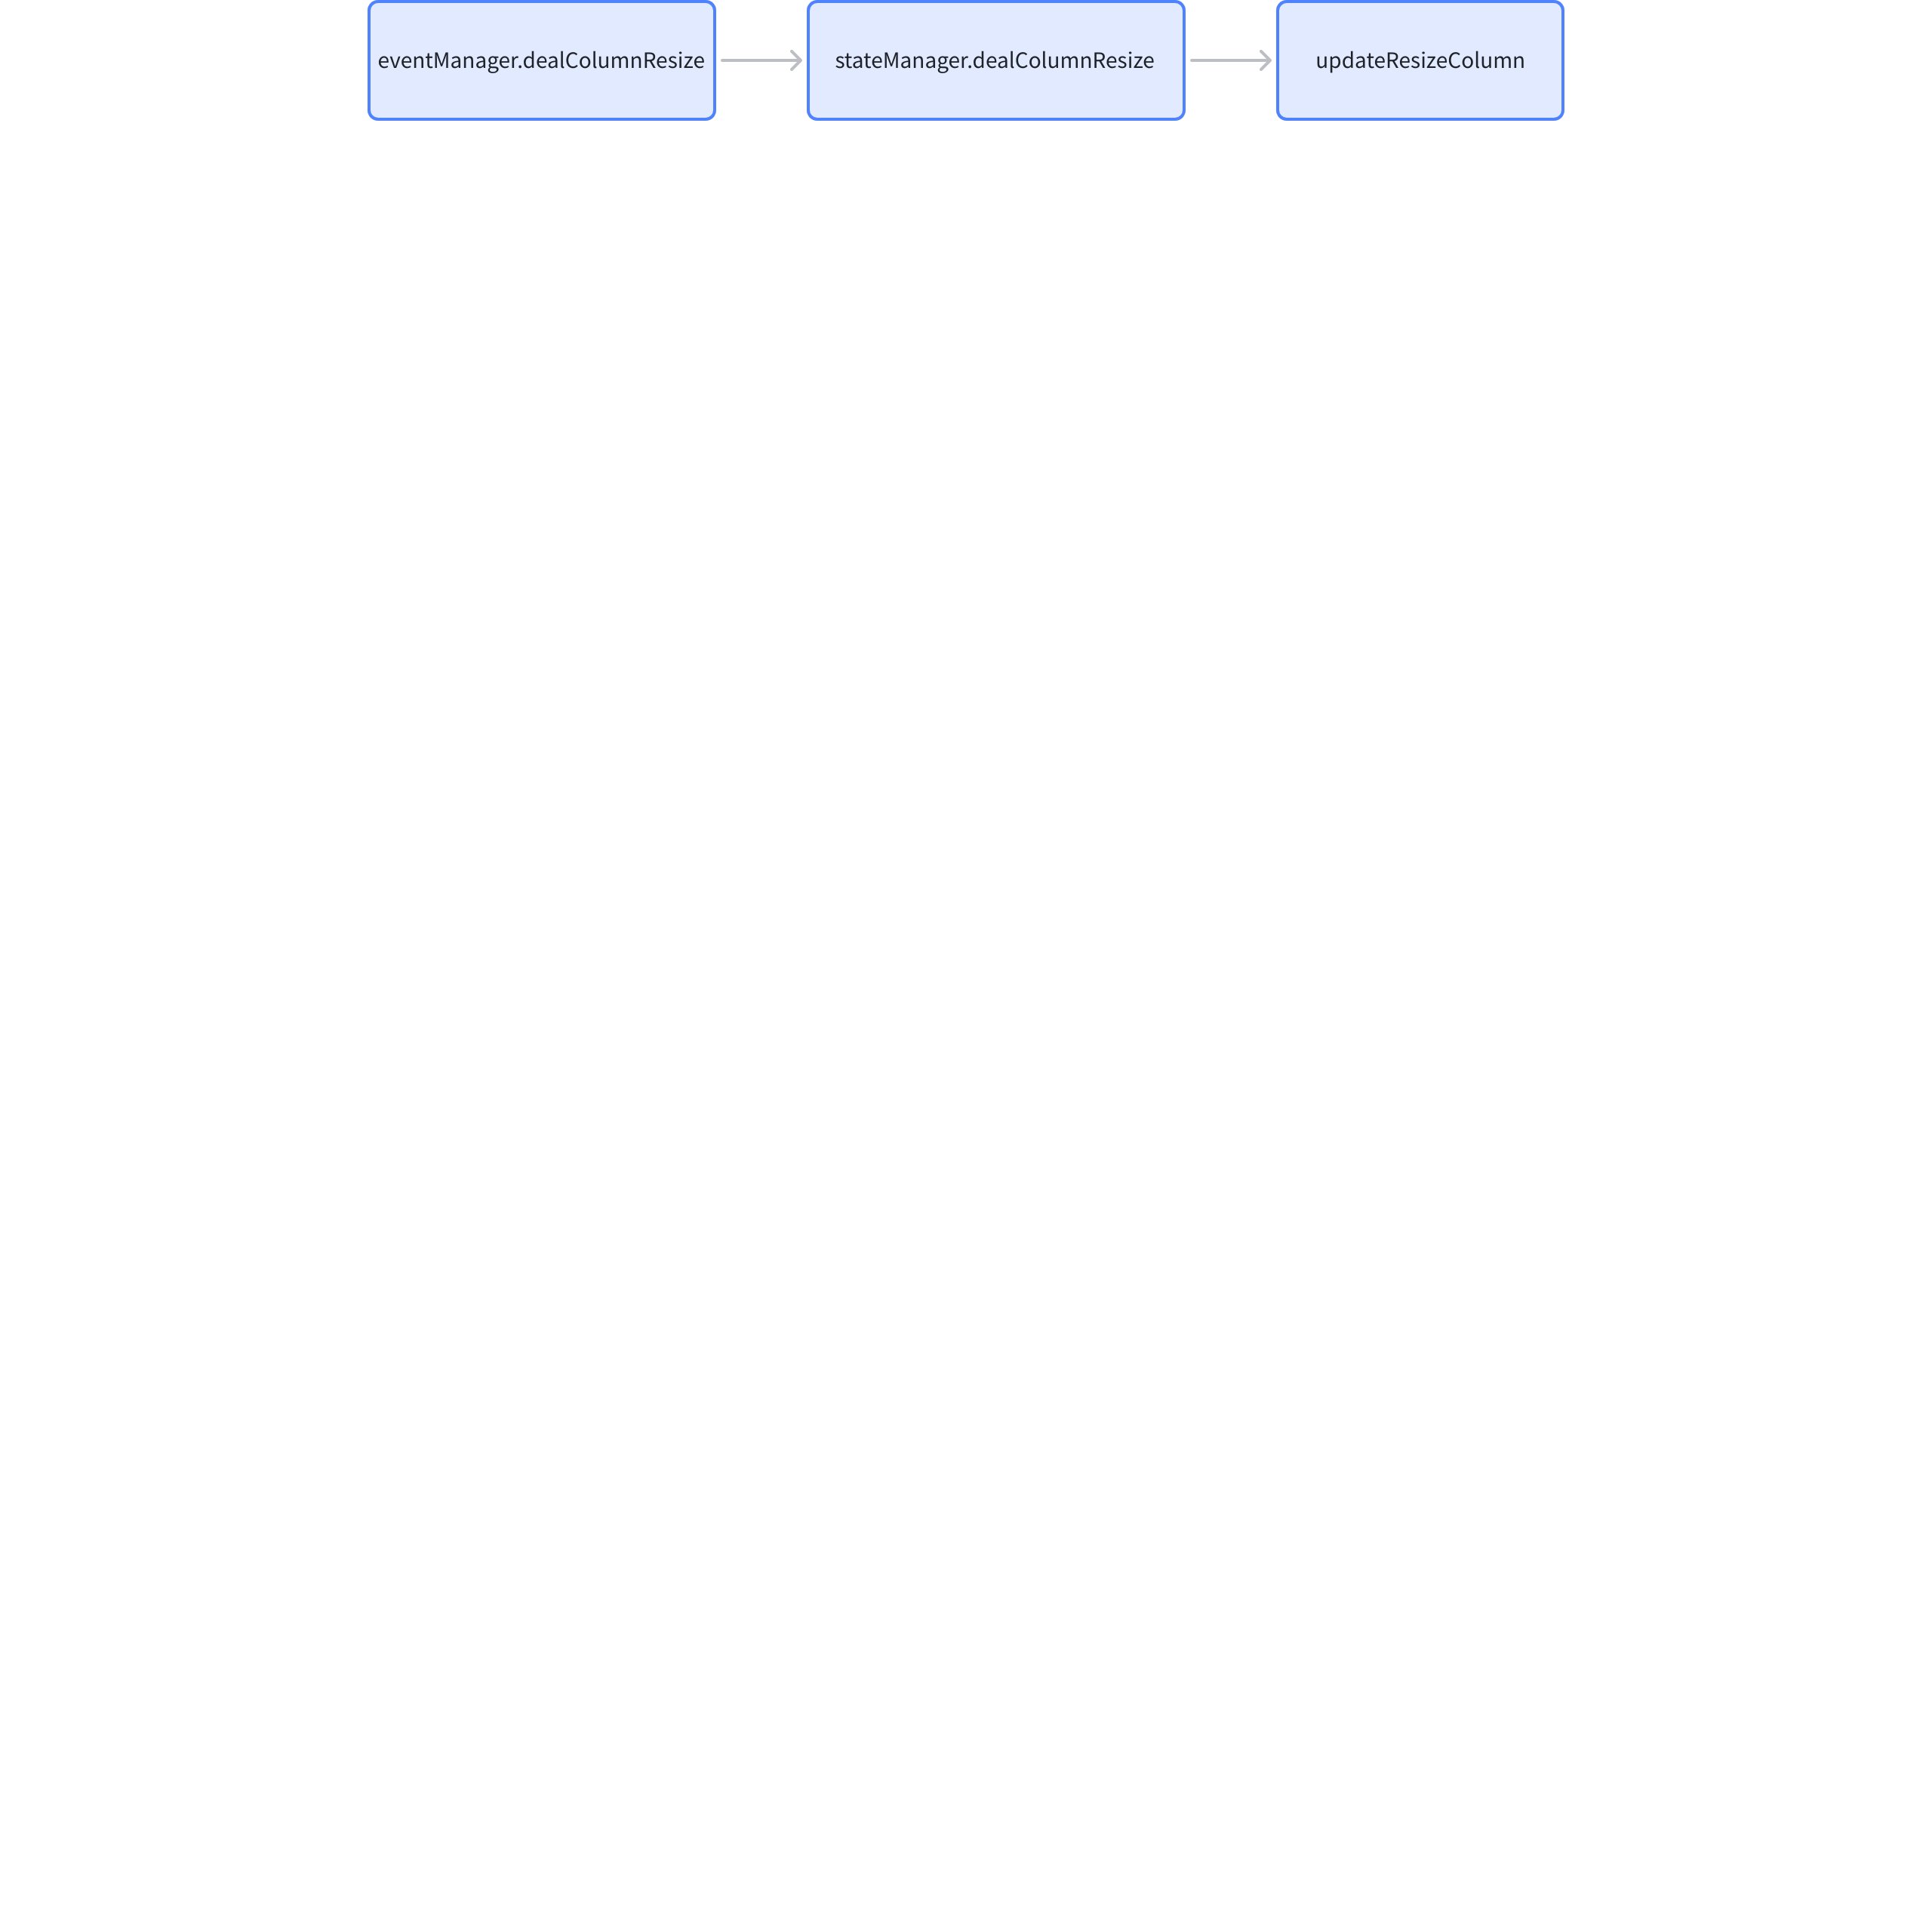
Real-time Column Width Update Mechanism
Why is ListTable so smooth when adjusting column widths? The main processing logic is still in dealColumnResize. And the execution of dealColumnResize is actually executing updateReizeColumn.
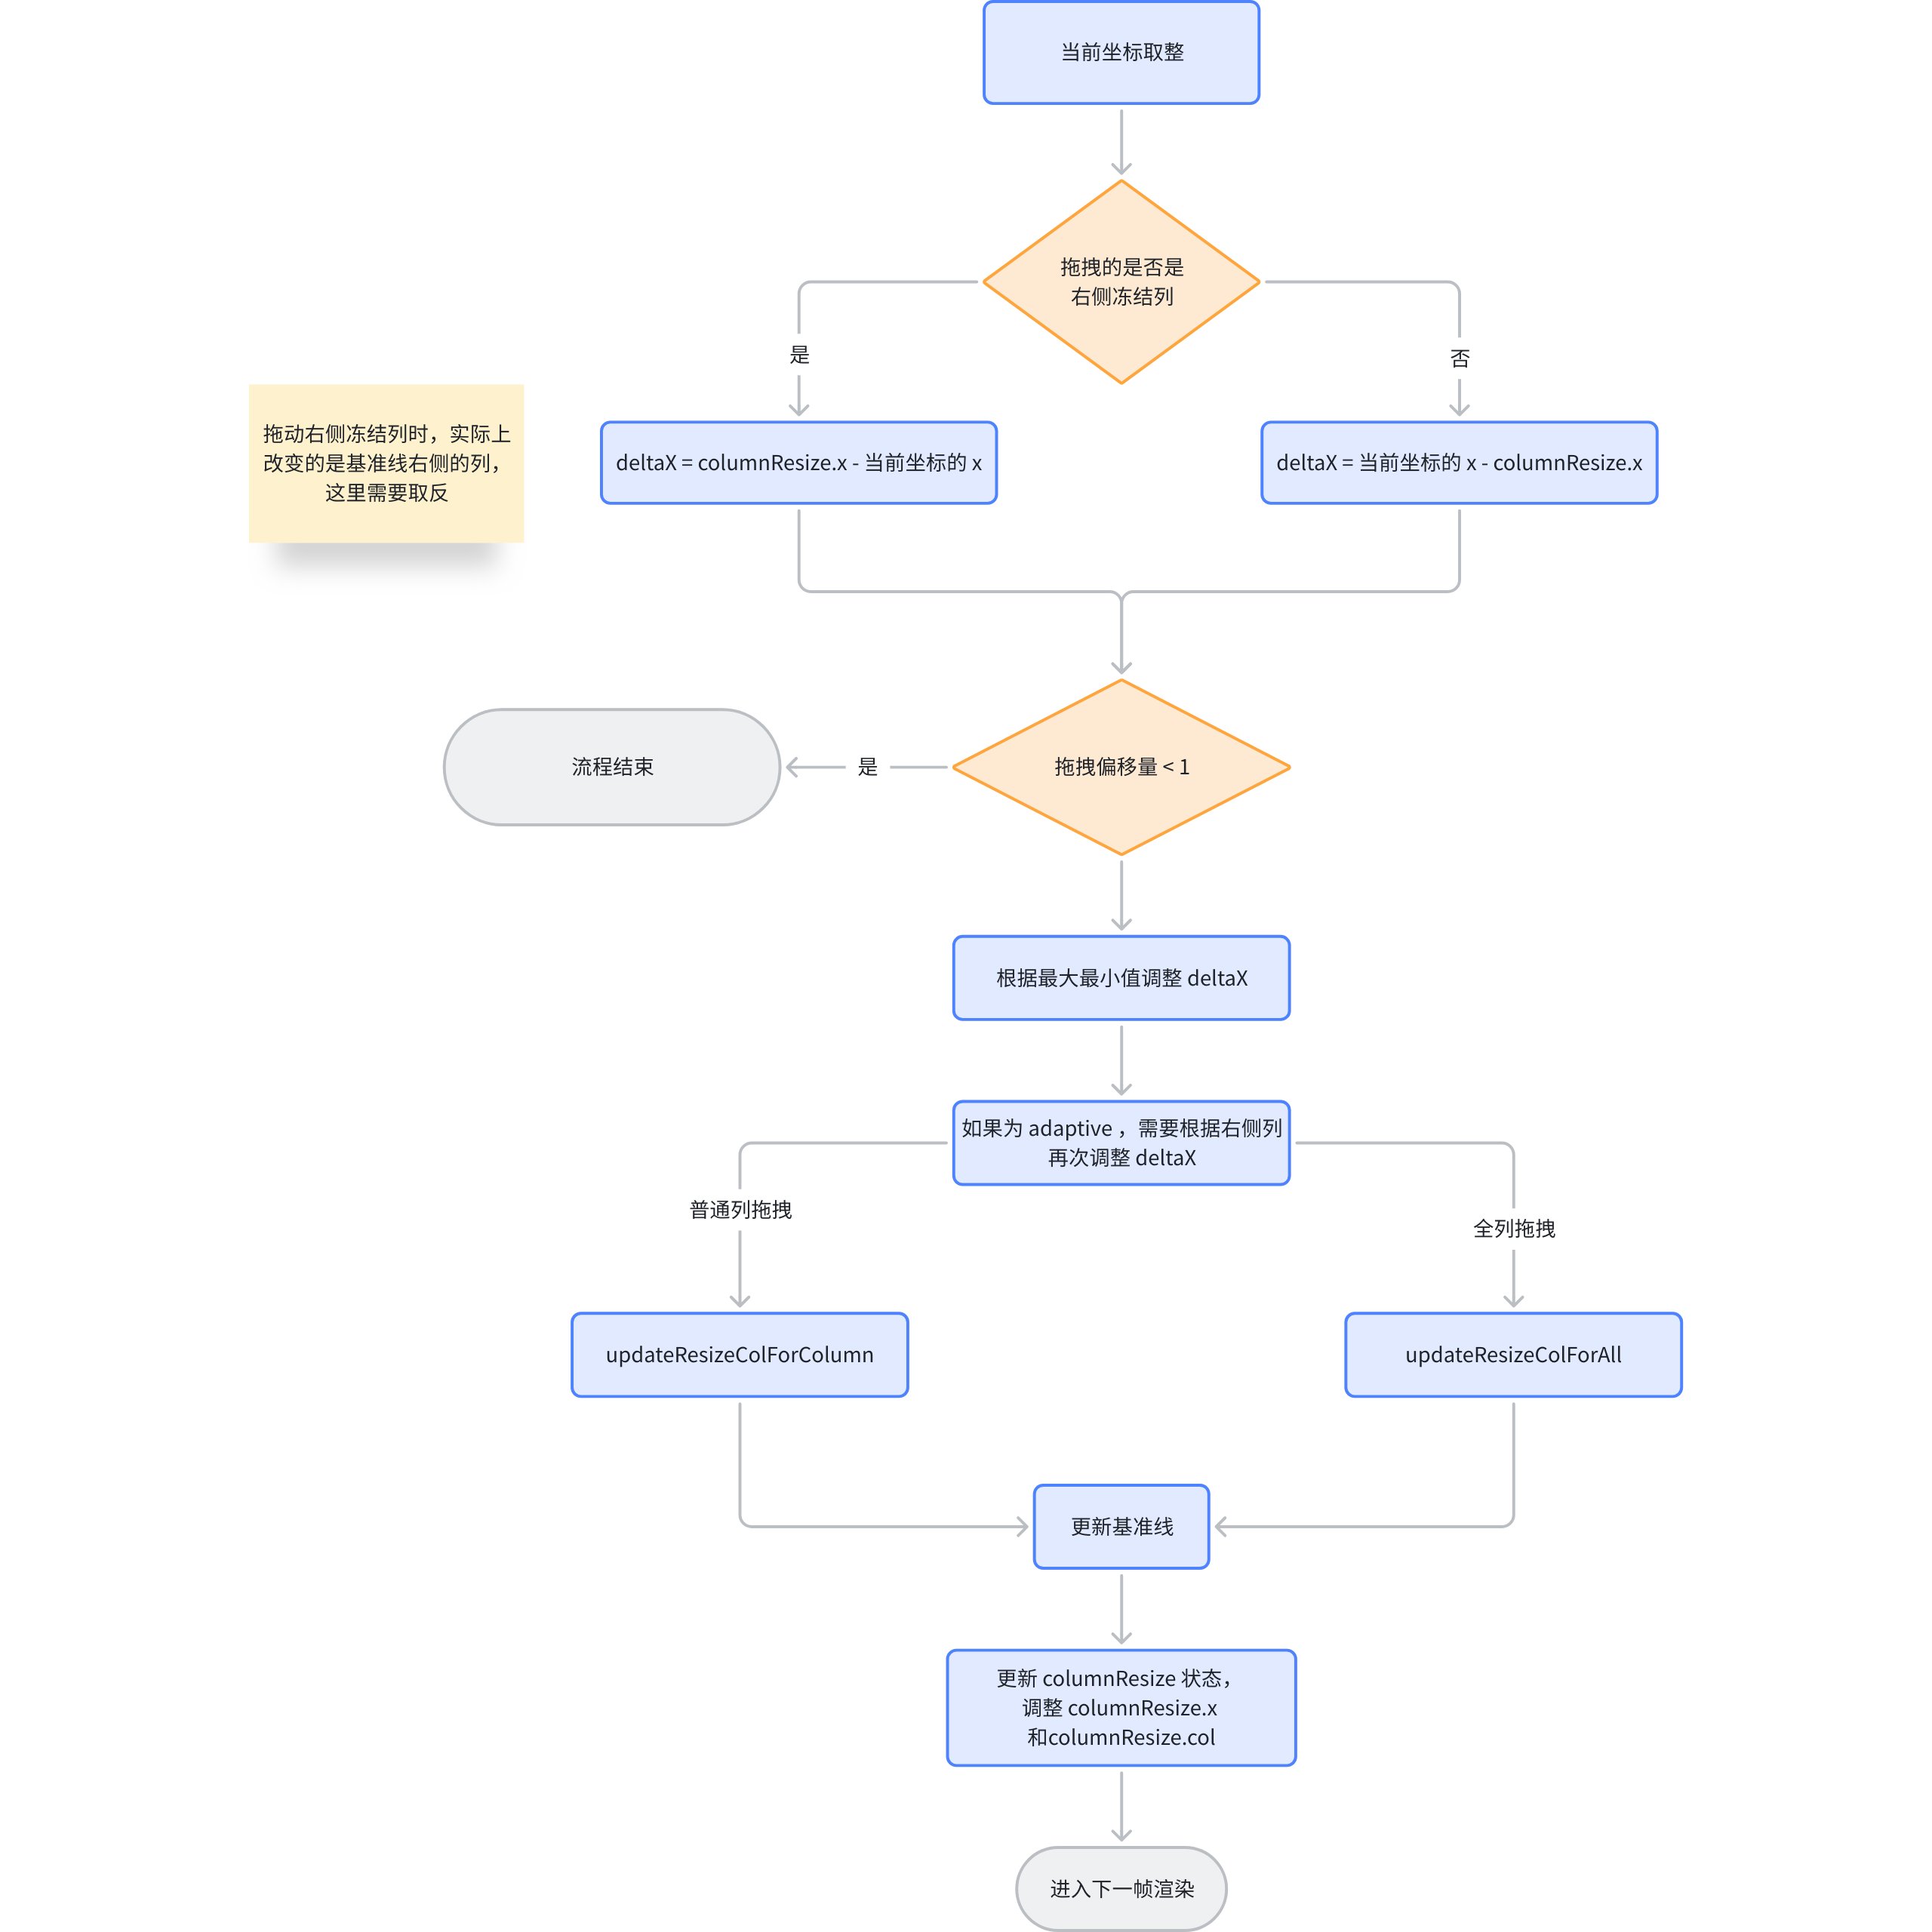
Column Width Update Process
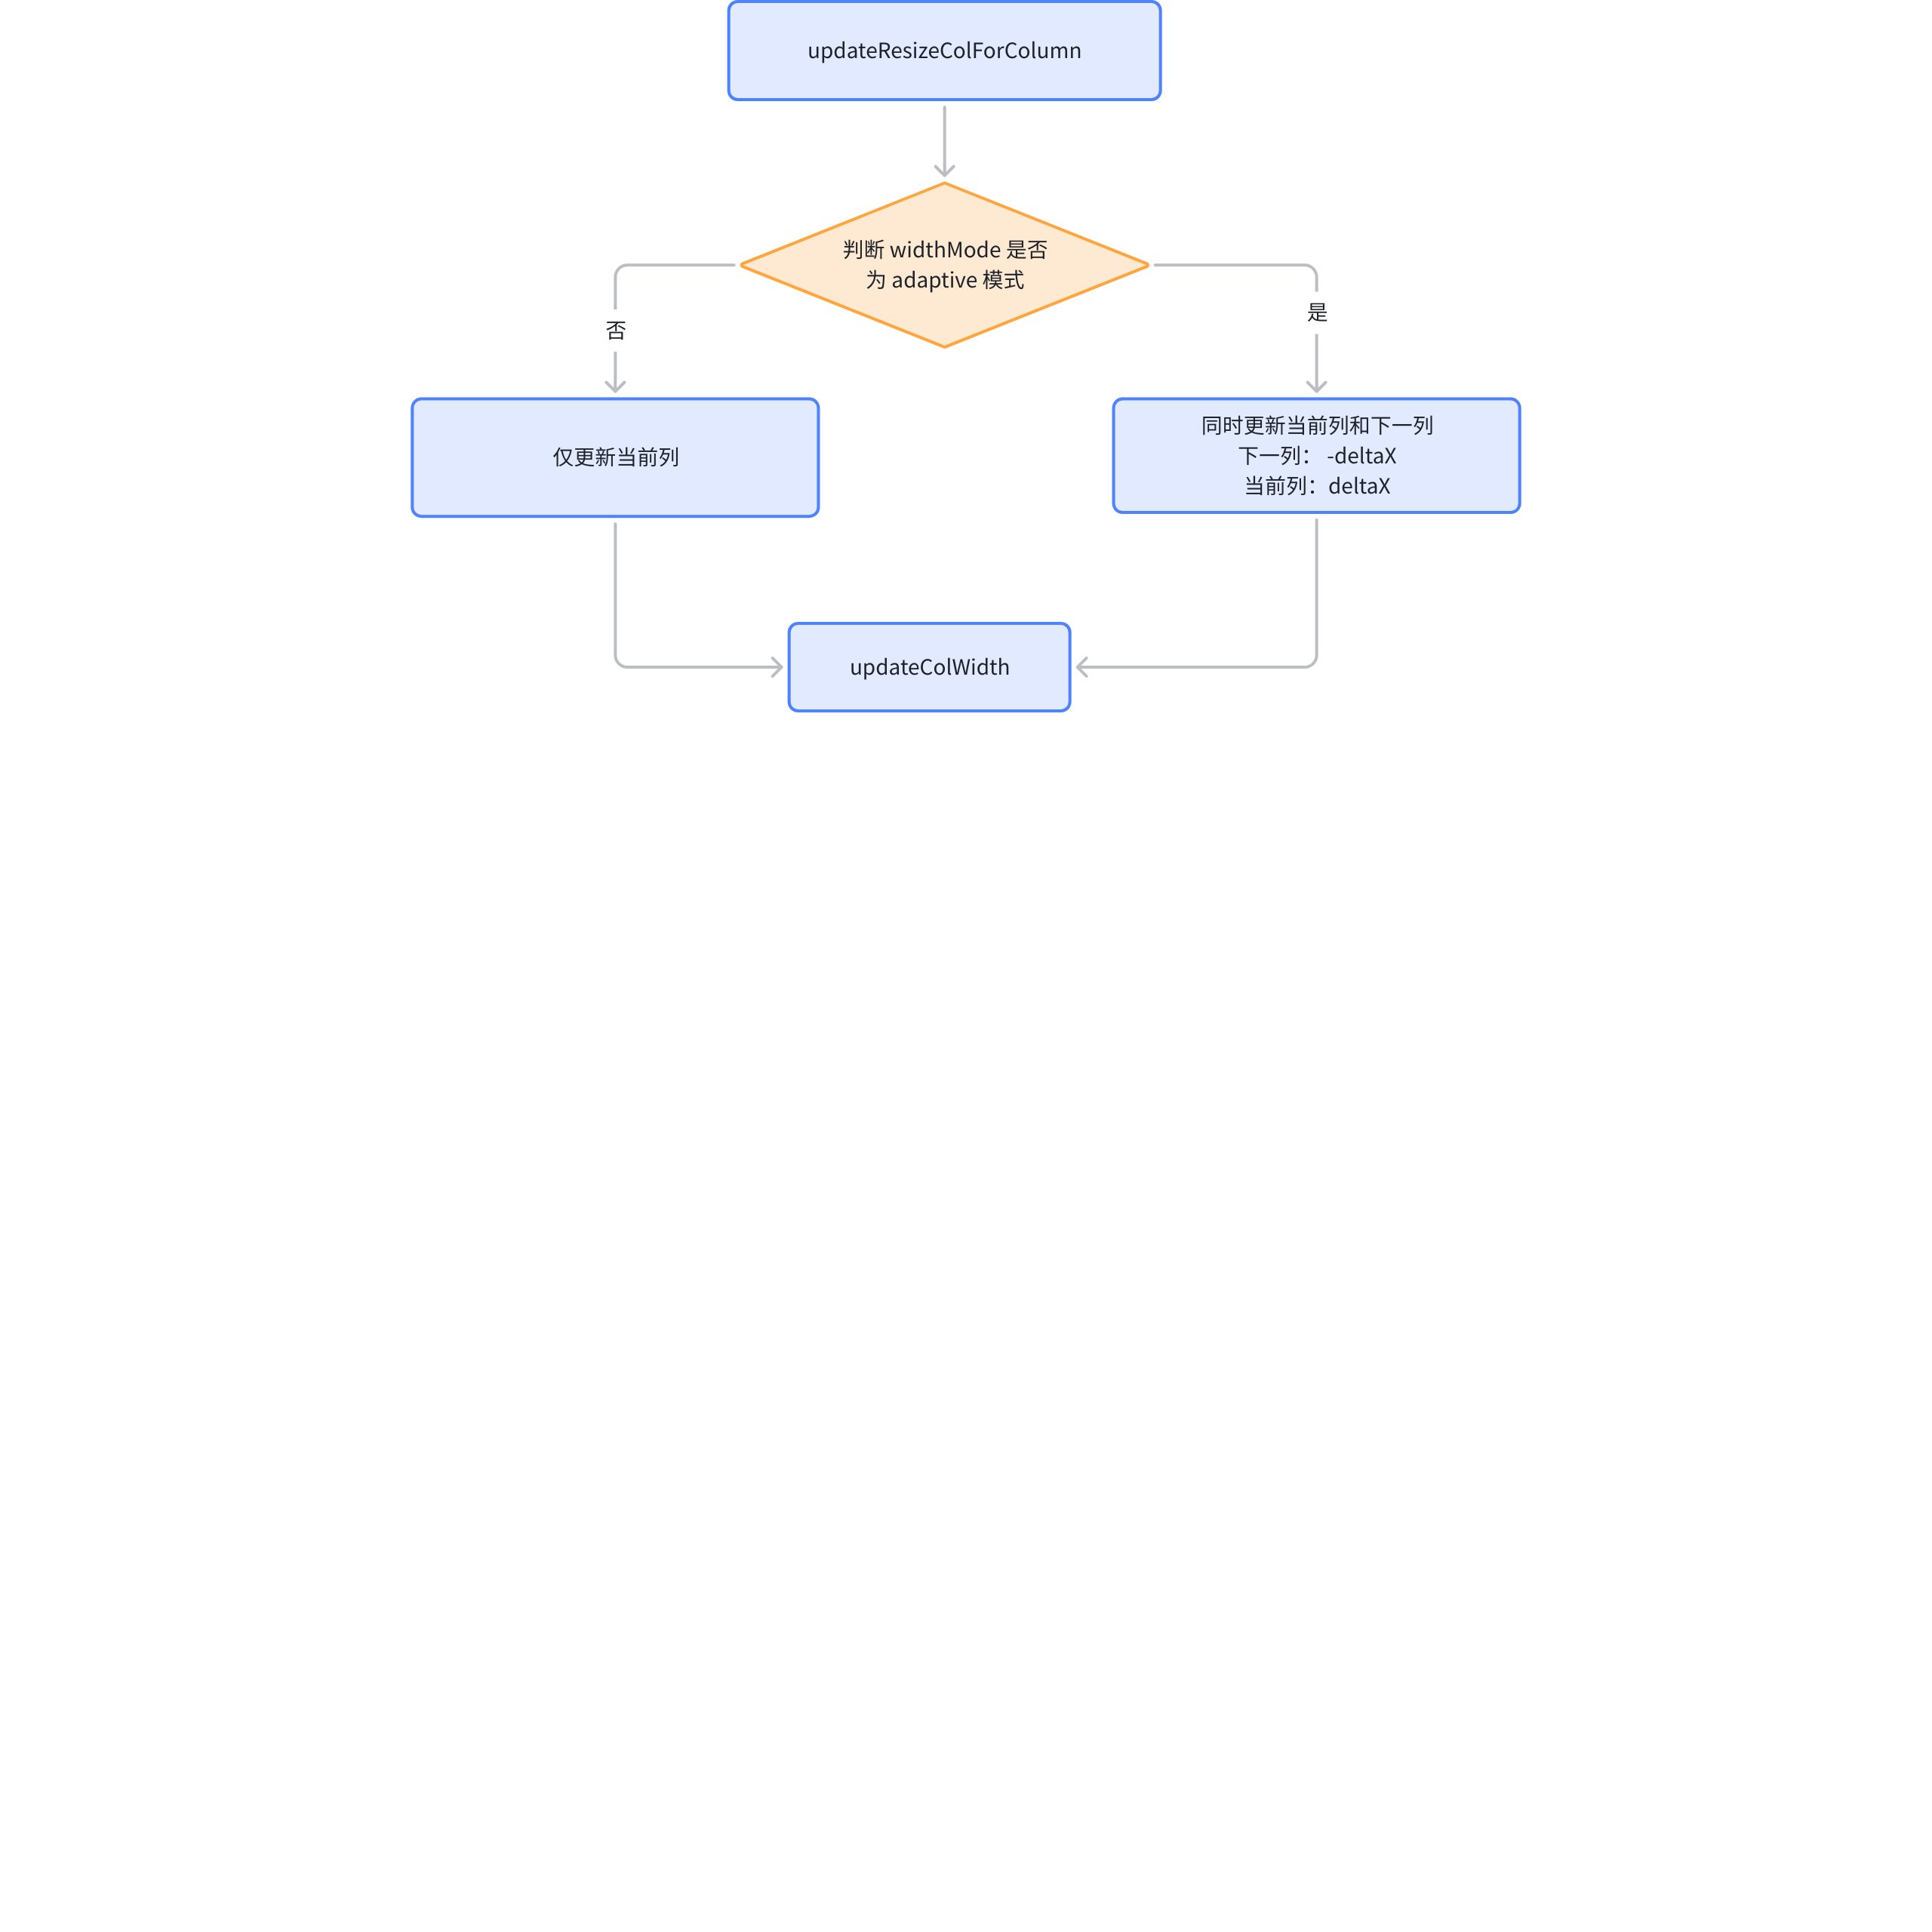
Updating column width mainly involves three functional functions
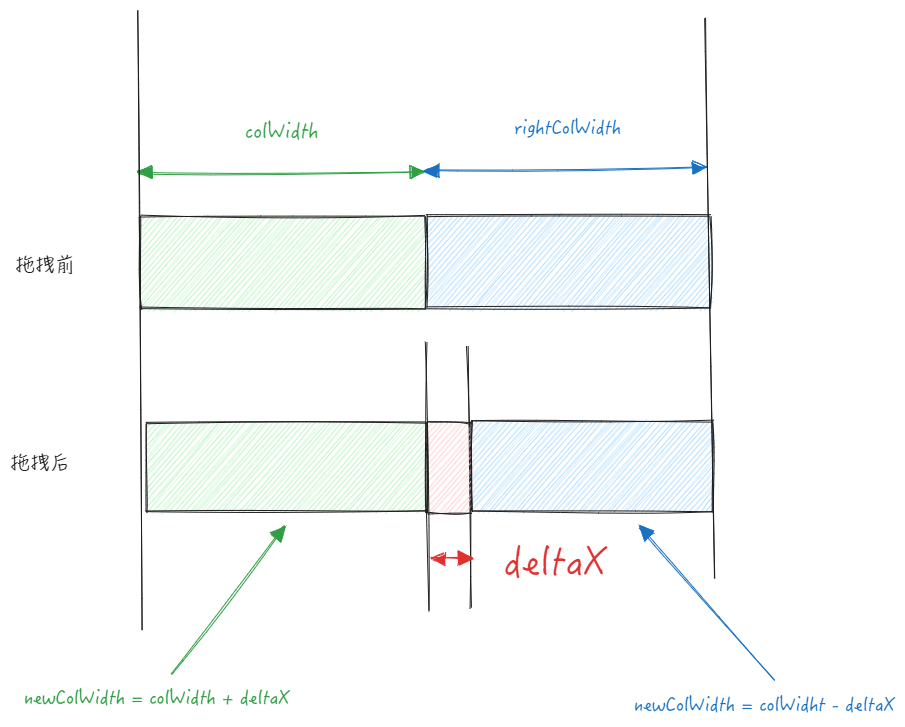
Basic tables can enable adaptive mode with widthMode: 'adaptive'. In this case, the length of the table is fixed, and you cannot update just one column alone; instead, columns on both sides of the baseline need to be updated.
Assuming the user has dragged the baseline to the right, the offset of the drag is deltaX, which is deltaX for the left column and -deltaX for the right column.
The drag completion listens to the pointerup event. Since the chart has already been updated during the drag process, there isn't much to do when the drag is completed. The main tasks are operations like restoring the state to default values, specifically including: \r
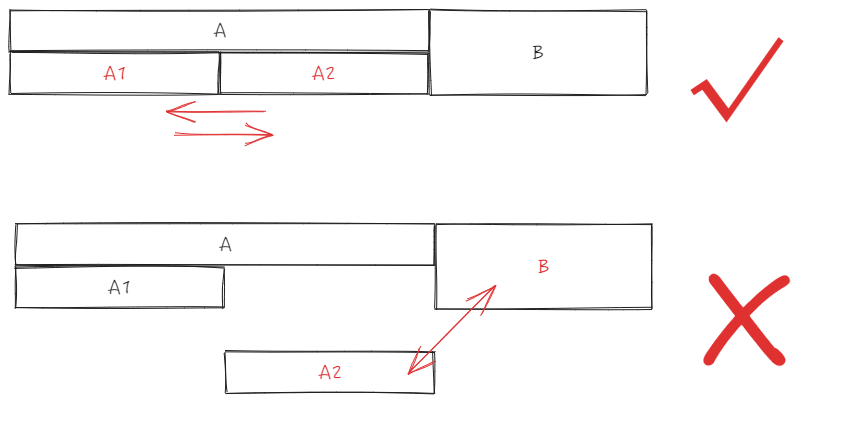
Business parties can enable drag-and-drop header rearrangement through the dragHeaderMode configuration, but for drag-and-drop header rearrangement, it is limited to the same level and cross-level dragging is not allowed. \r
Drag and Drop Listener
The listener for drag-and-drop repositioning is the same as the listener for drag-and-drop column width adjustment, both listening to the pointerdown event. \r
However, in this callback, it will first determine whether it hits the drag to adjust column width, to avoid affecting the drag column width event. \r
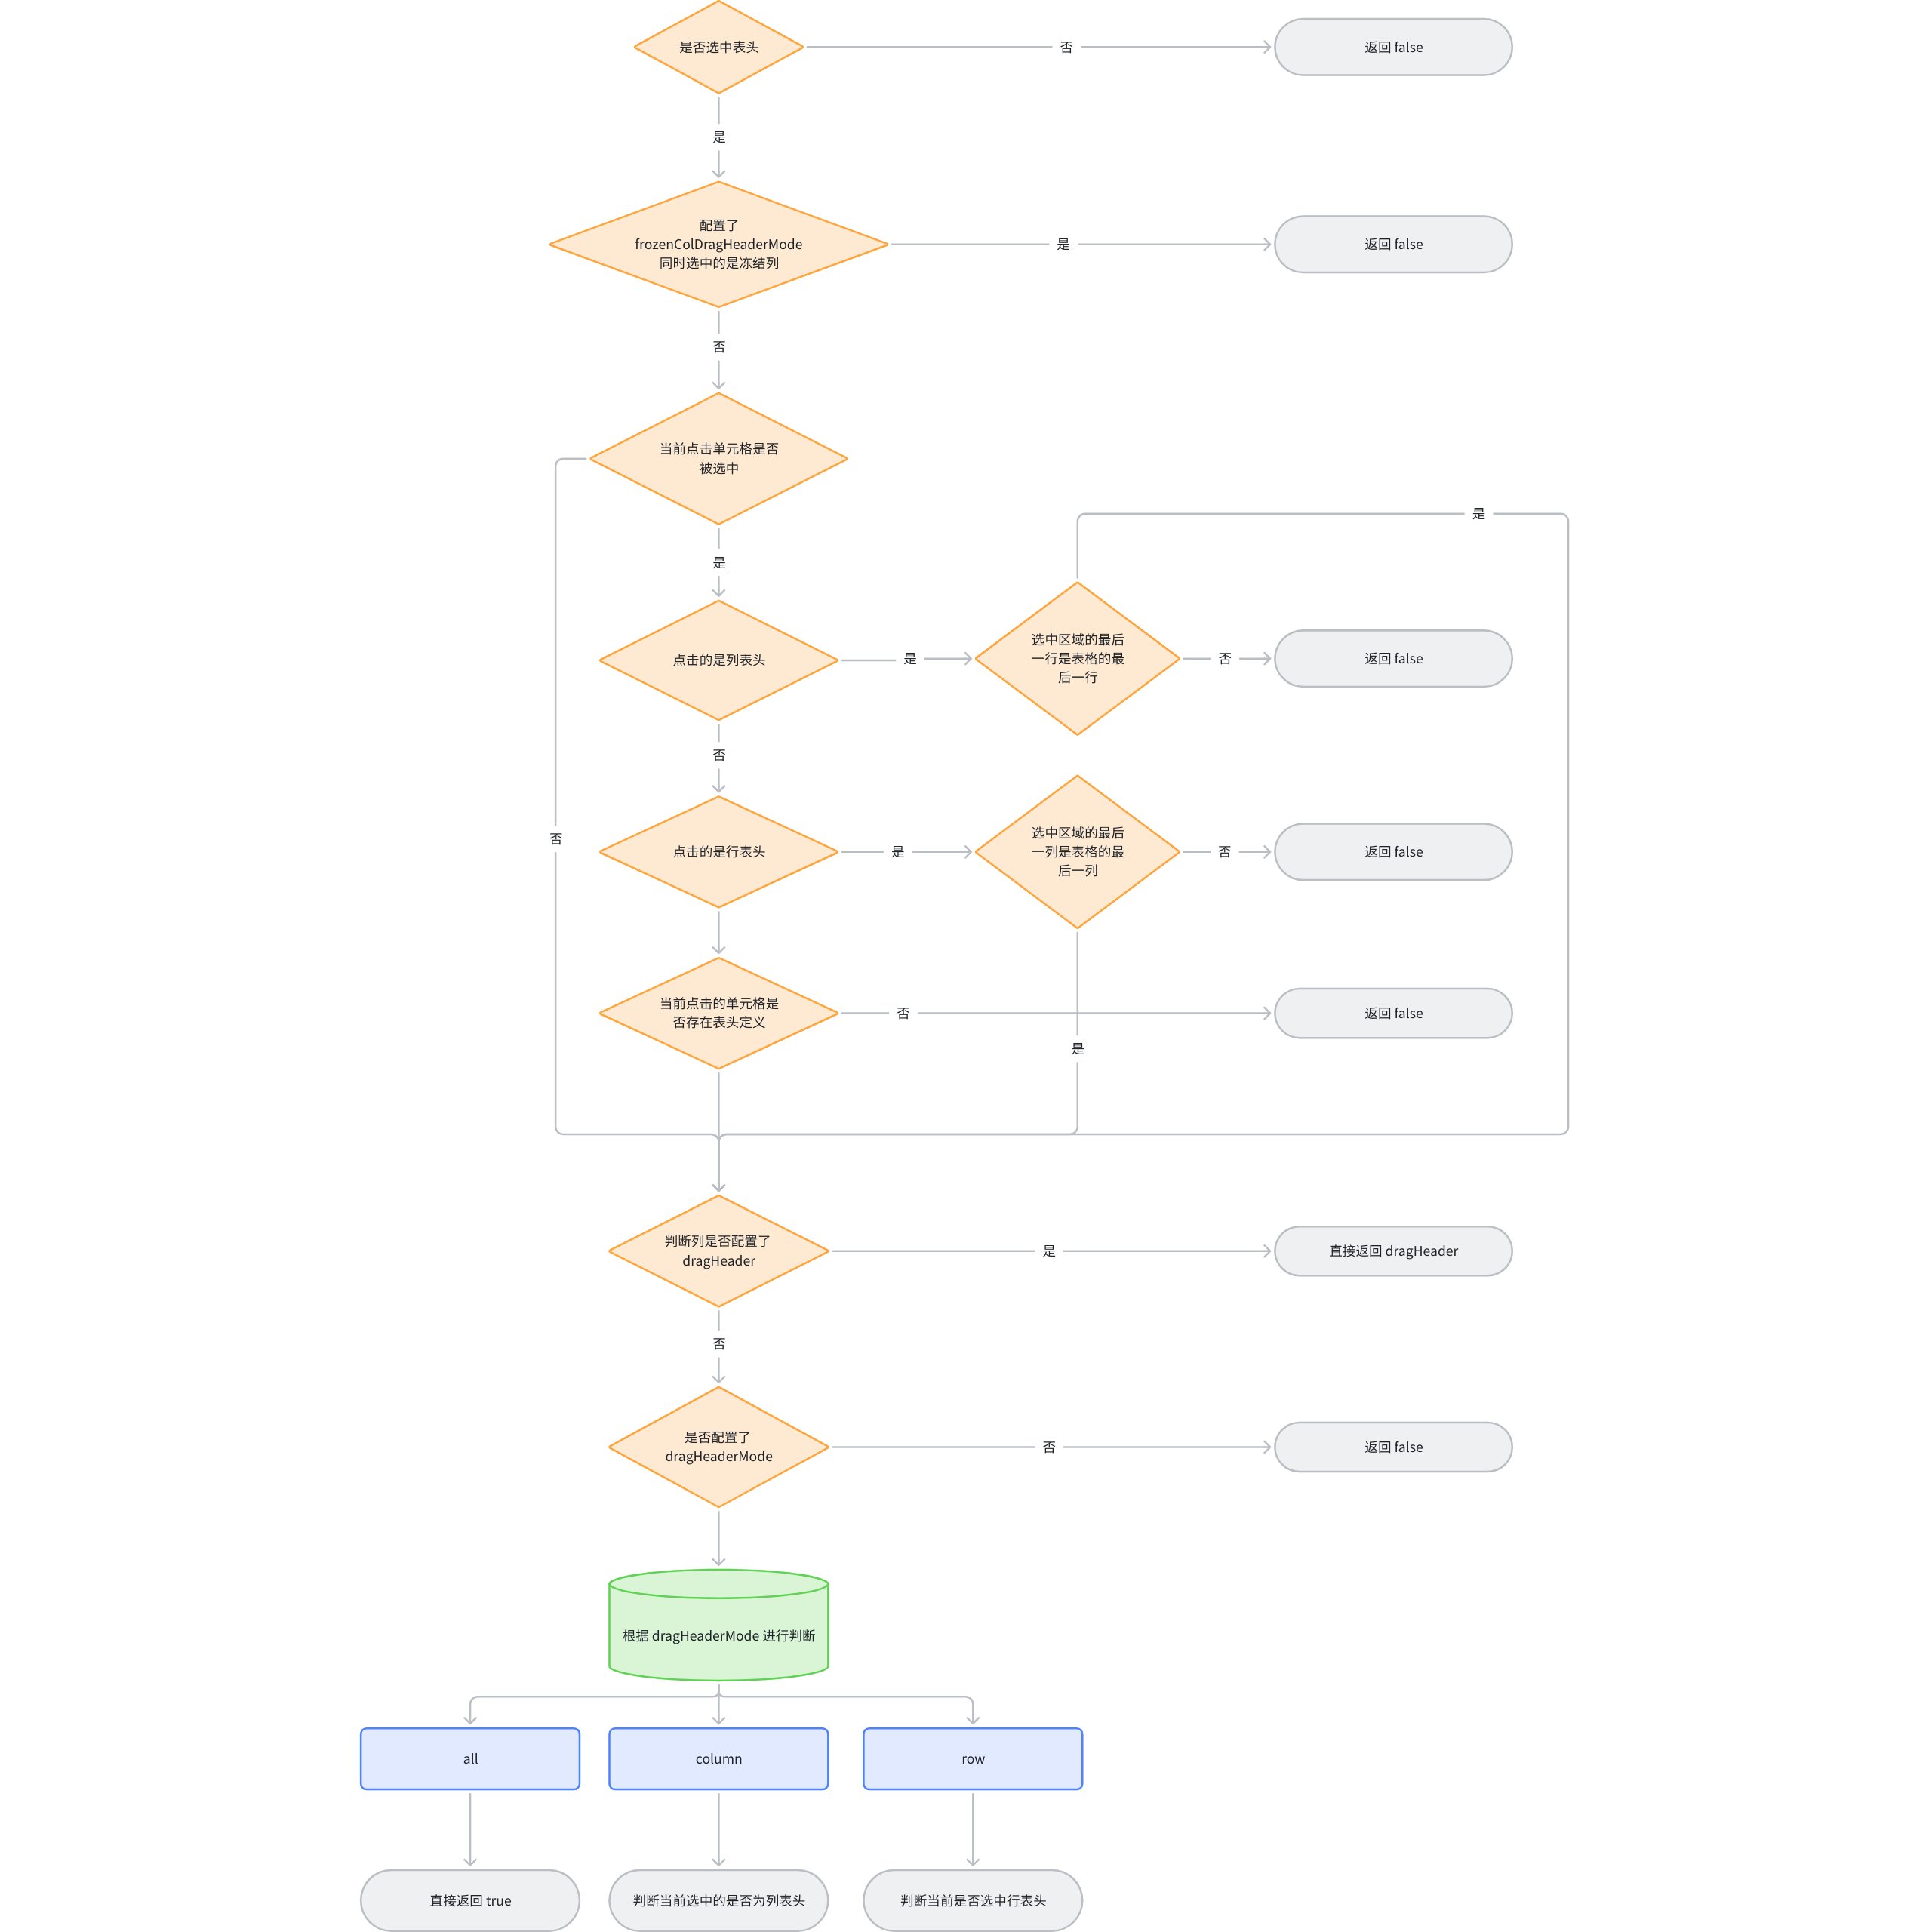
Due to the particularly complex logic of dragging and swapping columns, the criteria for determining whether to enter dragging are very strict. The diagram below shows the logic for determining whether to enter column drag swapping: \r
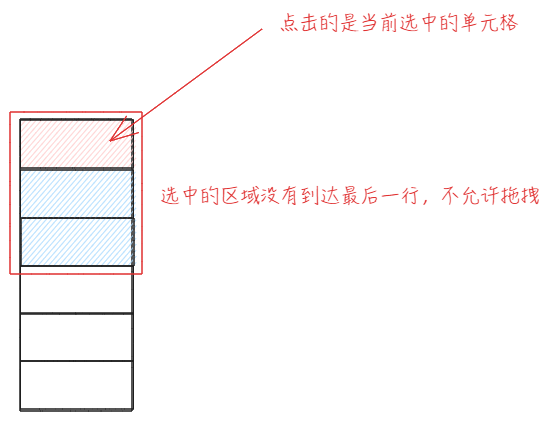
There is a special judgment internally. If the current configuration's headerSelectMode is 'cell' or the range does not include the entire column when multiple rows are selected, dragging is not allowed. This judgment is mainly added to resolve the conflict between dragging to select multiple headers and dragging columns.
When it is determined to be a column drag event, three things will be done internally: \r
Update the stateManage.columnMove status, record the current starting row and column number of the drag, and update moving to true;
Display the current drag-and-drop order adjustment component
Clear selected state
Drag Validity
Prerequisite Scenario
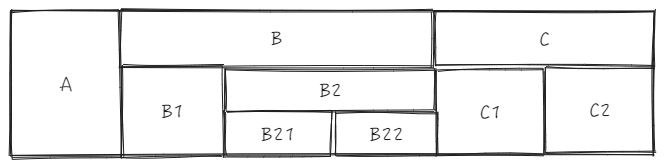
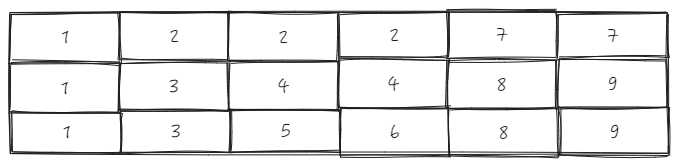
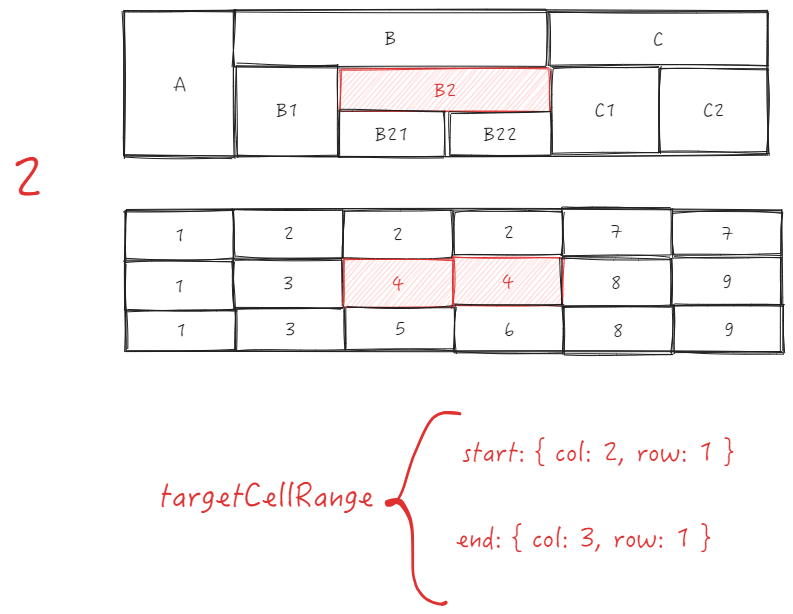
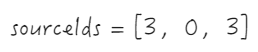
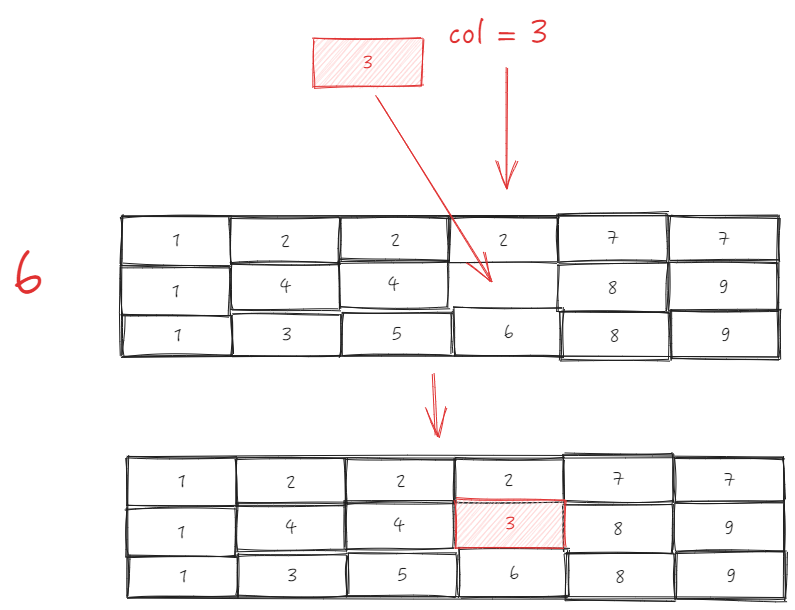
Assume we have a table header with 3 rows and 6 columns
ListTable maintains a _headerCellIds in the LayoutMap module (table layout module), and the _headerCellIds corresponding to the header above looks like this: \r
Transposition Rule
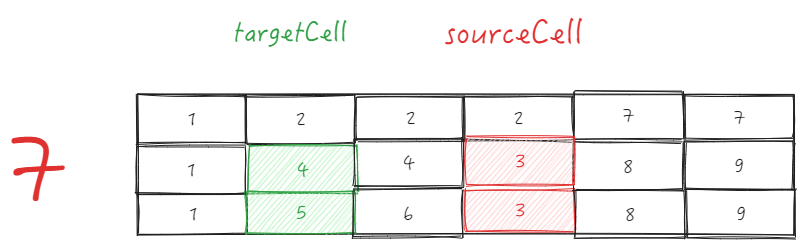
As mentioned earlier, the sourceCol is recorded at the start of the drag, and the targetCol is also obtained in real-time during the drag. The main function of ListTable is to determine whether the parent IDs of the two are consistent to decide if swapping is possible.
The core logic of this part is located in layoutMap.canMoveHeaderPosition:
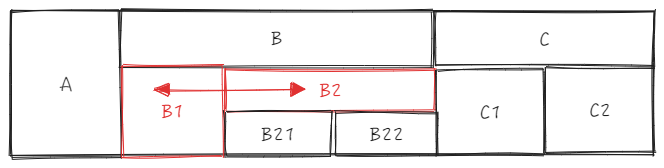
sourceCell is B1, targetCell is B2, directly use _headerCellIds to get the parent ID \r
sourceTopId:
B1 is the sourceCell, col is 1, row is 1, the entire cell sourceCellRange is \r
start = {col: 1, row: 1}
end = {col: 1, row: 2}
Get parent ID as 2 based on source.col = 1 and sourceCellRange.start.row = 1, sourceTopId = 2 \r
targetTopId:
B2 is the targetCell, col is 3, row is 1, \r
According to target.col = 3 and sourceCellRange.start.row = 1, get parent ID as 2, targetTopId = 2 \r
The two IDs are the same, they can be swapped
sourceCell is B2, targetCell is C1, directly use _headerCellIds to get parent ID \r
sourceTopId:
B2 is the sourceCell, col is 2, row is 1, sourceCellRange is \r
end = {col: 3, row: 1}
start = {col: 2, row: 1}
Get parent ID as 2 based on source.col = 2 and sourceCellRange.start.row = 1, sourceTopId = 2 \r
targetTopId:
C1 is the targetCell, col is 4, row is 1
Get parent ID as 7, targetTopId = 7 based on target.col = 4 and sourceCellRange.start.row = 1 \r
The two IDs are different, swapping is prohibited
It is very obvious that when swapping, the row number is judged using the row number of the starting cell. This is because it is assumed that dragging will only occur at the same level, so theoretically, only the column (col) changes during the dragging process. \r
Purpose of _headerCellIds Cache
layoutMap maintains a _headerCellIds, partly to facilitate obtaining relationships between nodes. For example, when obtaining a parent node, if the current cell's path is headerCellIds[row][col], then the parent ID can be directly obtained using headerCellIds[row - 1][col].
Dragging Process
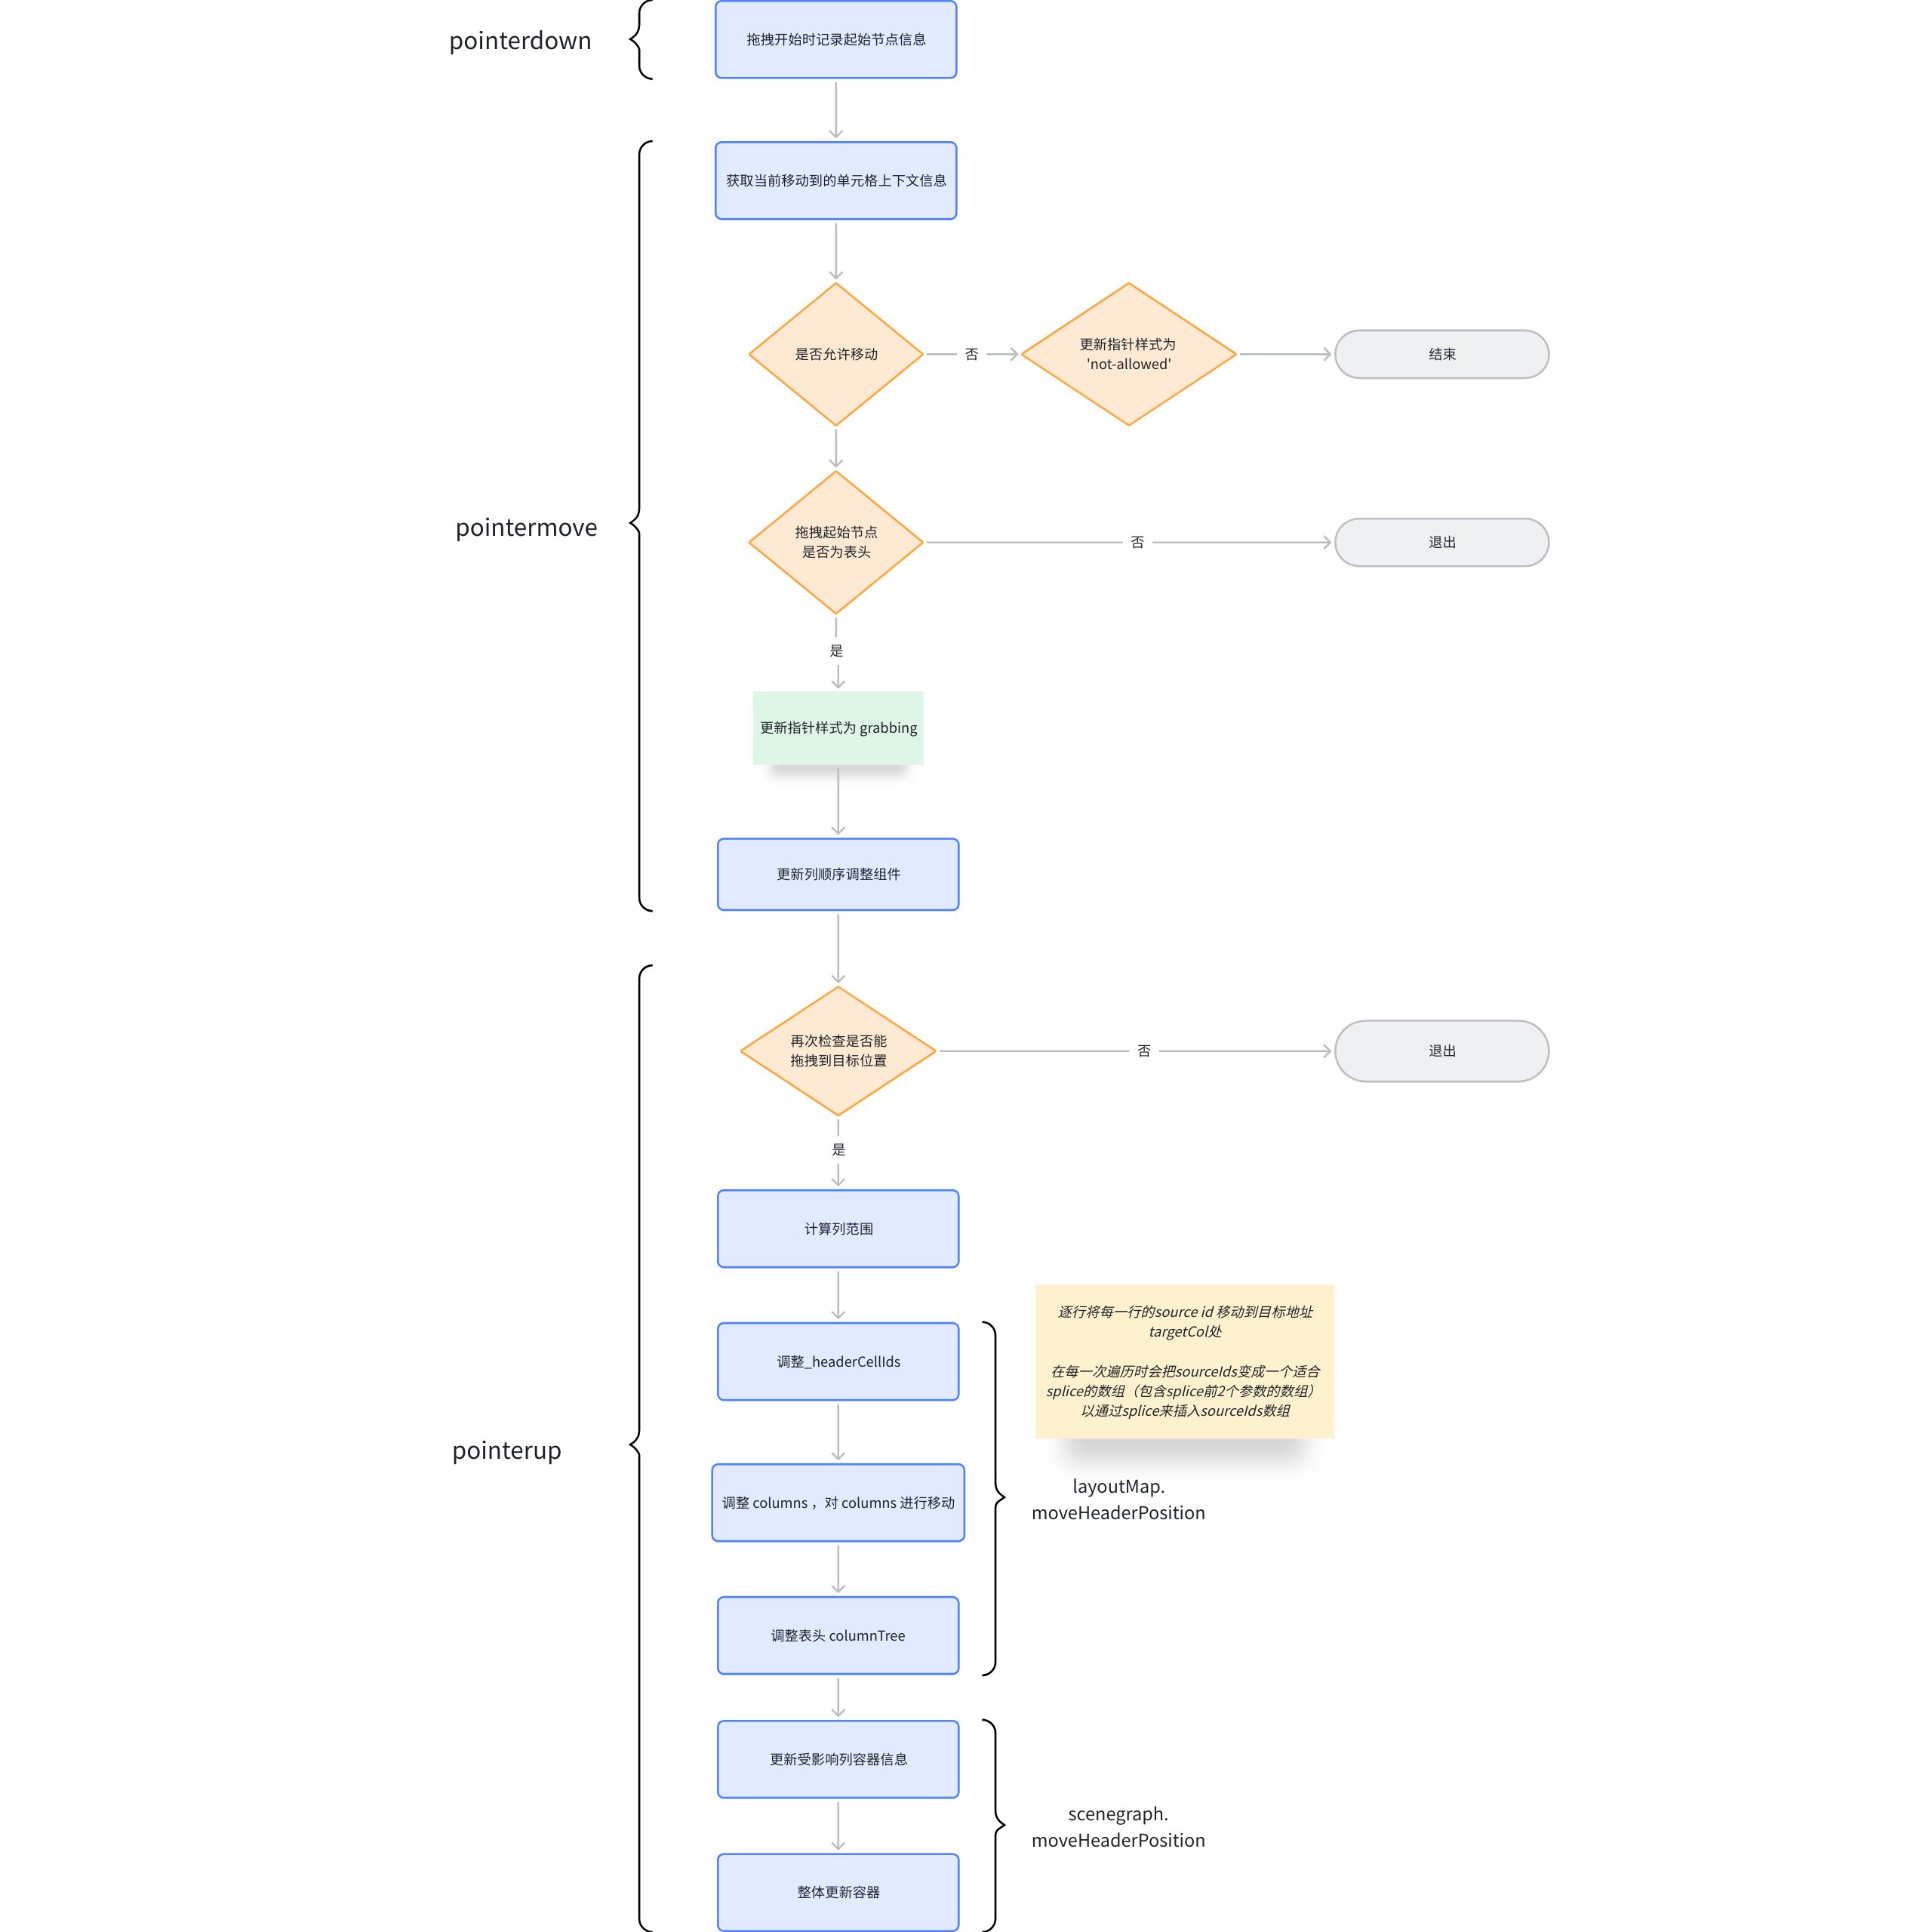
Unlike the callback for dragging to adjust column width, the style update for column drag-and-drop rearrangement is done in the pointermove event callback of the tableGroup. The actual update occurs in the pointerup event.
_headerCellIds Update Mechanism
When the drag event is completed, _headerCellIds will be dynamically updated. The update logic here is quite complex. Let's take B1 -> B2 as an example to see how the update of _headerCellIds is completed.
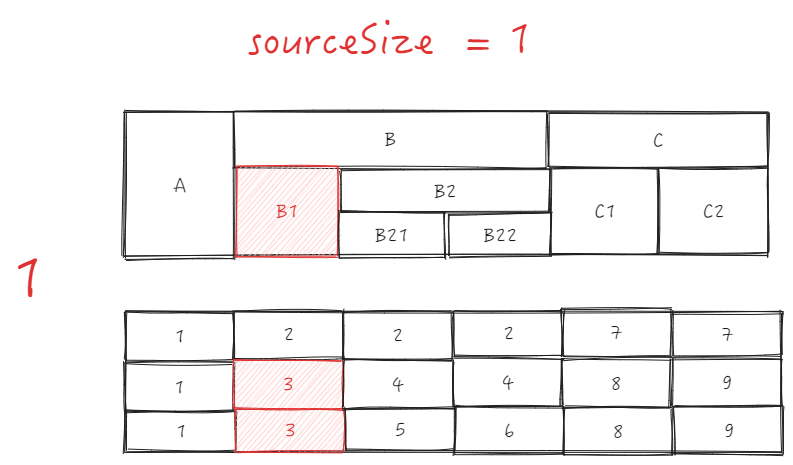
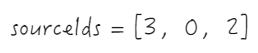
First, obtain the number of columns contained in the starting cell according to sourceCellRange, sourceSize; \r
Get the column targetIndex for the insertion target address. Here, two situations need to be considered:
The target column is to the left of the starting column, targetIndex = targetCellRange.start.col; \r
The target column is to the right of the starting column, targetIndex = targetCellRange.end.col - sourceSize + 1;
In this case, targetIndex = 3 - 1 + 1 = 3;
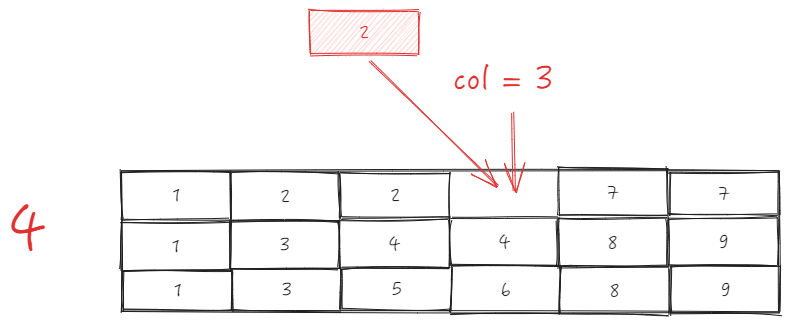
Traverse _headerCellIds line by line
First line: \r
_headerCellIds The first row, from the beginning column of sourceCellRange, removes the length of sourceSize, and takes the removed elements as sourceIds \r
Then insert 0 and targetIndex at the beginning of sourceIds; \r
Call Array.prototype.splice.apply(this._headerCellIds[row], sourceIds); equivalent to this._headerCellIds[row].splice(3, 0, 2), after this step, _headerCellIds will be
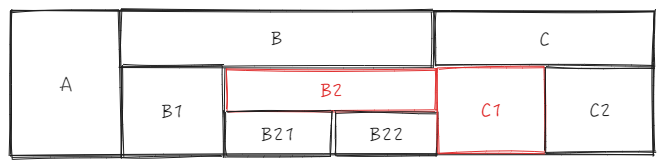
Abstracting to the chart, it is actually equivalent to moving all cells after sourceIndex forward, and then moving the starting cell to the targetIndex position.
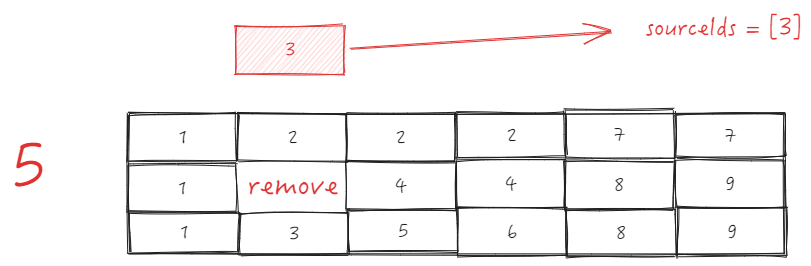
Second line
Extract sourceIds
Insert 0 and targetIndex
Insert sourceIds into targetIndex
Similarly, after updating the third line, the _headCellIds looks like this. At this point, the adjustment of the data index part for dragging and swapping columns is complete. \r
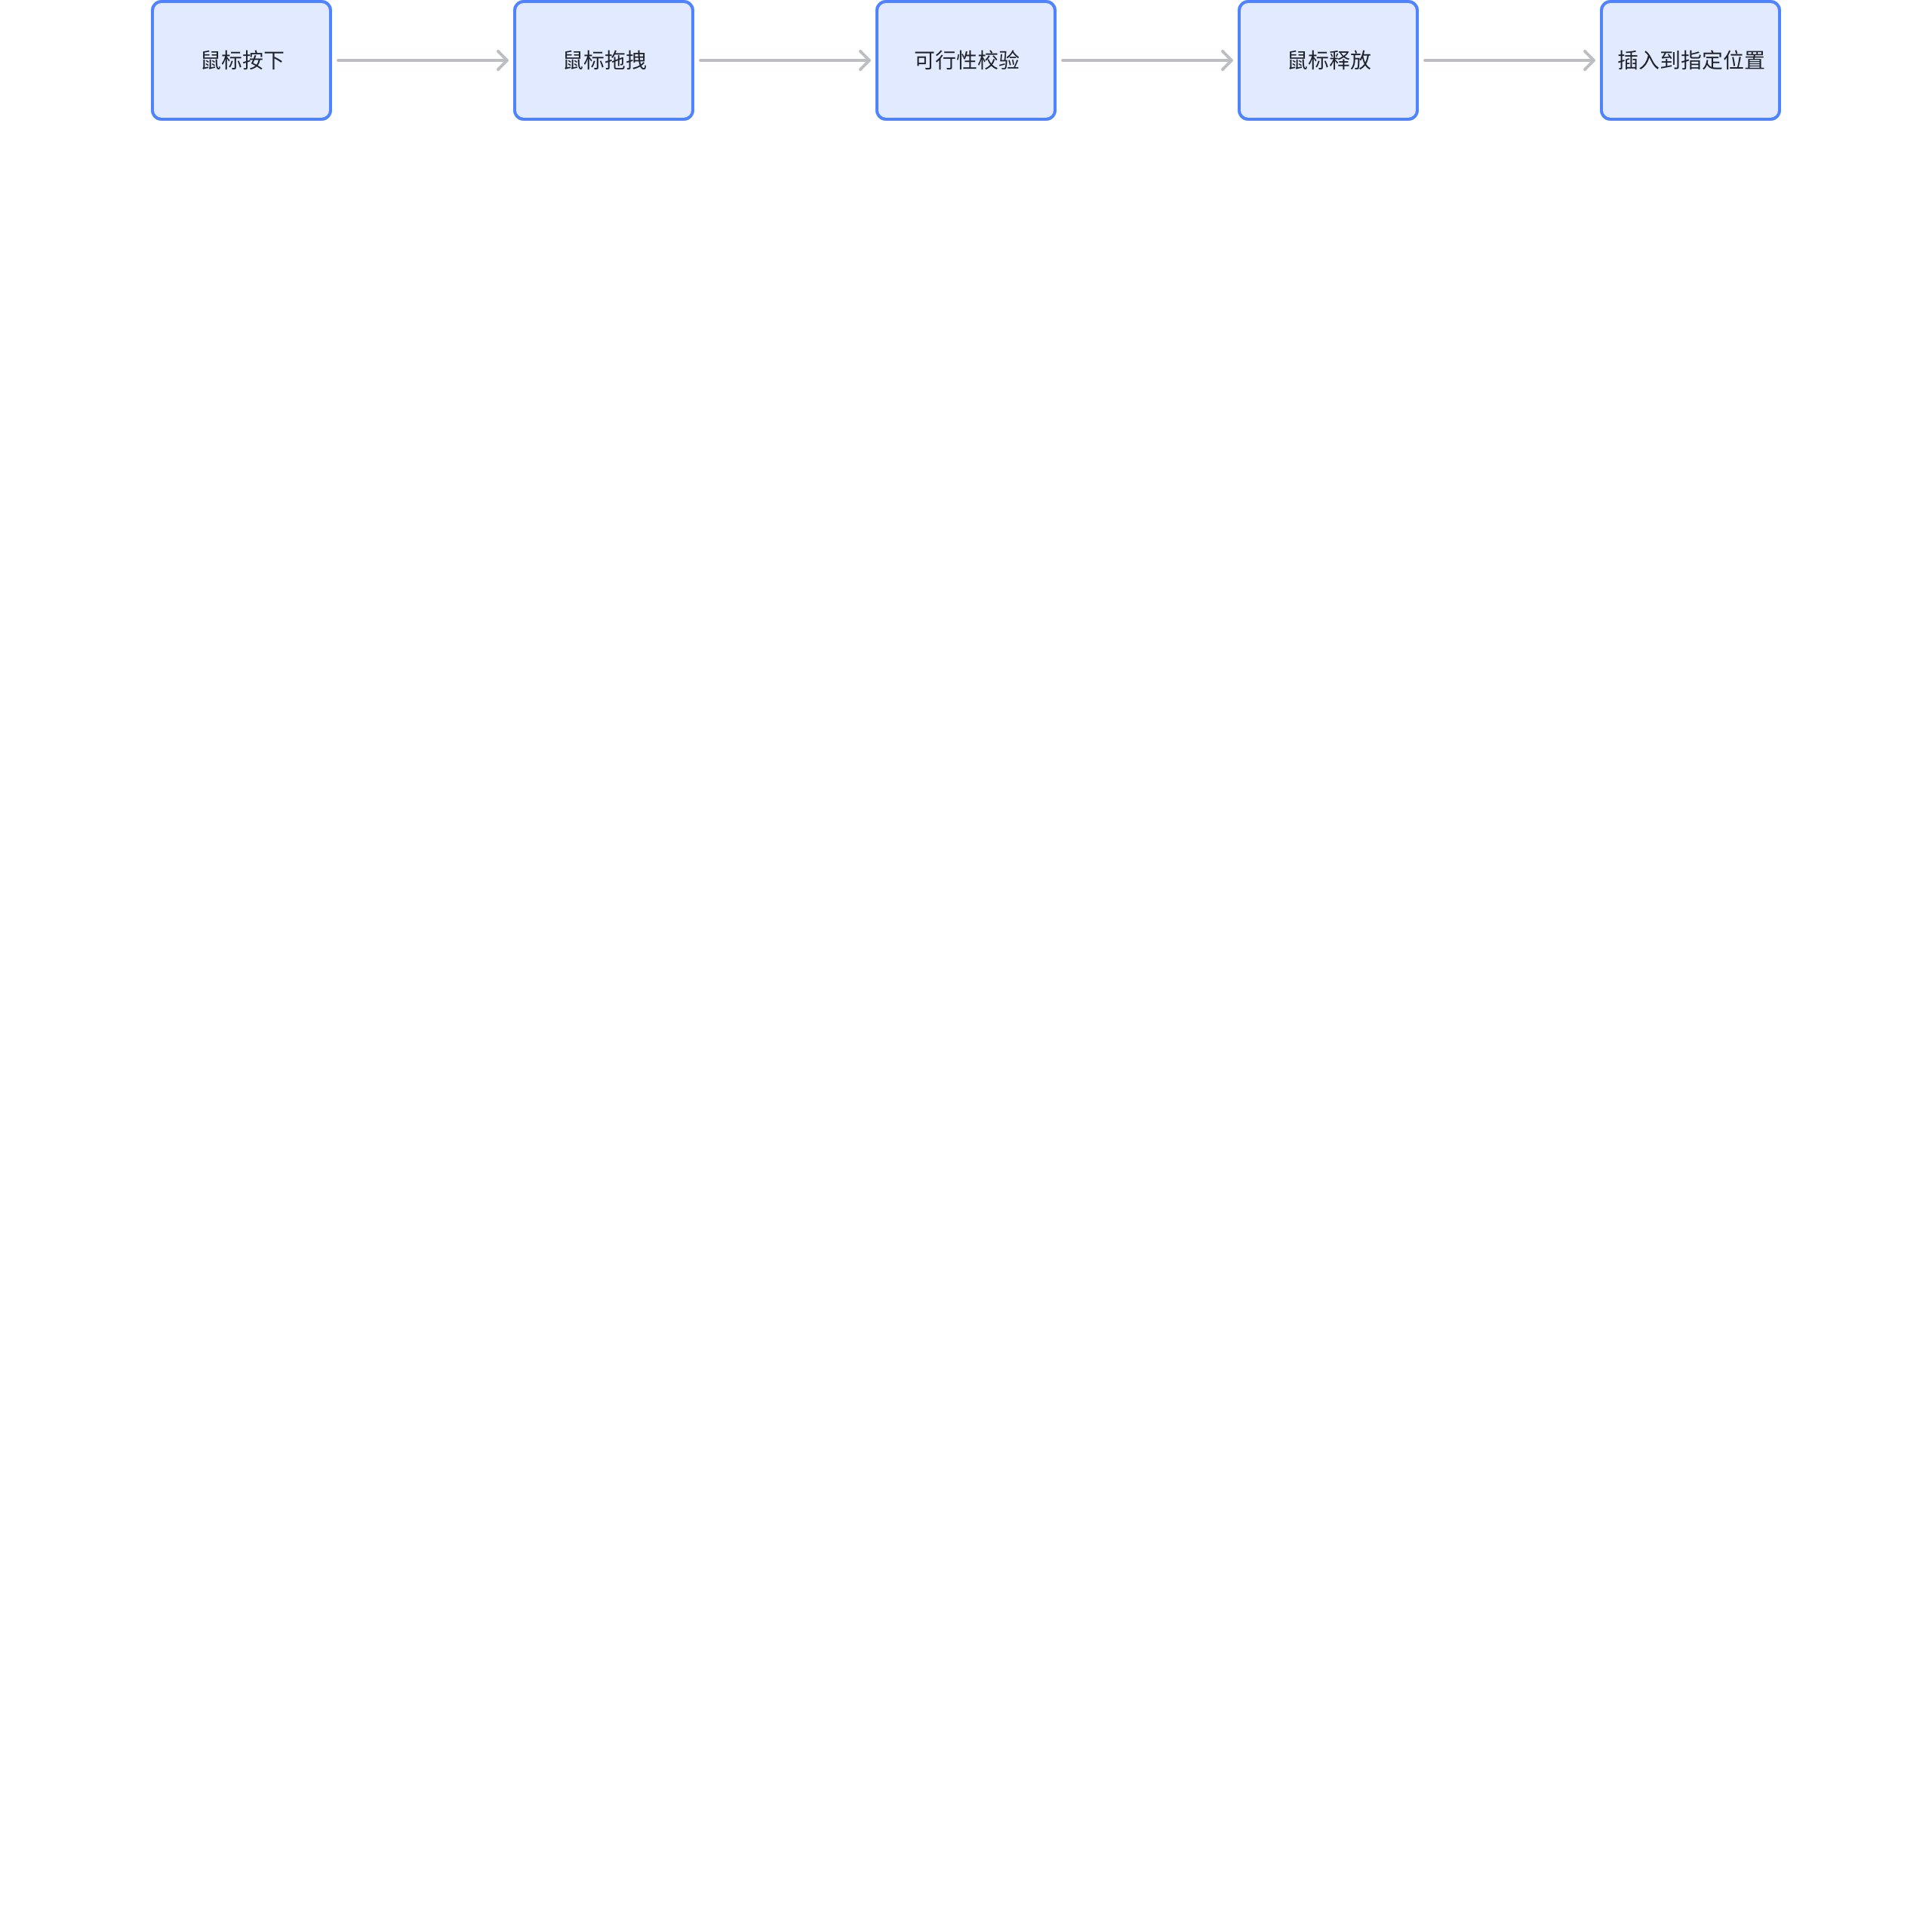
Overall General Process
Table Scrolling
Background of the Requirement
The native table component library can directly use the browser's built-in scrolling effect, whereas for Canvas, it does not automatically generate scroll bars, nor does it have corresponding scrolling logic, let alone create virtual scrolling effects like native DOM. All scrolling effects need to be manually calculated. Let's take a look at how ListTable achieves scrolling effects by listening to Canvas events.
Scrolling Scheme
ListTable supports two scrolling methods, namely dragging the scrollbar and using the mouse wheel. Essentially, these two scrolling methods are the same, with the difference being the trigger point: \r
Wheel Scrolling
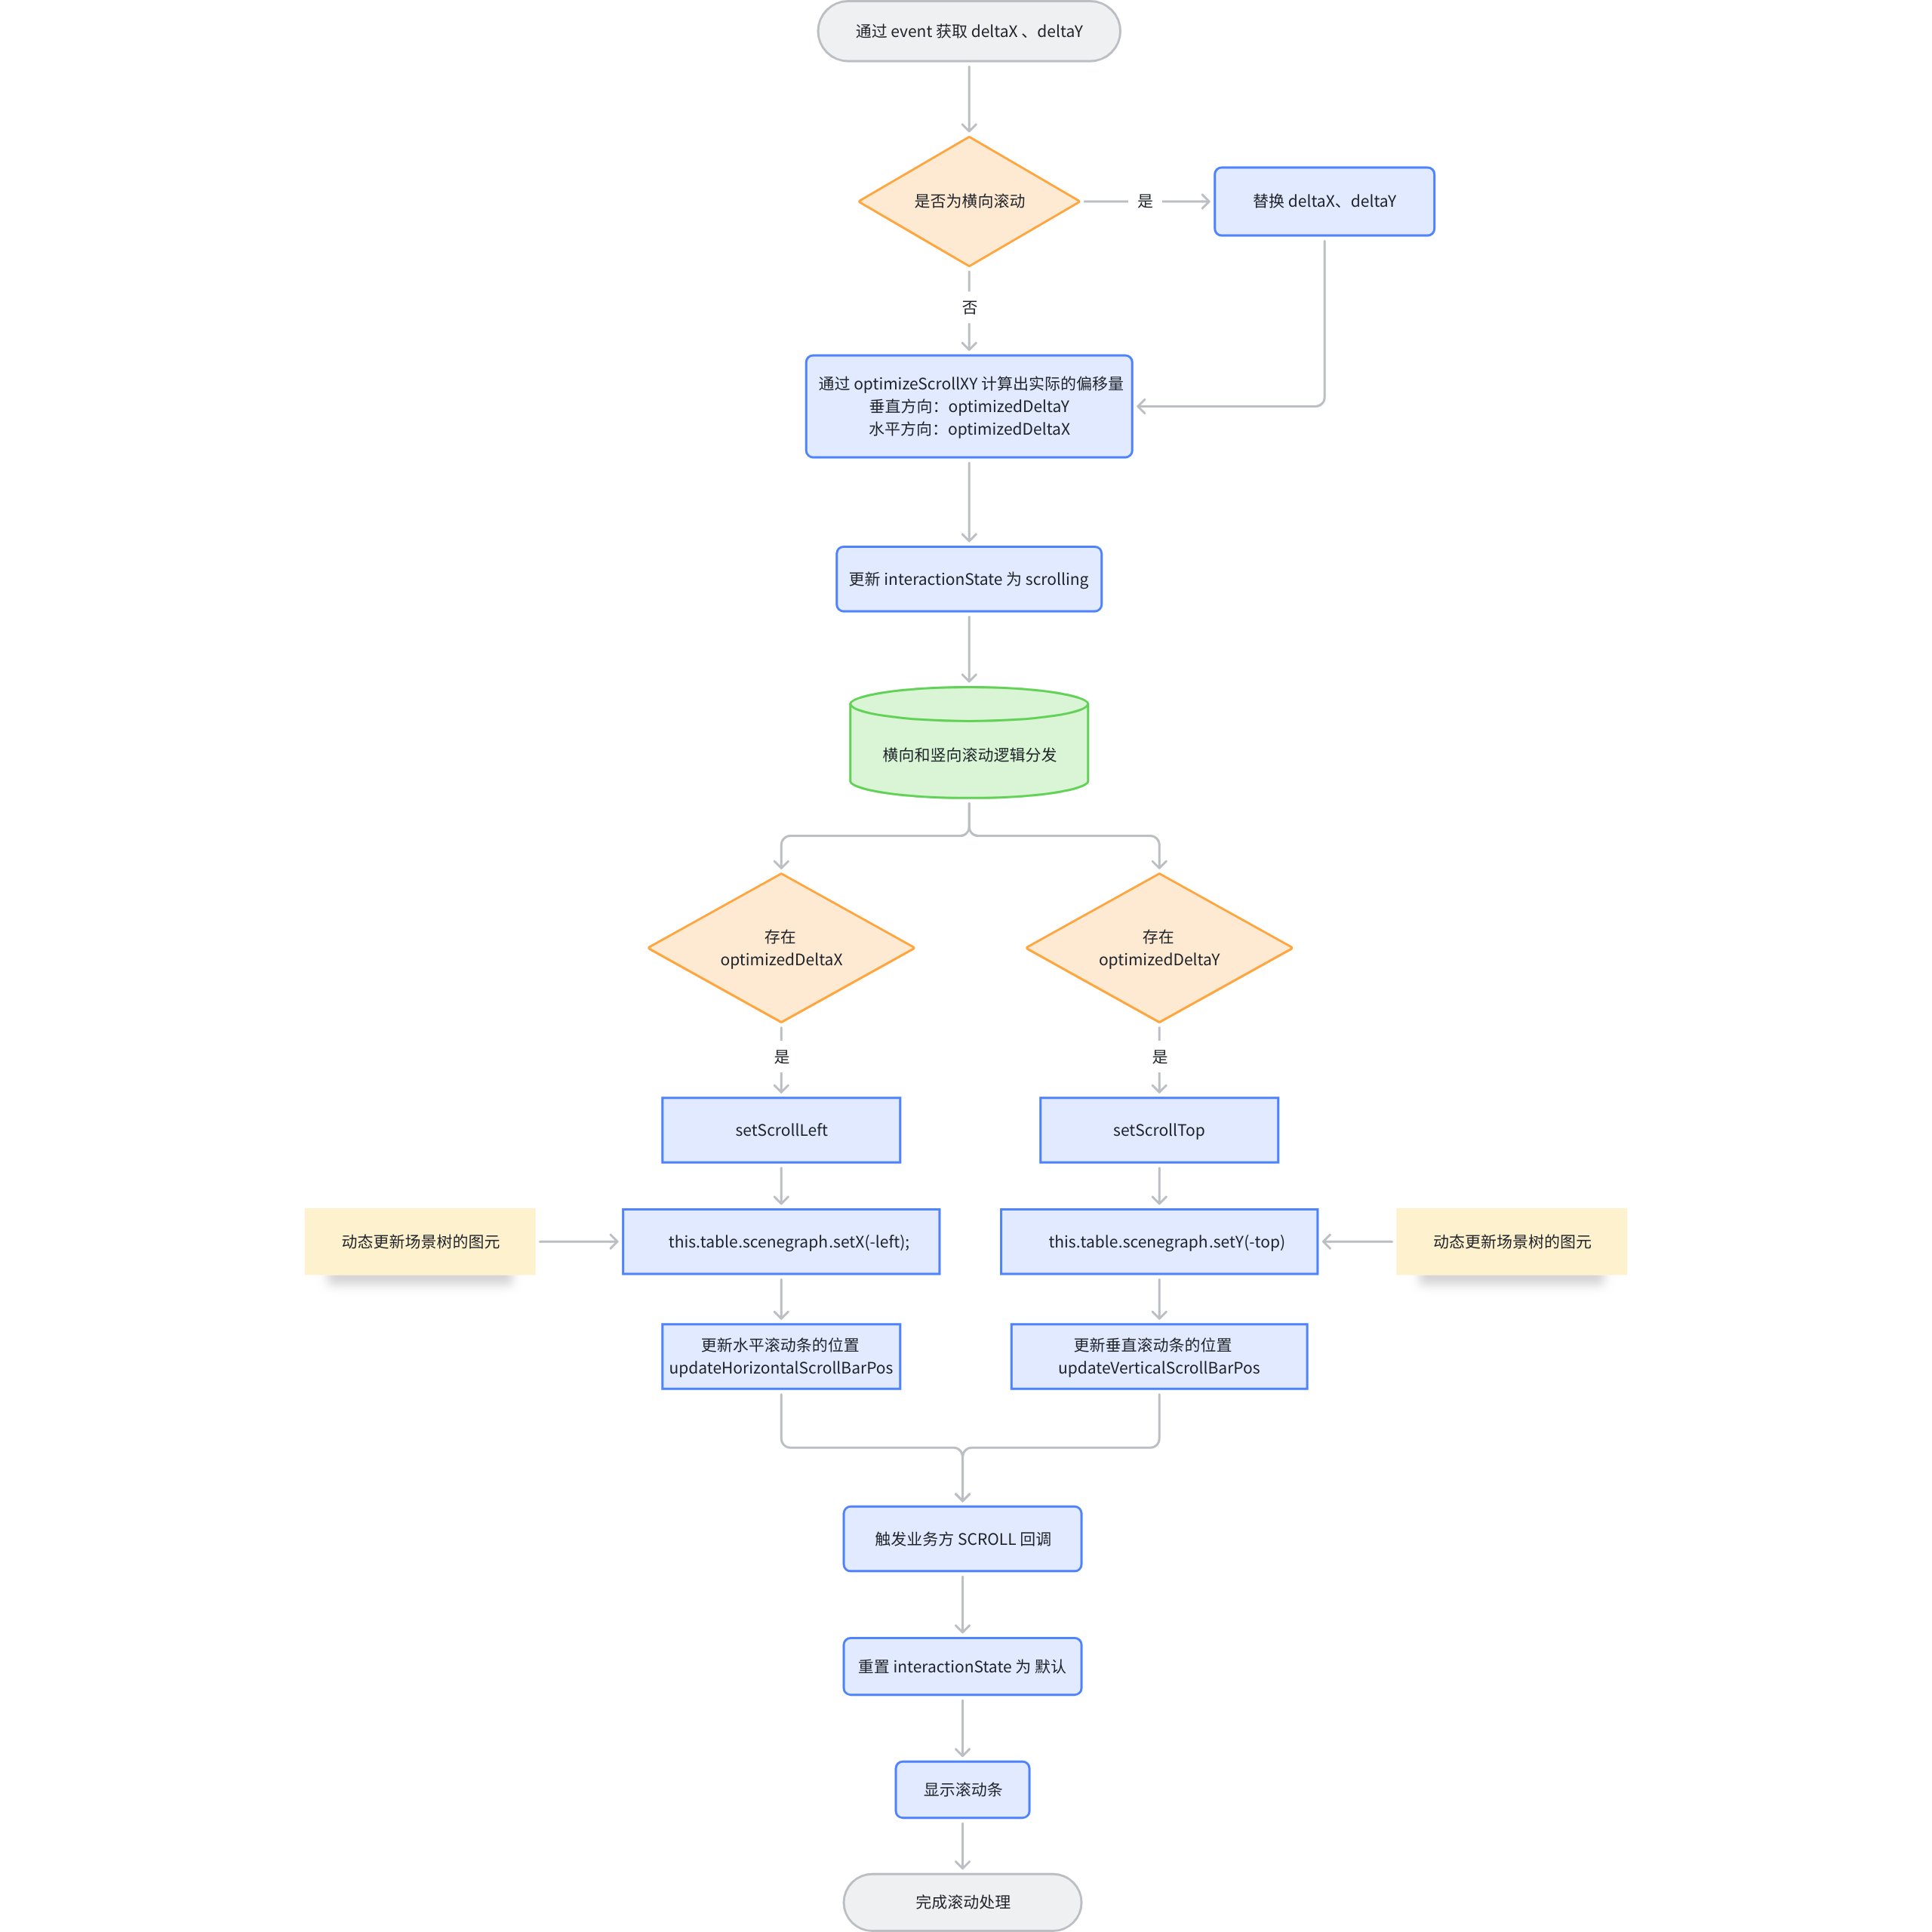
The scroll wheel relies on the wheel event provided by Stage, allowing you to obtain the current scroll offset during scrolling, and then progressively load table elements during the scrolling process. \r
Here is a general process about wheel scrolling: \r
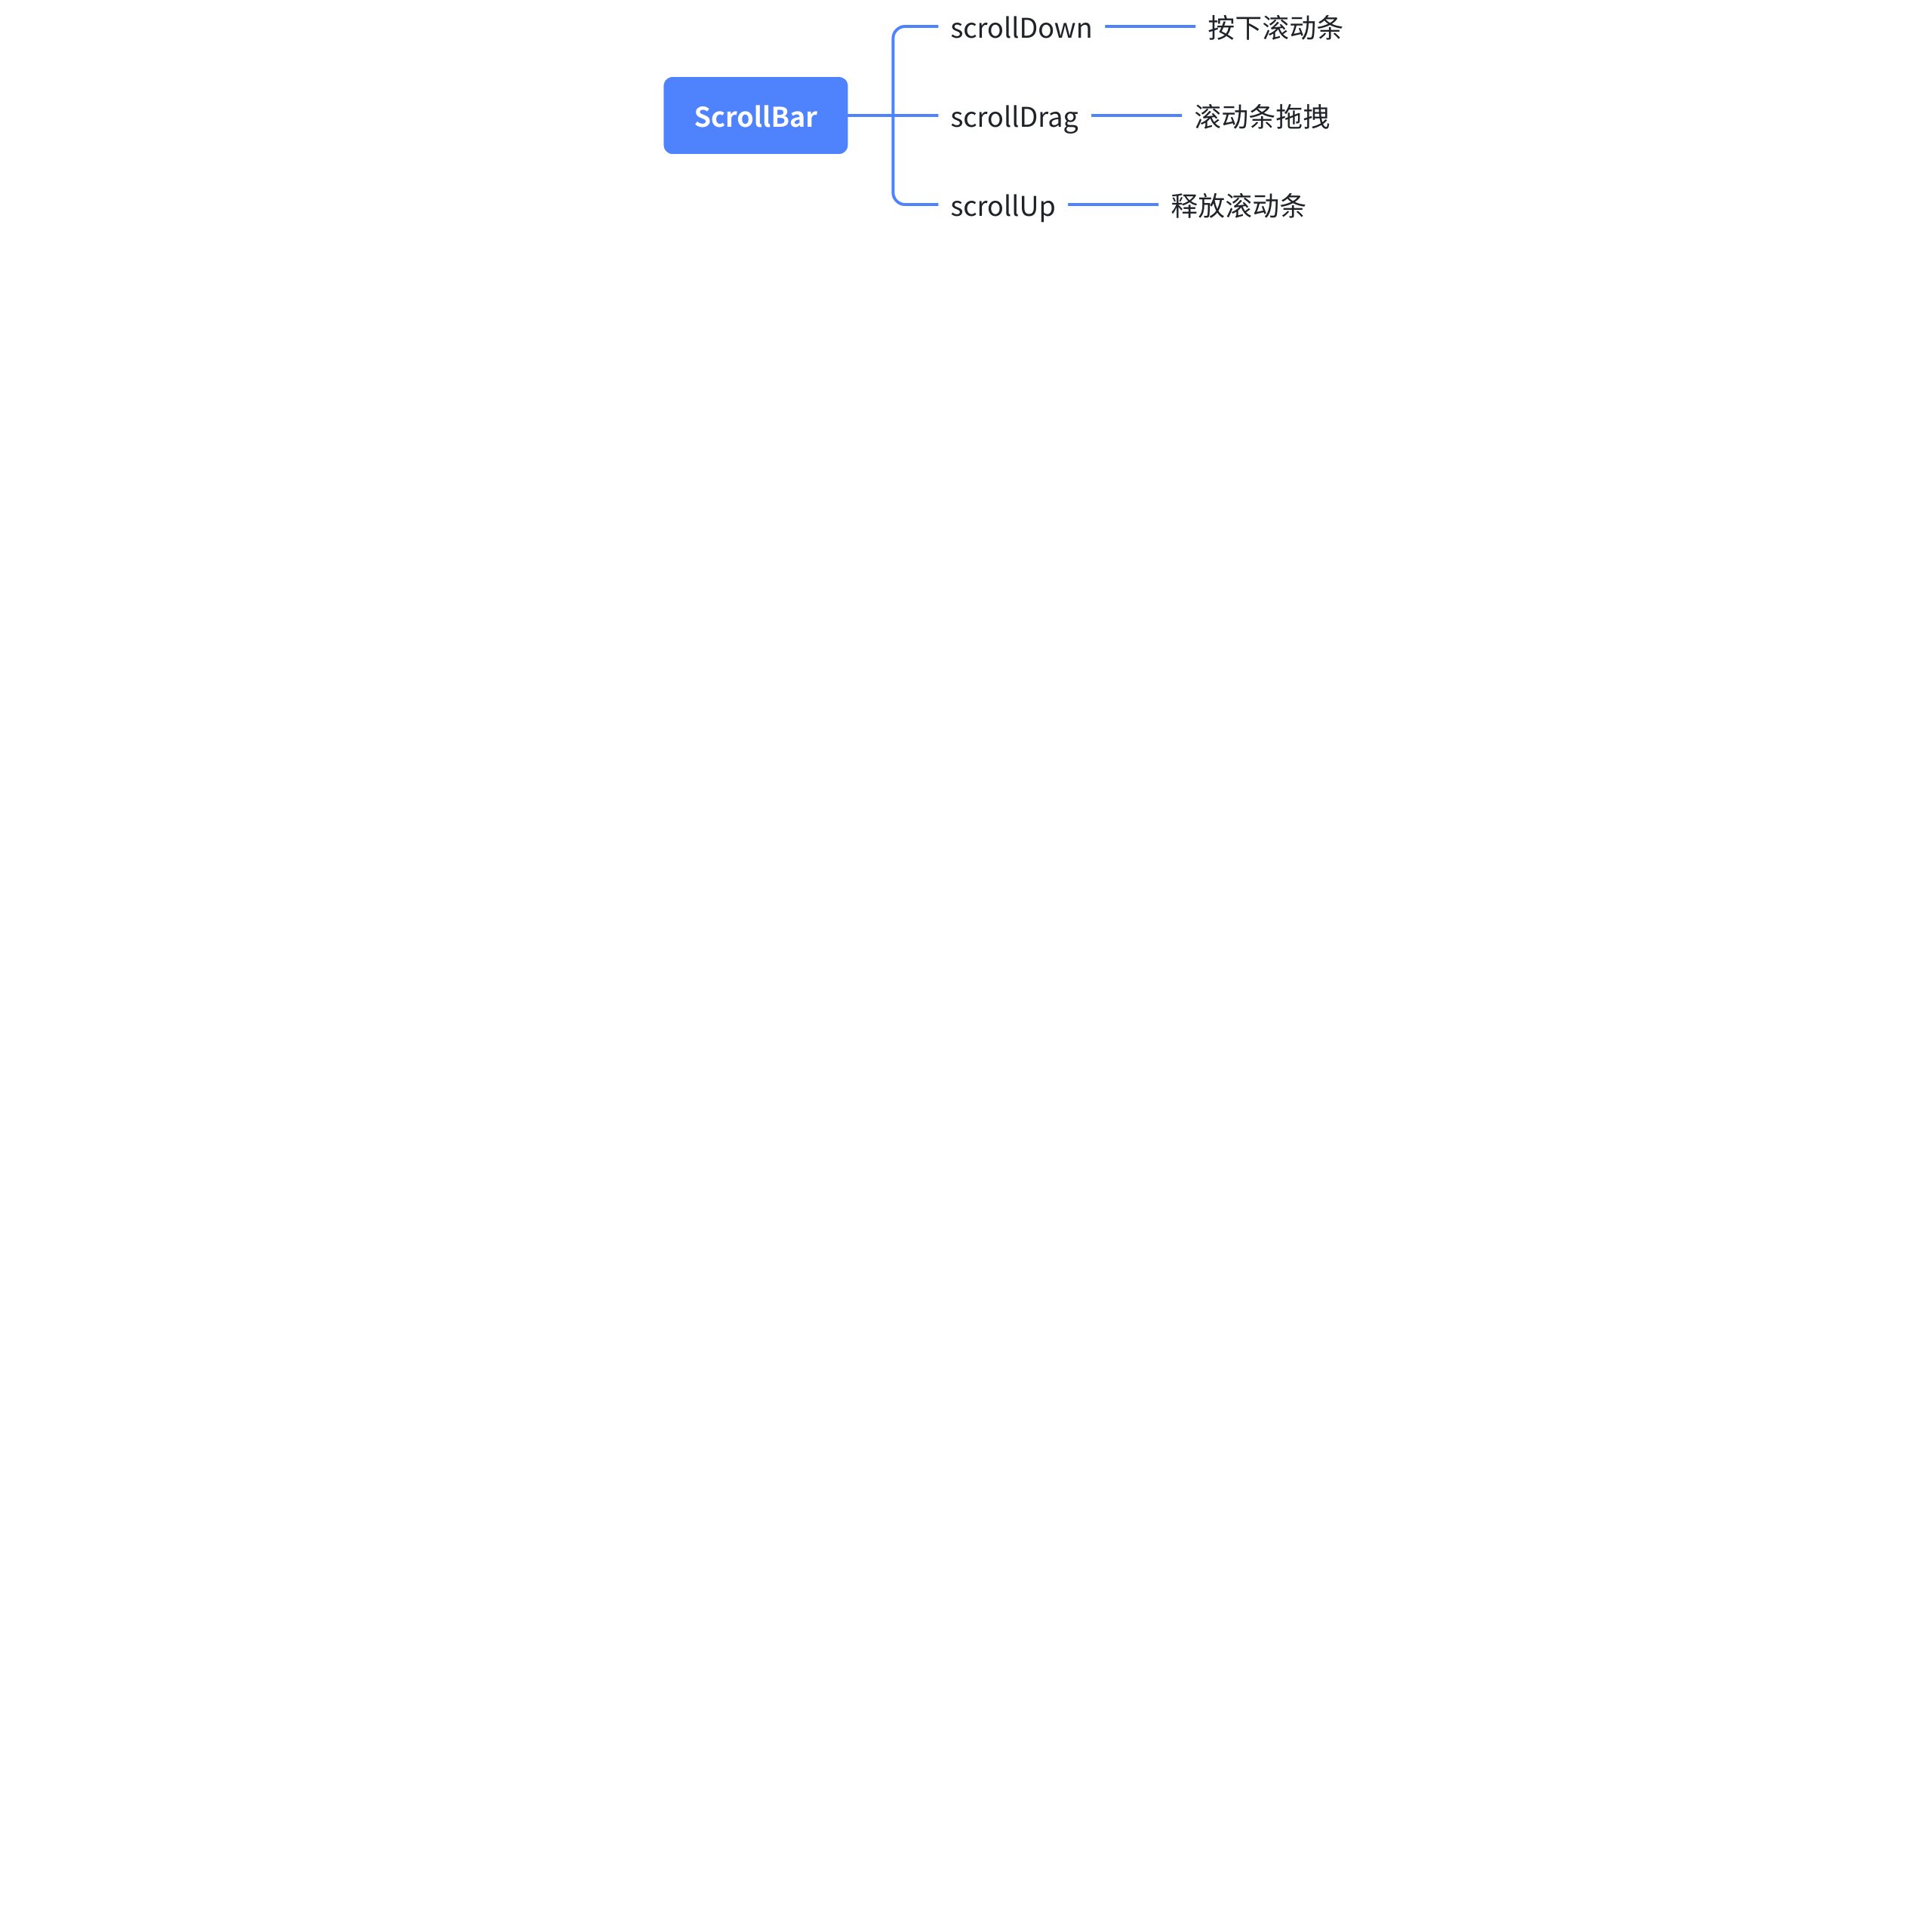
Drag the scrollbar
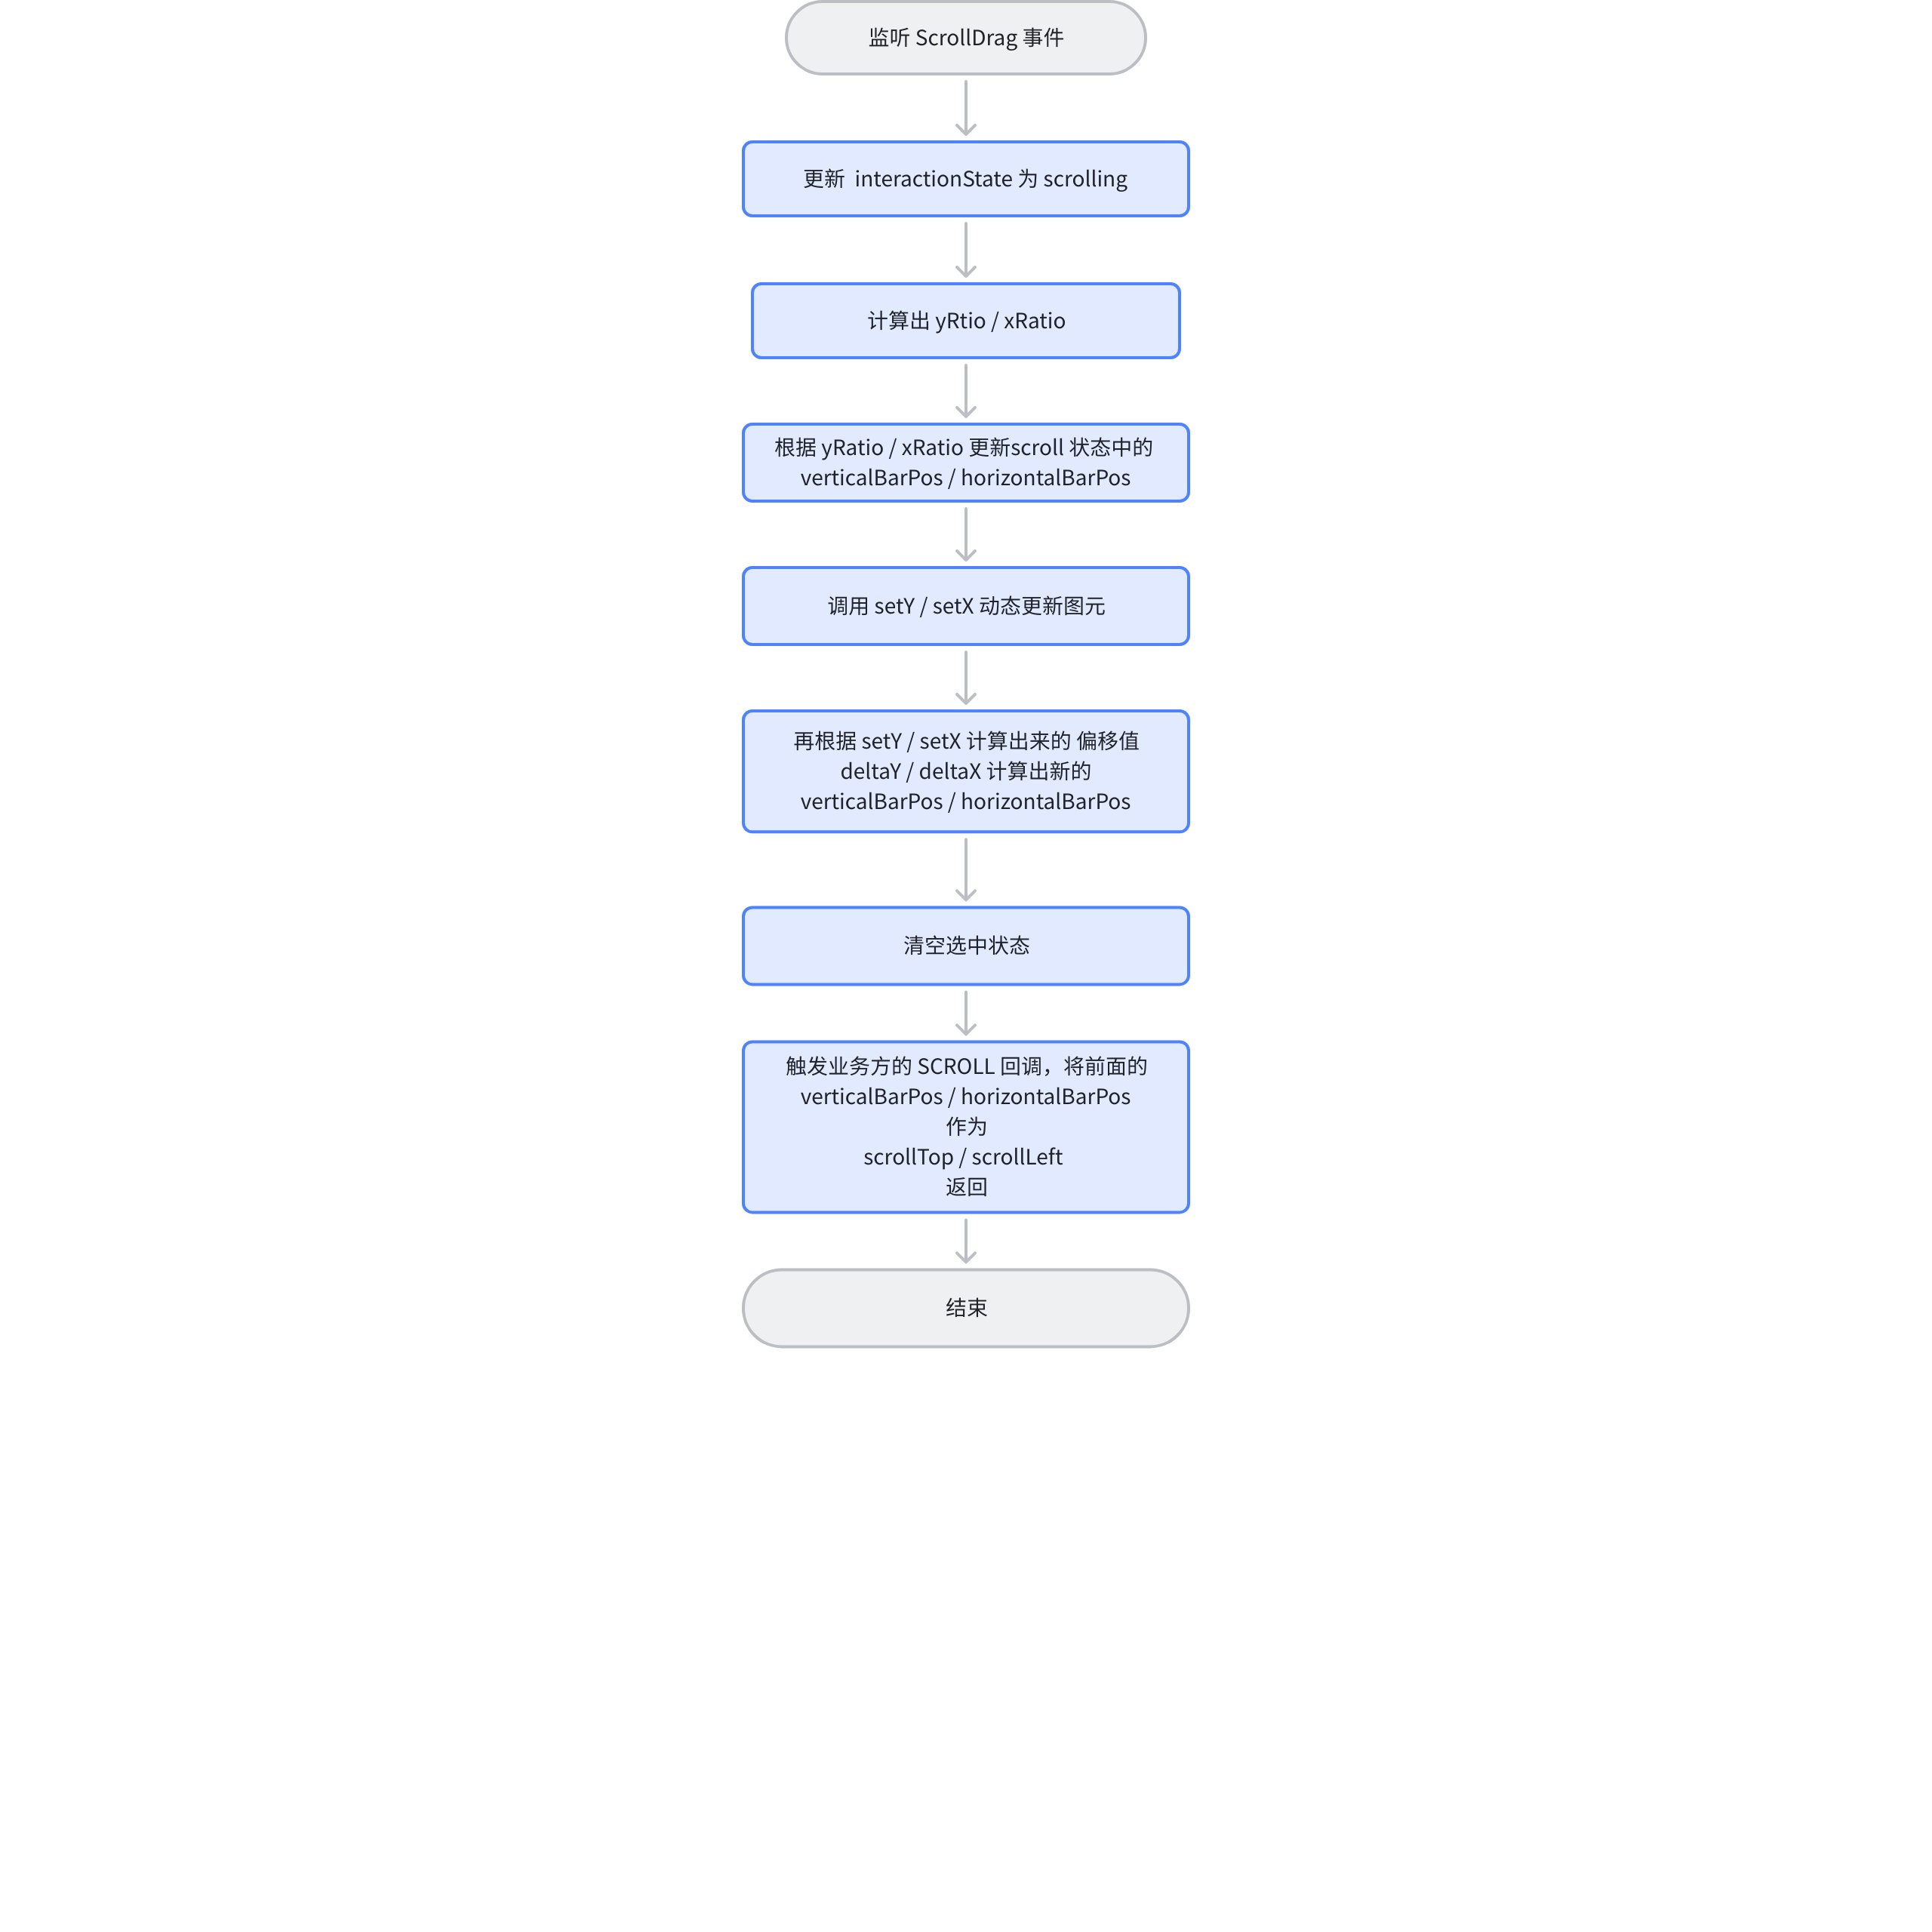
The scrollbar uses the ScrollBar component provided by VRender, and listens to the scroll event to complete the scrolling logic; the handling during the drag process is roughly the same as the logic of the mouse wheel scrolling, the core is to complete the progressive loading of the scene graph through this.table.scenegraph.setY;
Since the user manually drags the scrollbar to trigger it, there is no need to update the position of the scrollbar. Moreover, only one direction will exist at the same time, and the corresponding direction is already known before entering the logic.
Scroll Offset Optimization
During the process of wheel scrolling, there is a function optimizeScrollXY, which is mainly used to optimize the scrolling direction by converting near-horizontal or vertical scrolling into a single direction, avoiding the interference caused by diagonal scrolling.
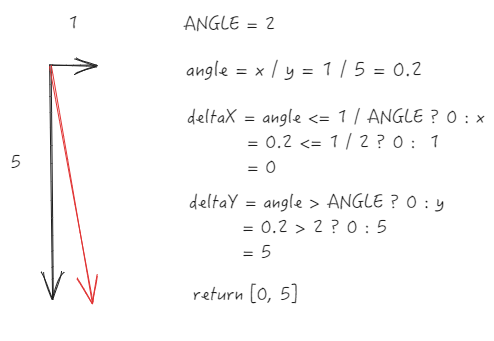
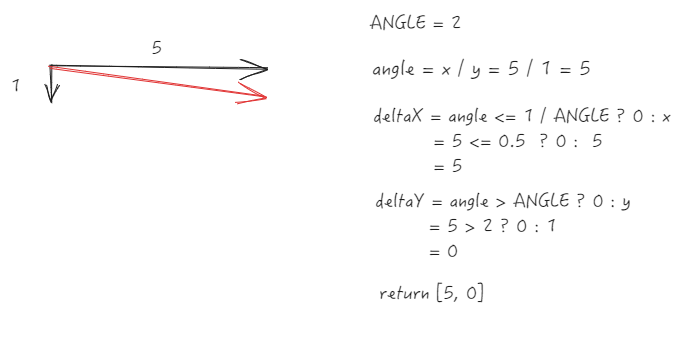
Formula
ANGLE = 2, defined as the slope threshold for direction determination \r
Obtain the slope angle through x ``/ y
Optimized deltaX = angle <= 1 / ANGLE ? 0 : x
Optimized deltaY = angle > ANGLE ? 0 : y
Core Processing
When the absolute value of x/y is less than or equal to 0.5 (i.e., 1/ANGLE), it is considered vertical scrolling, and the horizontal increment is cleared.
When the absolute value of x/y is greater than 2 (i.e., ANGLE), it is considered horizontal scrolling, and the vertical increment is cleared
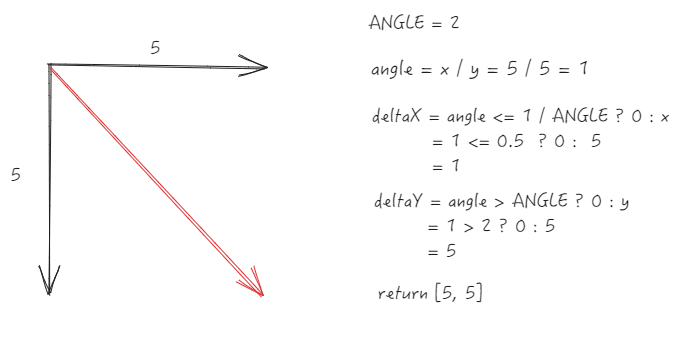
The intermediate angle retains the original increment (considered as diagonal scrolling)
Simply put, only those with a slope between 0.5 and 2 will retain their original values; otherwise, they will all be reset to a single direction.
Case
Let's look at how optimizeScrollXY is optimized through the following case studies.
Significant vertical scrolling (y-direction increment is much greater than x)
Reset to vertical scrolling
Significant horizontal scrolling (x-direction increment is much greater than y)
Reset to horizontal scrolling
45-degree diagonal scroll (x/y=1)
Preserve original value \r
Progressive Loading
Since the smoothness of ListTable scrolling is reflected in the frame rate, the more frames that can be displayed in one second, the smoother the table scrolls. To increase the frame rate, it is necessary to optimize data processing during scrolling to ensure more frames can be used to re-render the chart. For this reason, ListTable implements progressive loading for scrolling. During scrolling, it does not simply adjust the x and y coordinates but achieves scrolling by dynamically adjusting the cells. Let's take a look at how ListTable specifically implements this: \r
Entry File
The previously mentioned setY and setX methods are the core logic for implementing scrolling in the table. The entry points for these two methods are in the scenegraph module, where they actually call the setX and setY methods in SceneProxy. \r
Regarding the SceneProxy module, it is a submodule of SceneGraph and is created during the initialization of SceneGraph. This module is mainly responsible for calculating the maximum number of rows and columns of the scene tree, progressive loading of the scene tree, and the logic for creating the first screen group. \r
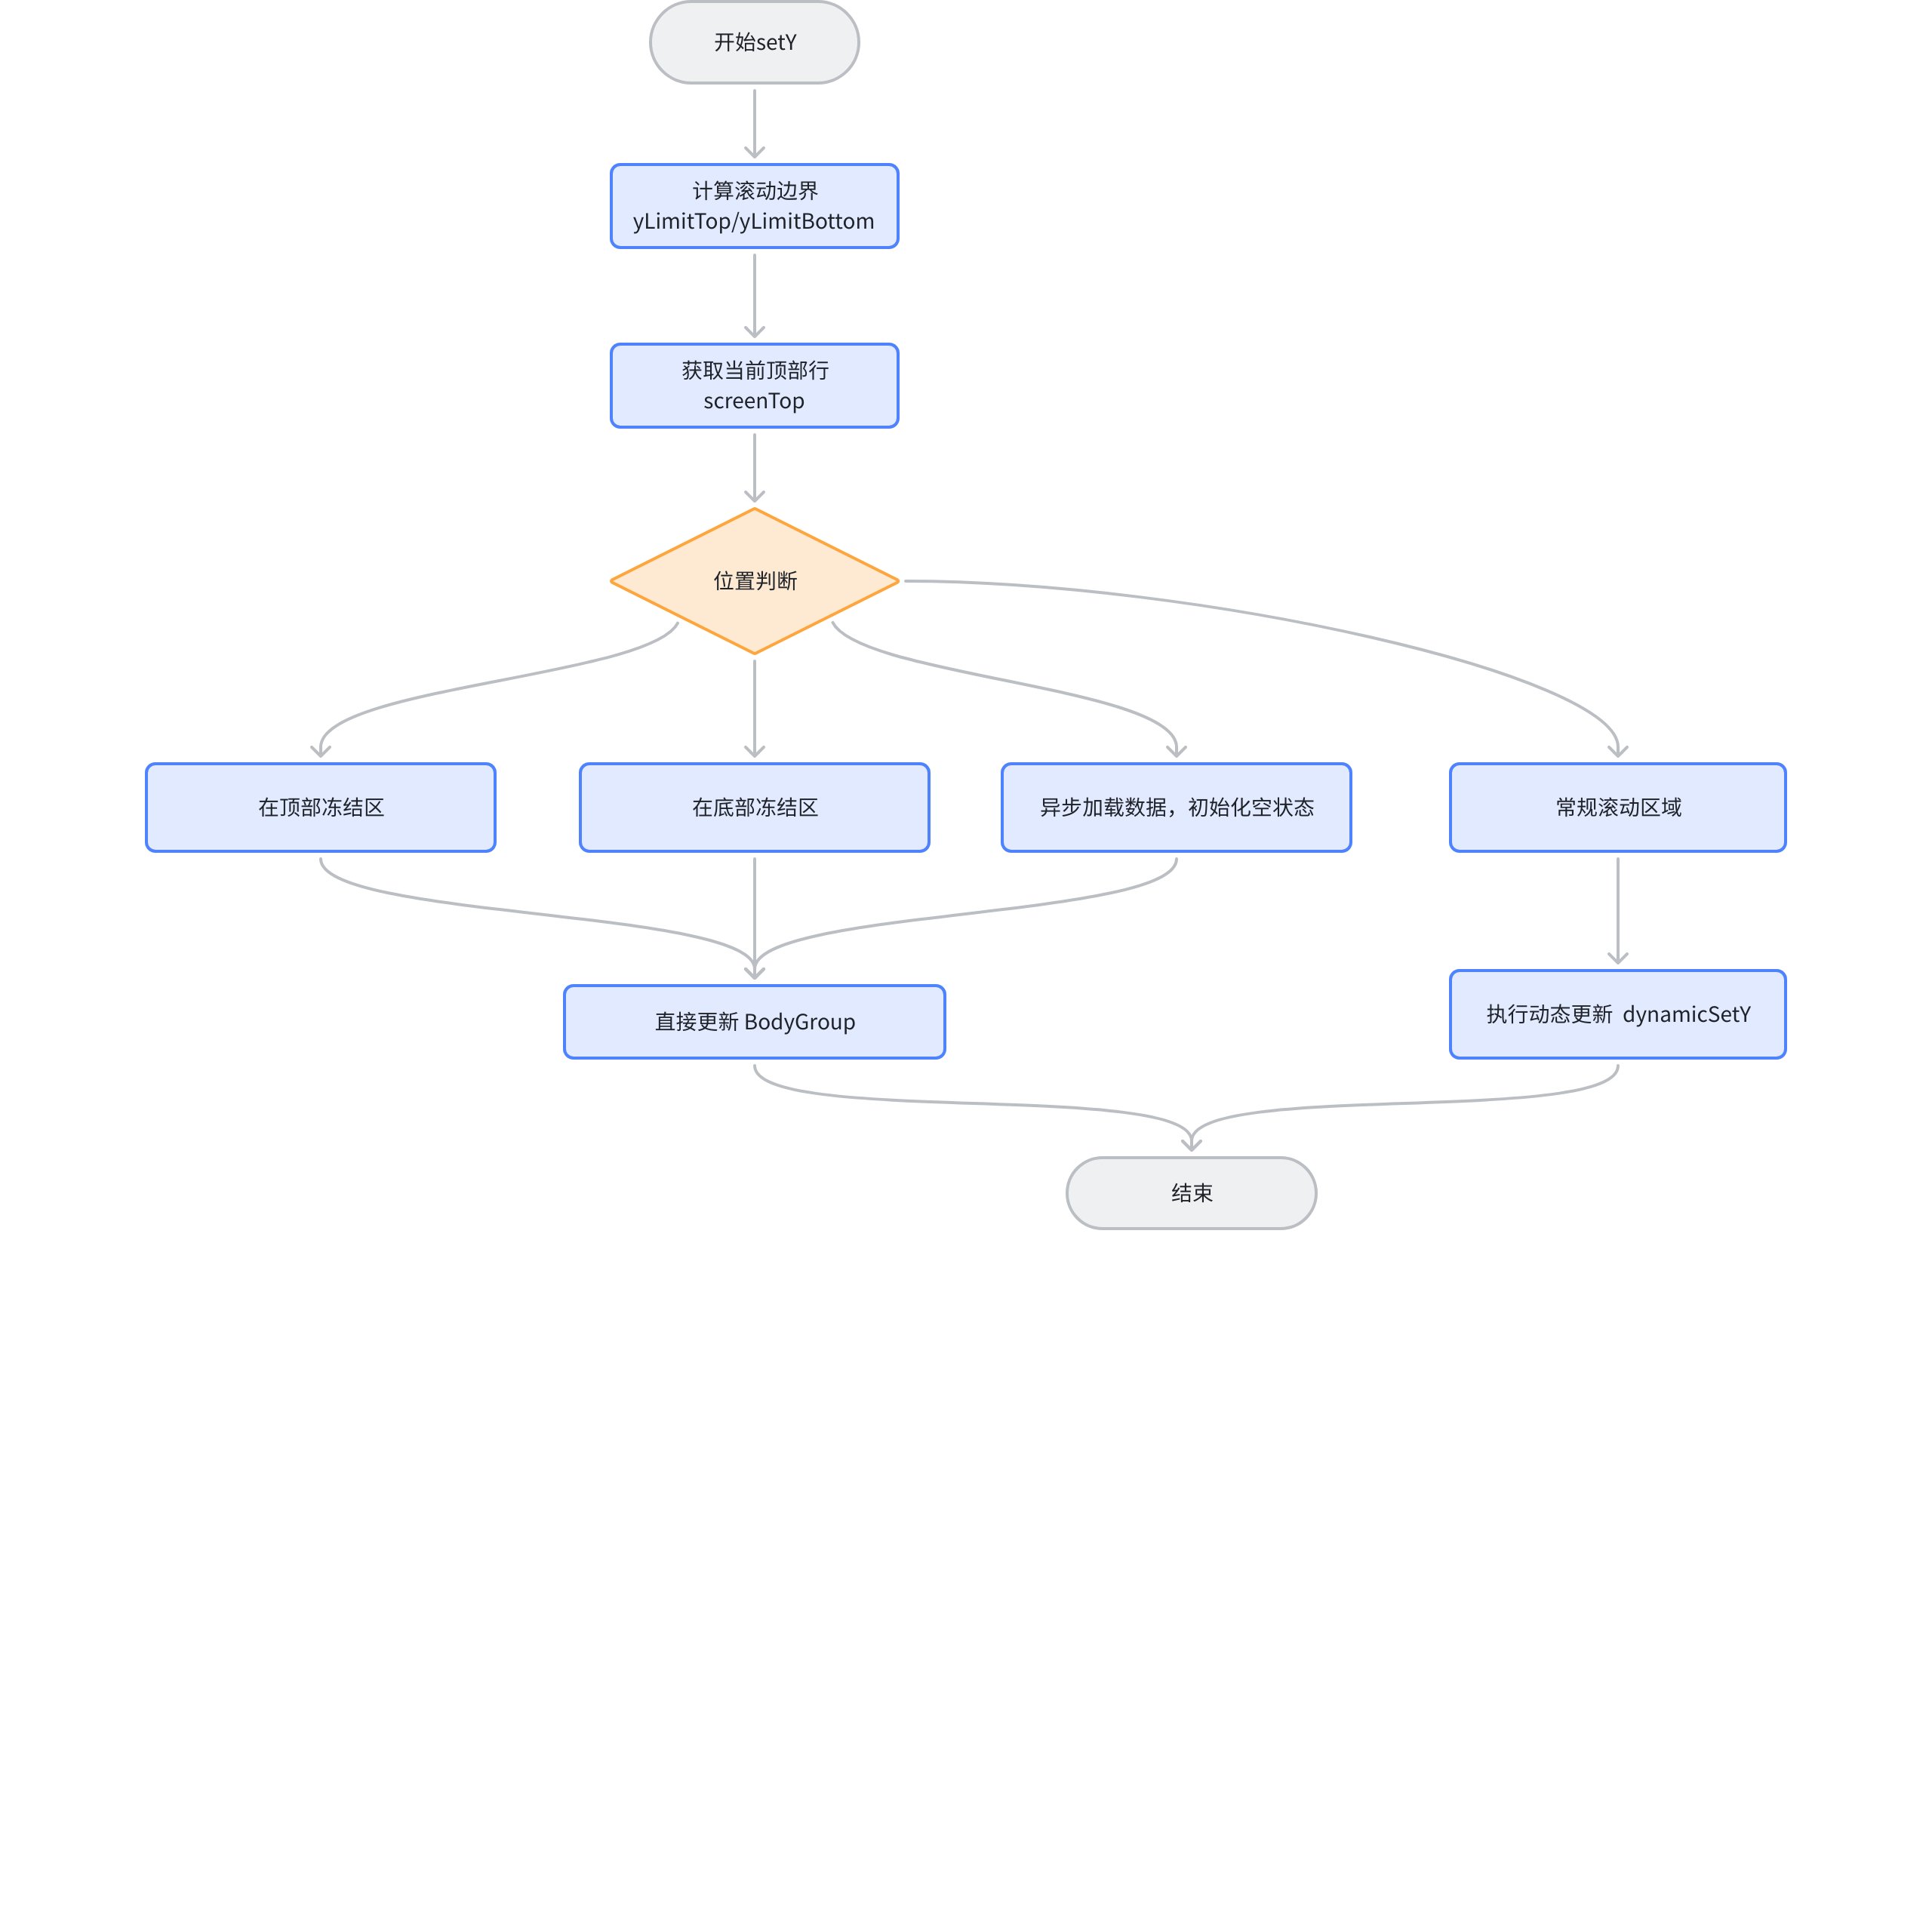
Let's take setY as an example, here is the flowchart of setY: \r
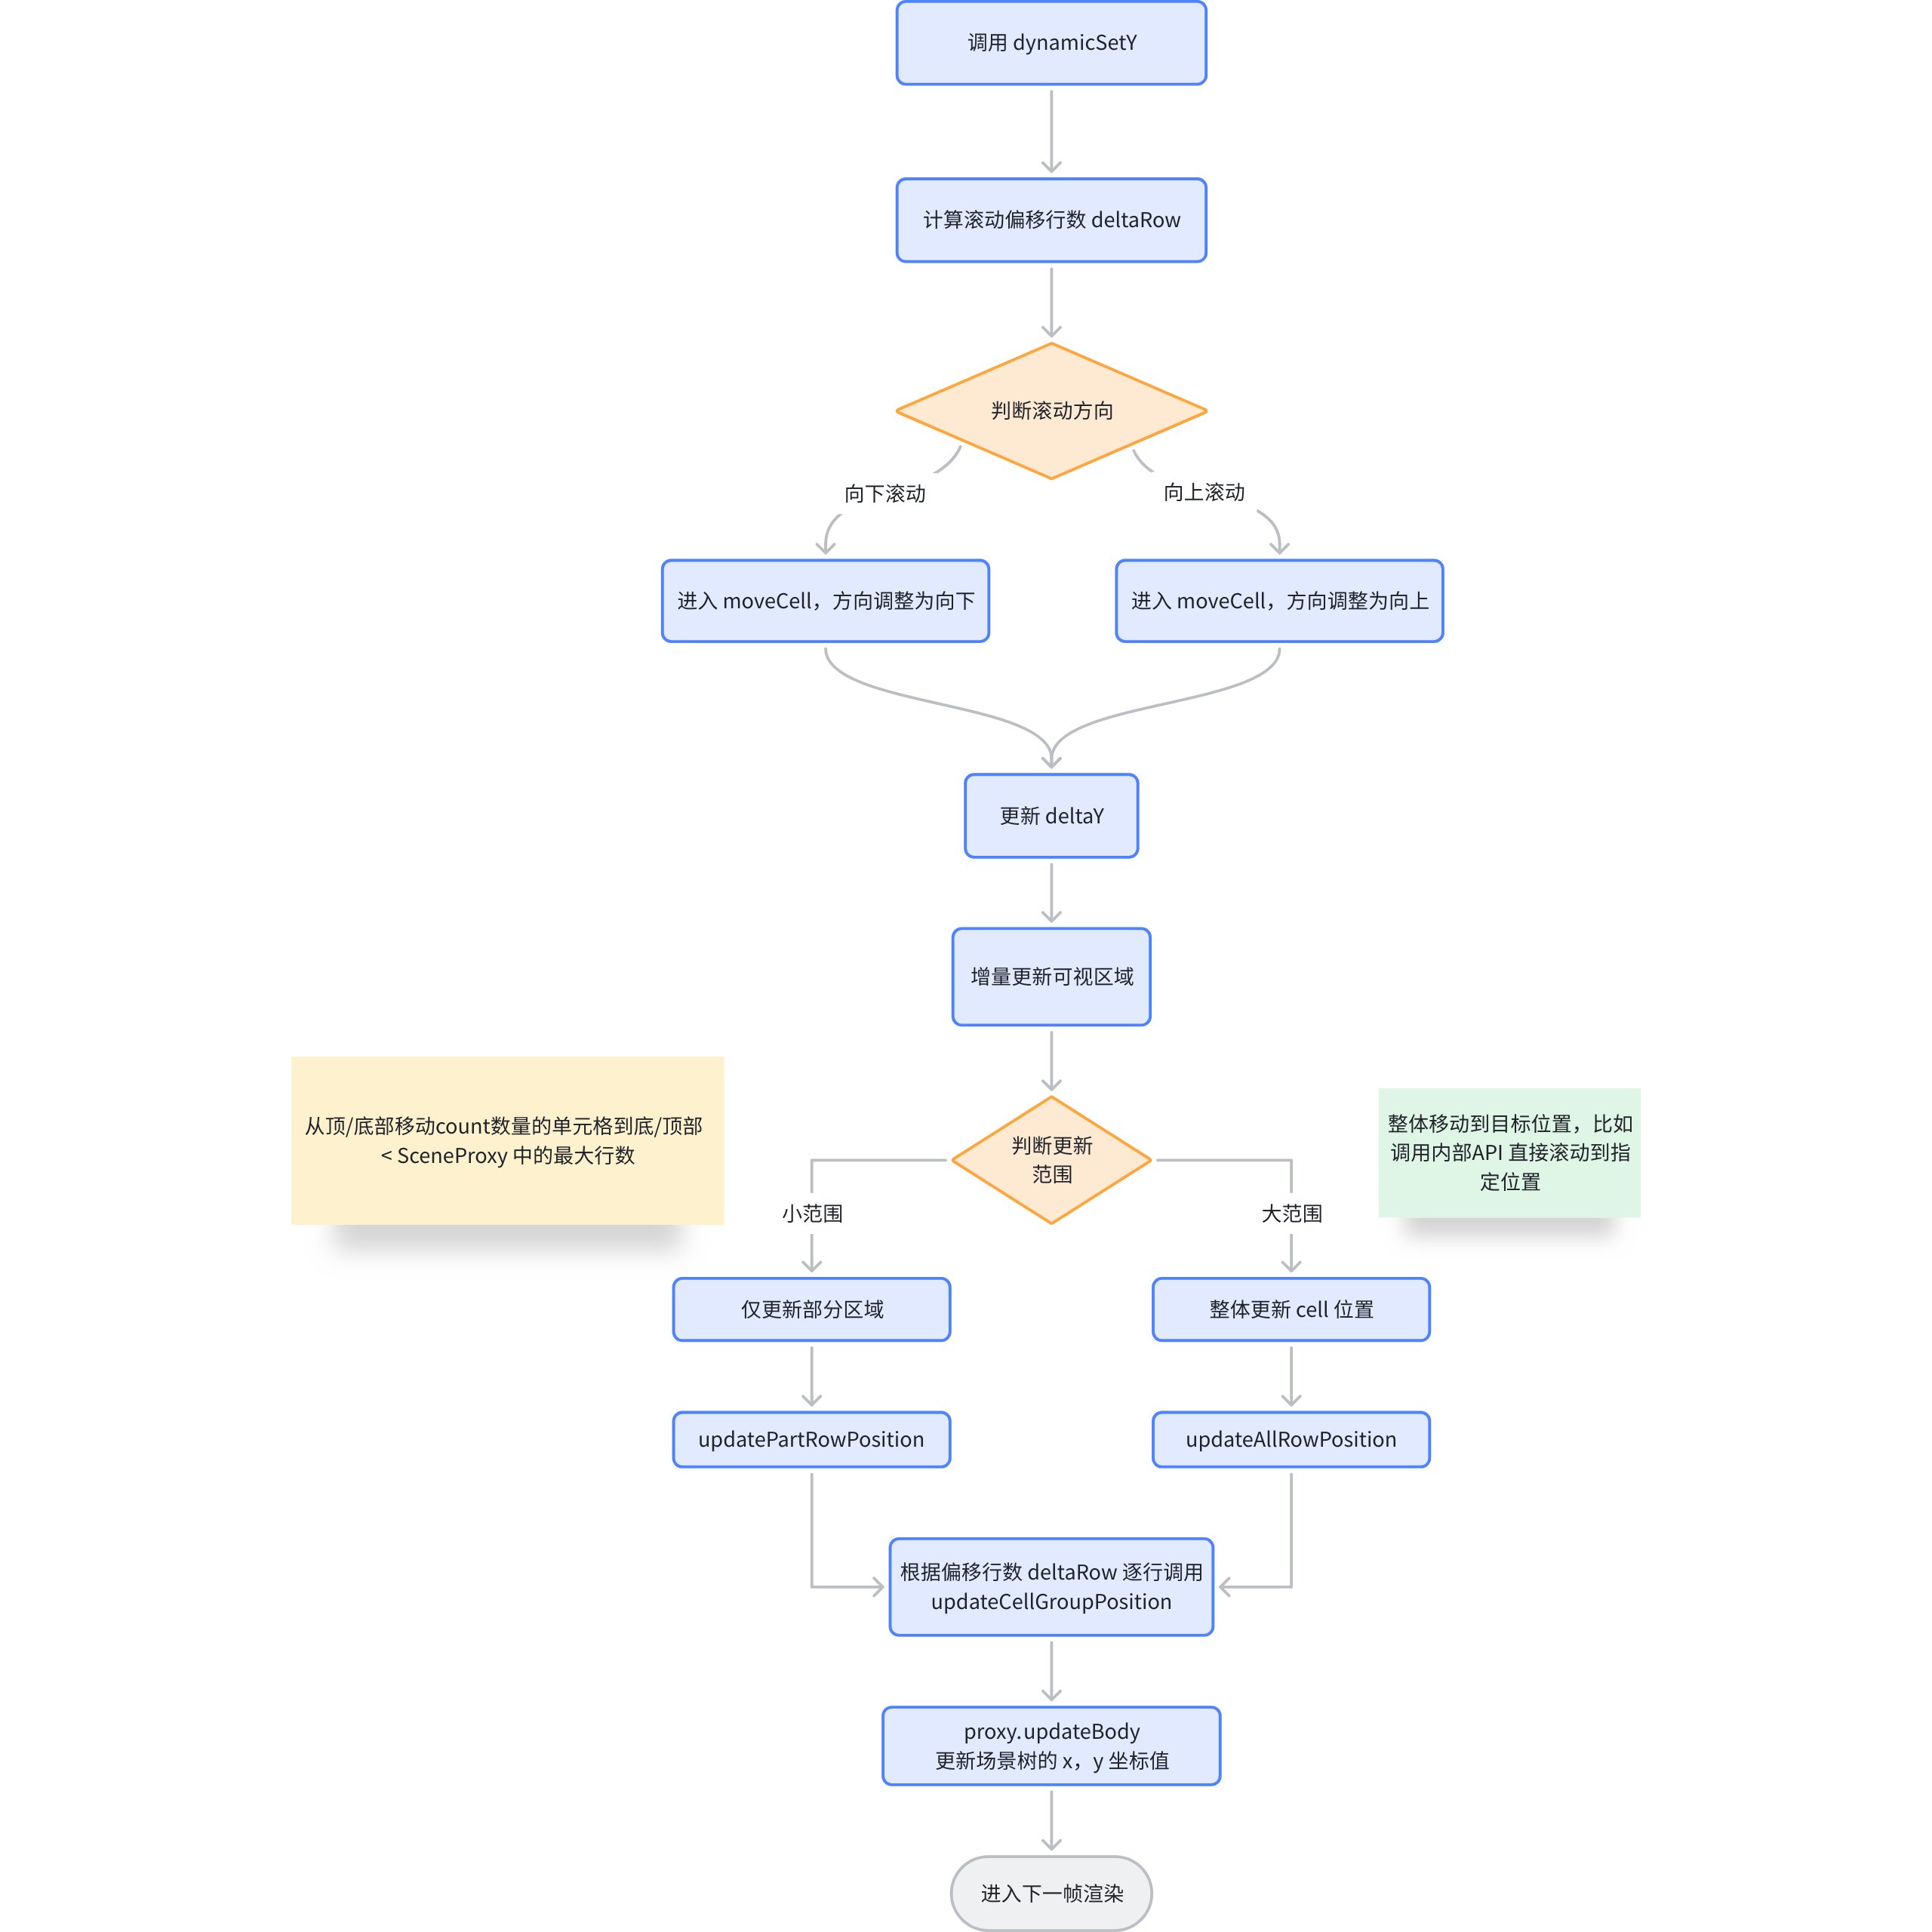
The core logic of progressive updates is dynamicSetY.
The core logic of progressive loading is located in dynamicSetY. Next, let's see what dynamicSetY does. \r
Core Implementation Principle
In ListTable, there is also cell reuse operation. The preliminary process of dynamicSetY mainly determines the range of updates, and the actual update logic is located in updateCellGroupPosition. \r
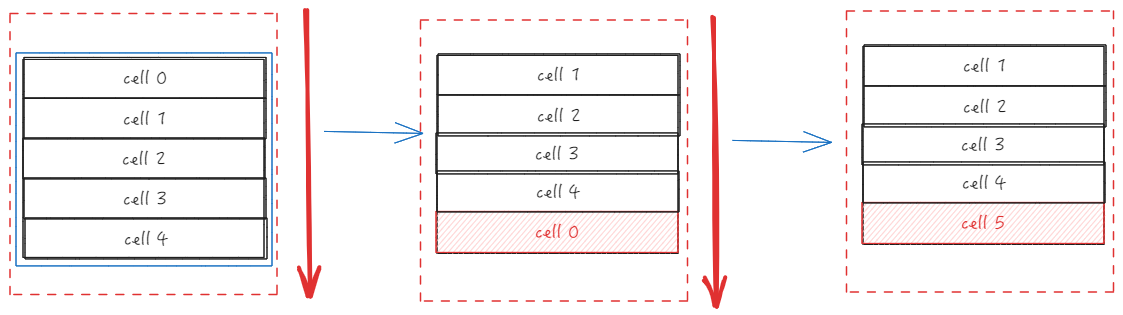
Let's take sliding down as an example. In the ListTable, the first cell will be taken out, the y-value of the CellGroup will be updated, and then the cell will be inserted into the end of the ColGroup. If the number of cells that need to be updated has been calculated beforehand, this operation will be repeated multiple times. \r
This operation can avoid frequent creation of cells, and you only need to update the position of the cell. \r
Summary
This article starts with the ListTable module and describes the underlying implementation logic of most functions and interactions in ListTable.
From the analysis of the above structures, it can be seen that ListTable has made many performance optimizations, including the indexing and storage of data; mapping tables for different groups in the grouping algorithm to reduce the time complexity of node insertion; indexing and storage of header data to reduce the time complexity of processing headers; and progressive loading of the scene tree during scrolling, etc.
This document is provided by the following personnel