
DataZoom Data Filtering Slider
DataZoom is a filtering slider component in the VChart chart library, which allows users to zoom and roam chart data more conveniently, improves data visibility, and enhances the interactivity of the chart. This tutorial mainly explains the related concepts and composition of DataZoom. For more detailed configuration and examples of DataZoom, please refer to the Configuration Documentation and Examples pages.
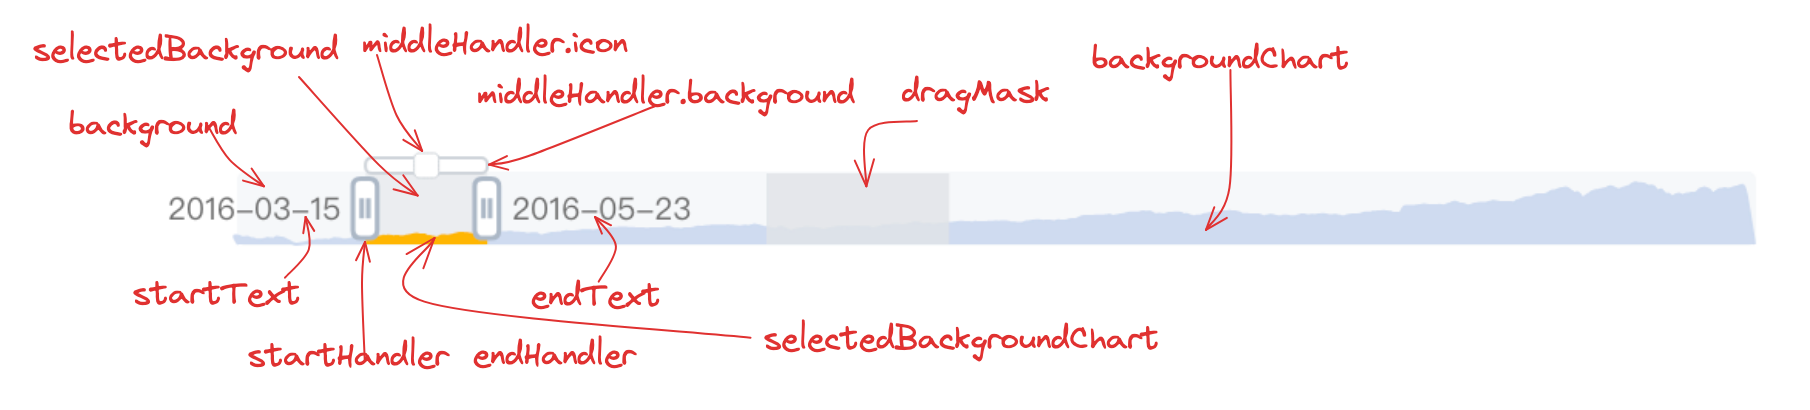
Composition
The DataZoom component mainly consists of the following parts:
backgroundBackgroundselectedBackgroundSelected backgroundstartHandlerStart handleendHandlerEnd handlemiddleHandlerMiddle handleiconMiddle handle iconbackgroundMiddle handle background
startTextStart textendTextEnd textbackgroundThe background rectangle of the thumbnail axisbackgroundChartPreview chart of the thumbnail axis, currently supports line charts and area chartsselectedBackgroundChartPreview chart of the selected part of the thumbnail axis.dragMaskDragging track element of the thumbnail axis.
Example
In the following example, you can see a data filtering slider at the bottom of the chart. Users can zoom and roam the chart data by dragging the slider handles or selecting from the background layer.
In this example, we configure the data filtering slider through the dataZoom property. Here we mainly configure the thumbnail chart for the slider background layer and the chart style in the selected area:
-
Background area chart: Configure with the
backgroundChartobject, including area chart (area) and line chart (line) styles. The fill color of the area chart is#D1DBEE, and the line width is 1; The stroke color of the line chart is#D1DBEE, and the width is 1. -
Selected area chart: Configure with the
selectedBackgroundChartobject, including area (area) and line chart (line) styles. The fill color of the area chart is#fbb934, and the line width is 1; The stroke color of the line chart is#fbb934, and the line width is 1.