A scatter plot is a type of graph used to represent the relationship between two variables. It depicts the relationship between two variables by plotting a series of points on a cartesian coordinate plane, with the coordinates of the points representing the values of the variables. Scatter plots can help us intuitively observe the relationship between two variables, such as whether there is a linear relationship, whether there is some trend, whether there are outliers, etc.
As mentioned earlier, a scatter plot uses the position of points to represent the relationship between two variables. The size or color of the points can be used to distinguish categories. In VChart, you can specify the size of the scatter points using scatterChart.sizeField to represent the differences in variable values, and this visualization method of specifying the size of points is also called bubble chart.
Chart Composition
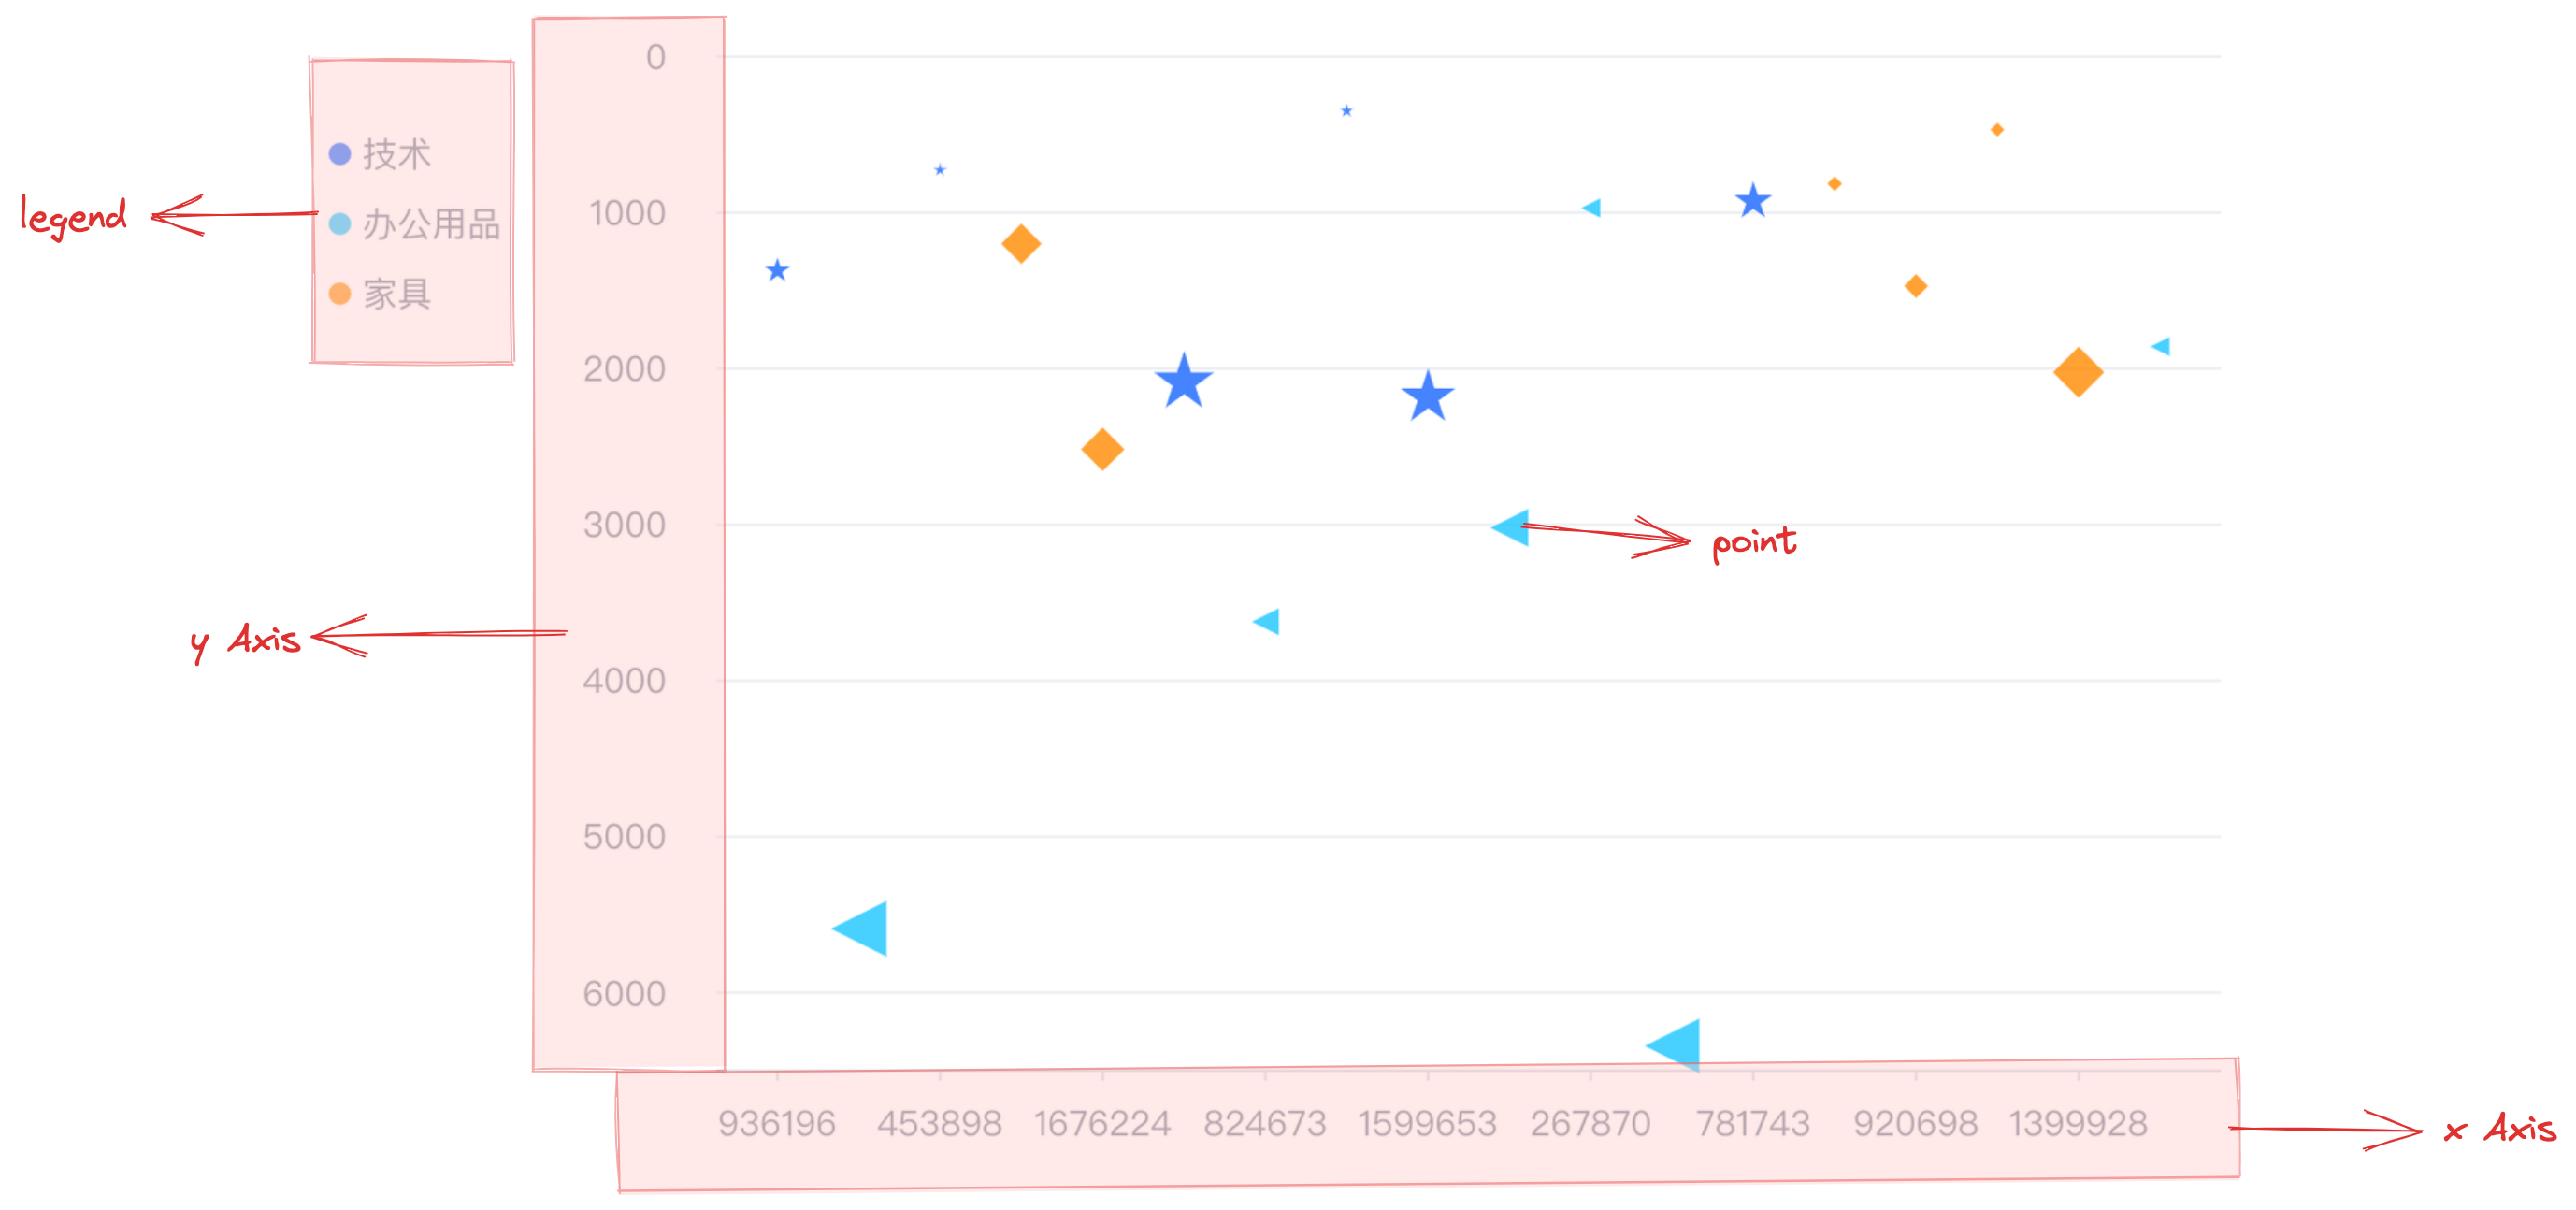
A scatter plot consists of point elements, axes, tooltip information, and other components.
scatterChart.type: Chart type, scatter plot type is 'scatter'
scatterChart.data: Data source for chart rendering
scatterChart.xField: Category/value field, maps point element's x-coordinate
scatterChart.yField: Category/value field, maps point element's y-coordinate
scatterChart.sizeField: Value field, maps point element's size
Axes, tooltip information, and other components are optional configurations that assist the chart display and come with default effects and capabilities:
scatterChart.axes: Axis component, displayed by default, and automatically infers coordinate system and data mapping logic based on chart type, detailed configuration see VChart Axis Component Configuration
Since scatter plots have flexible data display capabilities, a single point element represents a data record, so people often assign more data significance to it in other visual channels, such as shape, size, etc.
Shape
You can specify the shape mapping field and mapping range for the scatter plot respectively through scatterChart.shapeField and scatterChart.shape.
The declaration of scatterChart.shape is as follows:
  size: {
    type: 'ordinal', // Mapping type, 'linear' can also be selected
    range: [10, 30, 50] // Mapping range
  }
Alternatively, you can directly specify the mapping relationship via the callback form.
Declare the following in scatterChart.shape:
shape: () =>'start',
Size
You can specify the shape mapping field and mapping range for the scatter plot respectively through scatterChart.sizeField and scatterChart.size.
The declaration of scatterChart.size is as follows:
  size: {
    type: 'linear', // Mapping type
    range: [10, 30] // Mapping range
  }
Or you can directly specify the mapping relationship by a callback,
Declare below in scatterChart.size: