Waterfall charts visually represent the cumulative process of numerical values in the form of bar charts. They are commonly used to analyze and explain the cumulative impact of individual data changes, such as the sources and factors of changes in income or expenditure.
Chart Composition
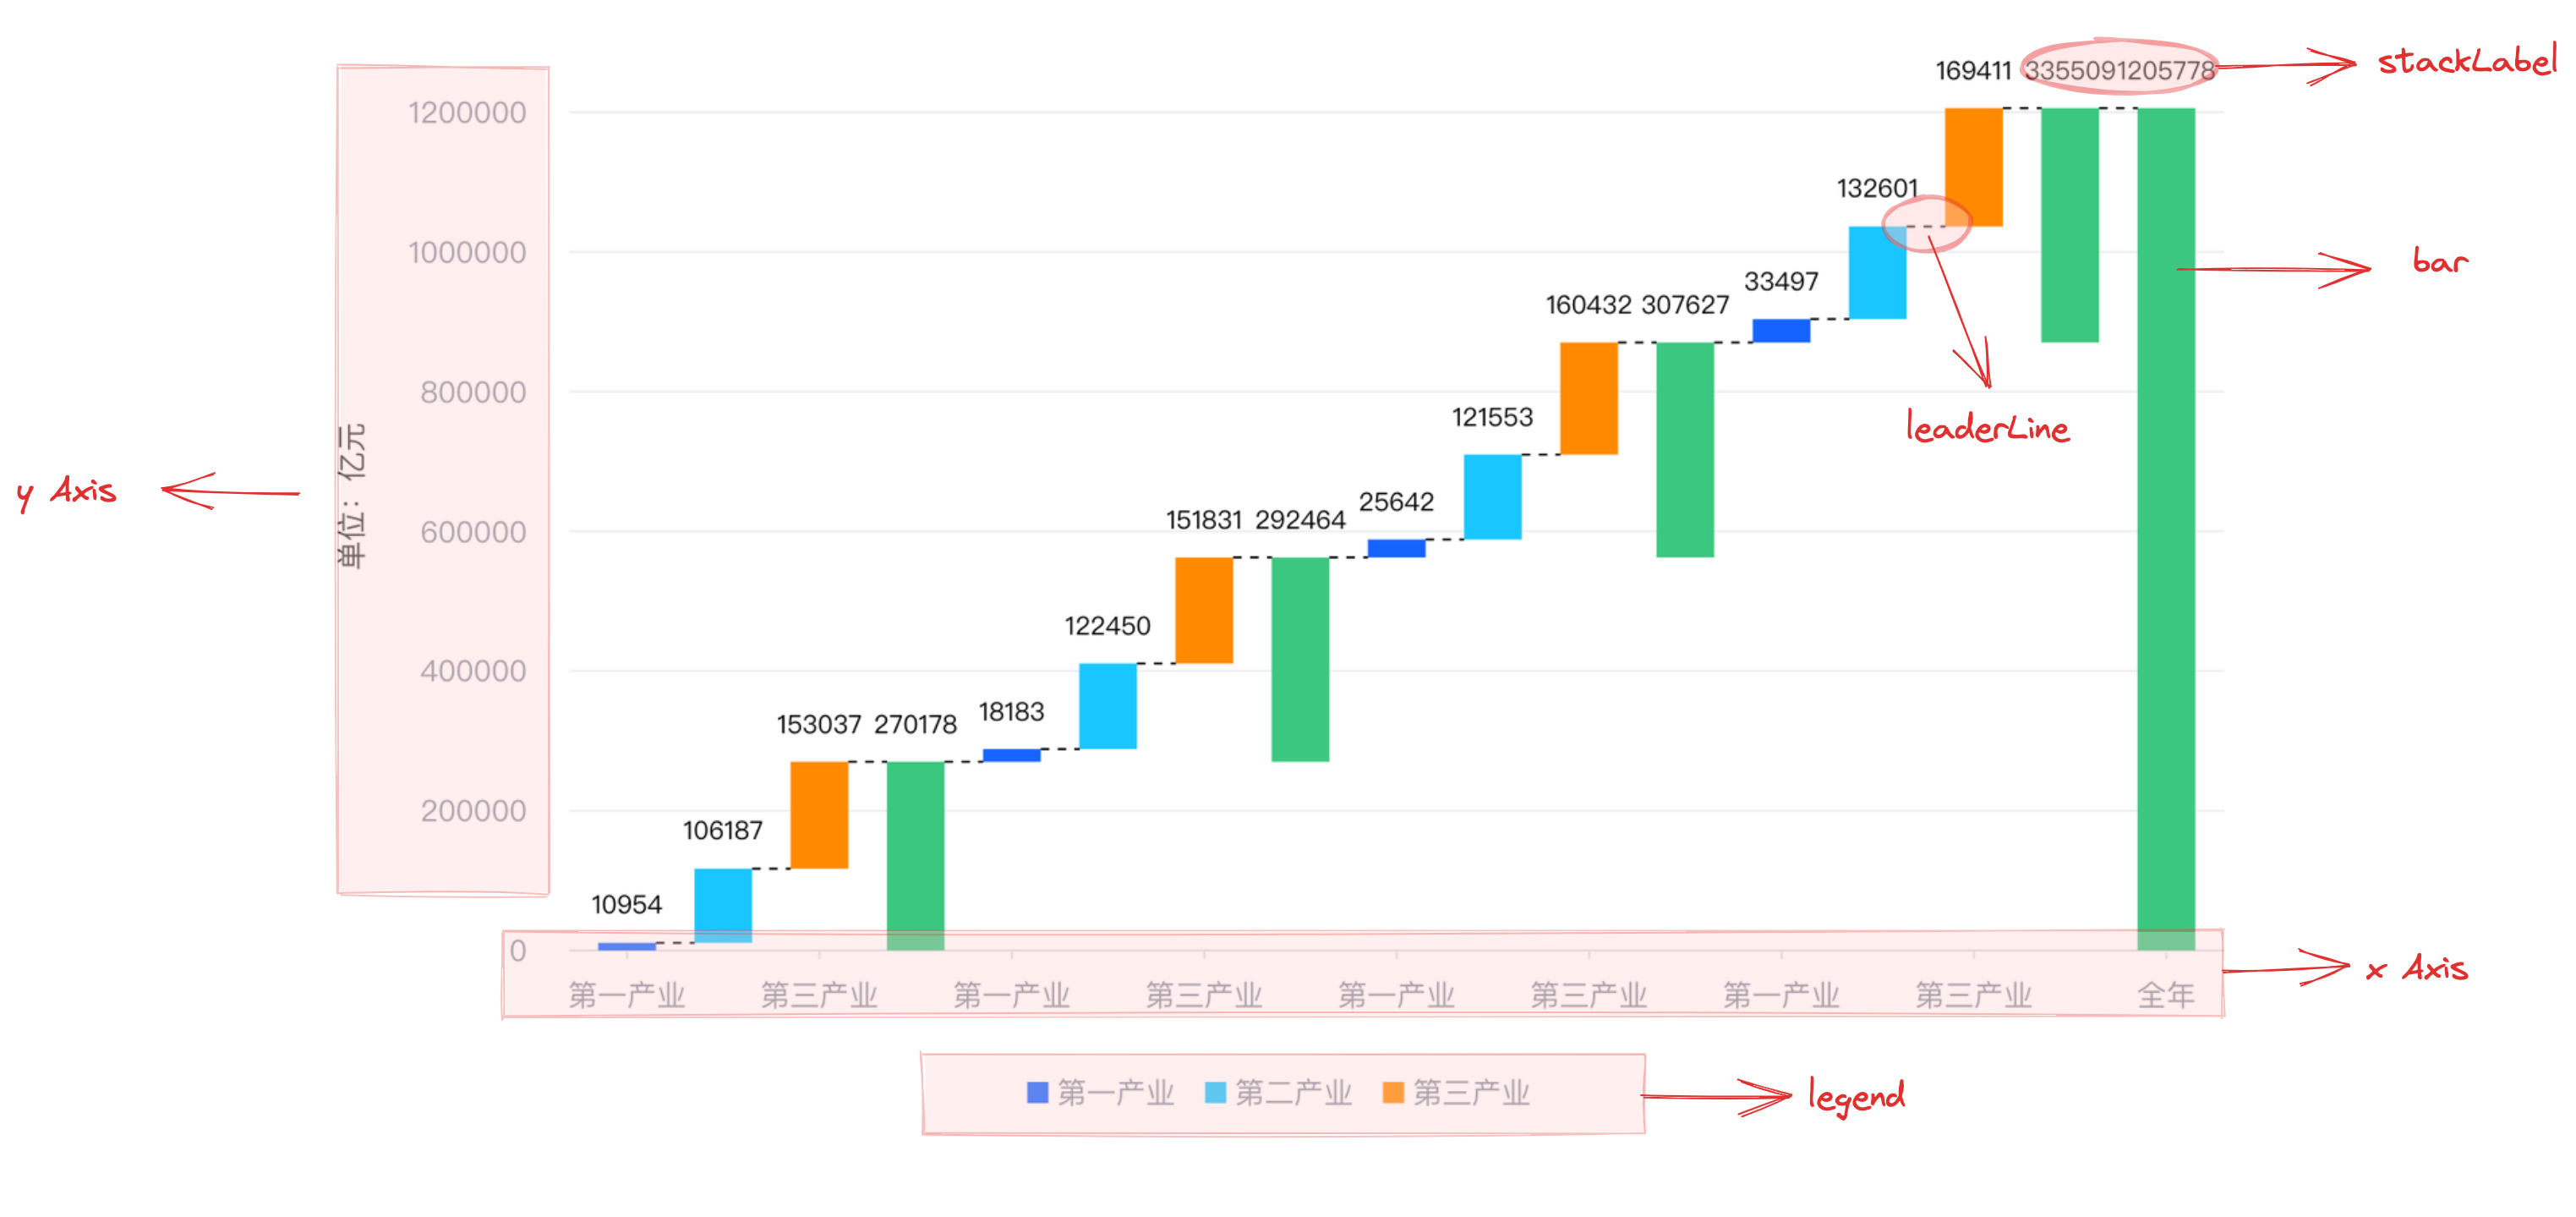
Waterfall charts are composed of bar chart elements, guidewire chart elements, coordinate axes, and other components.
Rectangular chart elements are the basic elements of waterfall charts, and related drawing configurations are essential:
waterfallChart.type: Chart type, the type of waterfall chart is 'waterfall'
waterfallChart.data: Data source for chart rendering
waterfallChart.xField: Categorical field, mapping rectangle chart element's x-coordinate or width
waterfallChart.yField: Numeric field, mapping rectangle chart element's height or y-coordinate
waterfallChart.total: Used to configure this rectangular chart element corresponding to the total calculated data of the chart, see waterfallChart.total for detailed configuration
Coordinate axes, tooltip information, and other components that serve as auxiliary chart displays are optional configurations with default effects and features:
waterfallChart.axes: Coordinate axis component, by default it is displayed and automatically inferred coordinate system and data mapping logic based on the chart type, see VChart coordinate axis component configuration for detailed configuration
Waterfall charts are a type of chart that displays the flow or cumulative changes of numerical values. In VChart, there are three ways to draw cumulative values:
Add total information at the end and draw the total element
Specify a certain field as total information and treat it as a total chart element
Custom total
Add total information at the end and draw the total element
By using waterfallChart.total.type: 'end', you can append the total information at the end. The specific configuration is as follows:
waterfallChart.total.type: 'end' declares the calculation method
waterfallChart.total.text declares the total text
Specify a certain field as total information and treat it as a total chart element
By using waterfallChart.total.type: 'field', you can specify a certain field as total information and treat it as a total chart element. The specific configuration is as follows:
waterfallChart.total.type: 'field' declares the calculation method
waterfallChart.total.tagField declares the flag for the total value, when the value of the field is true, it is considered this data is total data
waterfallChart.total.valueField can specify the total value
waterfallChart.total.startField can specify the starting point of the total
waterfallChart.total.collectCountField can specify the fields of the first n dimensions to be calculated before the total, for example, if this field specifies 'collect', then the n read from the 'collect' field in the data recognized as total data.
Custom total calculation method
By using waterfallChart.total.type: 'custom', you can specify a custom calculation method and treat it as a total chart element. The specific configuration is as follows:
waterfallChart.total.type: 'custom' declares the calculation method
waterfallChart.total.tagField declares the flag for the total value, when the value of the field is true, it is considered this data is total data
waterfallChart.total.product: The total data will call this function during calculation, with parameters being the current total data and the current cumulative information, and needs to return the starting and ending values of the total. The callback function is defined as follows: