It is not only a fully functional graph visualization library, but also an explorer of data relationships.
!!!###!!!title=Harmony VChart——VisActor/VChart tutorial documents!!!###!!!!!!###!!!description=- Repository: [https://github.com/VisActor/VChart/tree/main/packages/harmony-vchart](https://github.com/VisActor/VChart/tree/main/packages/harmony-vchart)HarmonyOS is an intelligent terminal operating system developed by Huawei, using ArkTS as the main development language. Starting from version 1.11.1, VChart supports HarmonyOS-compatible chart development (supporting HarmonyOS API 9 and above).OpenHarmony is an open-source project incubated and operated by the OpenAtom Foundation, aiming to build a framework and platform for intelligent terminal device operating systems based on open source methods, to promote the prosperity of the Internet of Everything industry. VChart also supports chart development for OpenHarmony application development (supporting API 10 Release and above).To facilitate Harmony technology stack students to better use it, we provide the HarmonyOS package `@visactor/harmony-vchart` for VChart (this package is not an NPM package, but an OHPM package). The spec configuration options of this component are consistent with VChart, and its usage in HarmonyOS and OpenHarmony application development environments is consistent.In this tutorial, we will explain in detail how to use VChart in a Harmony project and create a simple bar chart.!!!###!!!
HarmonyOS is an intelligent terminal operating system developed by Huawei, using ArkTS as the main development language. Starting from version 1.11.1, VChart supports HarmonyOS-compatible chart development (supporting HarmonyOS API 9 and above).
OpenHarmony is an open-source project incubated and operated by the OpenAtom Foundation, aiming to build a framework and platform for intelligent terminal device operating systems based on open source methods, to promote the prosperity of the Internet of Everything industry. VChart also supports chart development for OpenHarmony application development (supporting API 10 Release and above).
To facilitate Harmony technology stack students to better use it, we provide the HarmonyOS package @visactor/harmony-vchart for VChart (this package is not an NPM package, but an OHPM package). The spec configuration options of this component are consistent with VChart, and its usage in HarmonyOS and OpenHarmony application development environments is consistent.
In this tutorial, we will explain in detail how to use VChart in a Harmony project and create a simple bar chart.
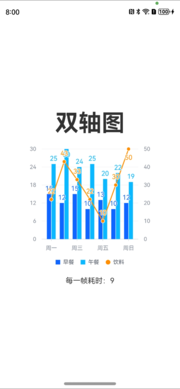
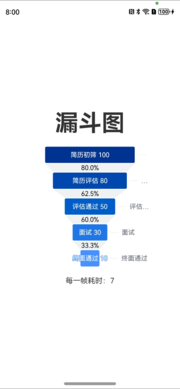
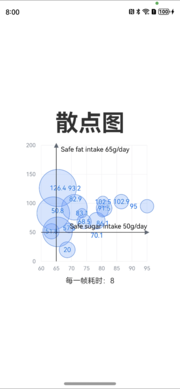
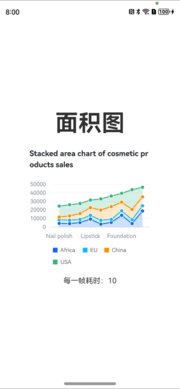
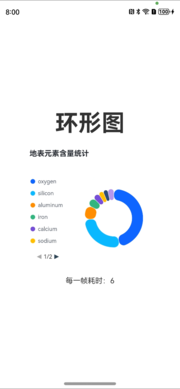
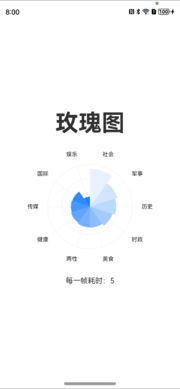
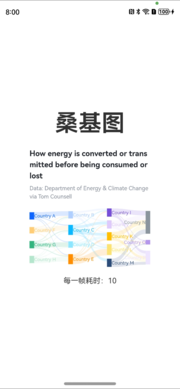
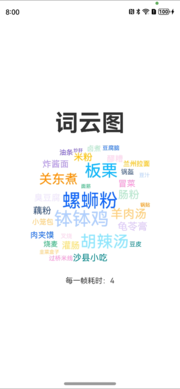
Demo
Quick Start
This article assumes that the user is already familiar with and knows how to use HarmonyOS. For specific knowledge about HarmonyOS, please refer to the HarmonyOS Developer Platform.
Installation
To start using Harmony VChart, you first need to install the @visactor/harmony-vchart package in your Harmony project. In the project root directory, use the following command to install the package:
ohpm install @visactor/harmony-vchart
Create a Chart
Taking creating a simple bar chart as an example. In your Harmony component, import the <BarChart> component from visactor/harmony-vchart and use it in the component. Here is an example code for creating a bar chart:
In this example, we created a simple bar chart using some basic components and configurations.
Unified Chart Tag
The <VChart /> tag accepts a complete spec as the chart definition, and its spec data structure is exactly the same as the definition in VChart. Therefore, developers can input any legal spec for VChart into Harmony-VChart for chart rendering.
Props
If you already have a spec chart description, using the unified chart tag is a faster way. Simply import the VChart component:
import { VChart } from'@visactor/harmony-vchart';
The VChart component is a Harmony component wrapper, and its props are defined as follows:
interface VChartProps extends EventsProps {
/** Chart definition */spec: any;
/** Chart configuration */ options?: IInitOption;
/**
* Chart initialization callback
* @param vchart */ onChartInitCb?: (vchart: VChartConstructor) =>void;
/**
* Chart ready callback (first rendering completed)
* @param vchart */ onChartReadyCb?: (vchart: VChartConstructor) =>void;
/** throw error when chart run into an error */ onError?: (err: Error) =>void;
/**
* Switch to synchronous rendering
*
* @since 1.8.3
**/ useSyncRender?: boolean;
/**
* When props are updated, skip all function checks, i.e., all functions are considered not updated
*
* @since 1.6.5
**/ skipFunctionDiff?: boolean;
}
exportinterface IInitOption {
/**
* Callback when the chart starts rendering
* @param vchart */ beforeRender?: (stage: Object) =>void;
/**
* Callback after rendering is completed
* @param vchart */ afterRender?: (stage: Object) =>void;
/**
* Enabled plugin list
*/ pluginList?: string[];
/** Data set */ dataSet?: Object;
/**
* Whether to enable animation
*/ animation?: boolean;
/**
* When text is omitted, whether to show poptip when hovering over the text
* @default true */ poptip?: boolean;
/**
* Error callback function
* @since 1.2.0
*/ onError?: () =>void;
/**
* Default theme (supports complete theme objects or theme names, theme names need to be registered in `ThemeManager` in advance)
* @since 1.3.0
*/ theme?: string;
}
The definition of EventsProps refers to the event interaction section.
onReady is a built-in callback event that triggers when the chart is rendered or updated, with parameters representing the chart instance object and whether it is the first rendering.
For example, developers can register the callback events that need to be triggered on the chart instance during the first rendering to implement chart interaction features.
Load on Demand
Note that the current Harmony IDE does not support code tree-shaking, so this import form can currently only be used as an experimental solution.
In general, as a mobile application, package size does not greatly affect the business, but in some scenarios (such as meta-services), there are strict requirements on package size. Therefore, we provide a way to load on demand using the VChartSimple tag. Its usage is similar to VChart, but requires calling additional registration functions to register the required components.
Register Components
When using the VChartSimple tag, you need to register the required components and charts first (we have built-in basic functions for scatter charts, line charts, and pie charts, other functions need to be registered on demand). The functions that can be called are as follows:
The unified chart tag (VChart) or syntax-based chart tag (BarChart, etc.) outermost chart component supports the scene tree events thrown by the underlying rendering layer through the EventsProps.
Through this tutorial, you should have learned how to use VChart in a Harmony project to create a simple bar chart. Additionally, you have learned how to configure the chart according to requirements to meet different scenarios in the project. VChart provides rich configuration options and components, and I believe you will better grasp their usage in actual projects and unleash their full potential. I hope you enjoy using the VChart library in your projects!