It is not only a fully functional graph visualization library, but also an explorer of data relationships.
!!!###!!!title=Brush Selection——VisActor/VChart tutorial documents!!!###!!!!!!###!!!description=Brush is an interactive component provided by VChart, which can help users select data in the chart, making it convenient for users to further analyze or manipulate data. This tutorial mainly introduces the related concepts and components of Brush. For more detailed configuration and examples of Brush, please refer to the [configuration documentation](../../../option) and [example](../../../example) pages.!!!###!!!
Brush Selection
Brush is an interactive component provided by VChart, which can help users select data in the chart, making it convenient for users to further analyze or manipulate data. This tutorial mainly introduces the related concepts and components of Brush. For more detailed configuration and examples of Brush, please refer to the configuration documentation and example pages.
Components
The Brush component mainly consists of a selection area, providing rich selection types, styles, and interactions, and also provides corresponding event support (brushChange, see Event API for details).
Selection Types
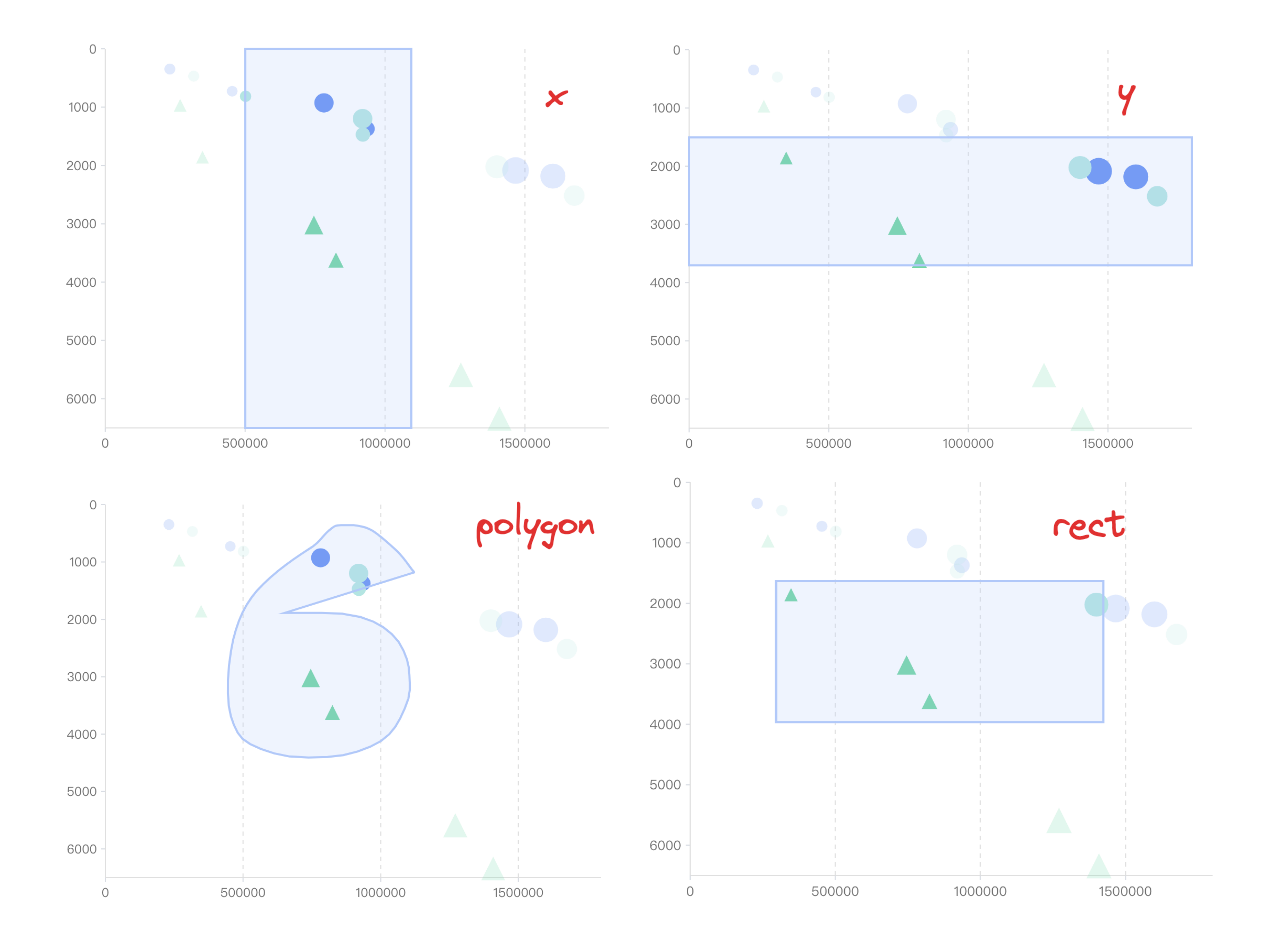
Brush provides 4 common types of selection, and users can choose the appropriate type according to the actual needs:
'x': Horizontal selection, only select data in the X-axis direction
'y': Vertical selection, only select data in the Y-axis direction
'rect': Rectangular selection box, users can draw a rectangular box in the chart to select the data inside
'polygon': Arbitrary shape selection box, users can freely draw a polygonal box in the chart to select the data inside
Styles and Interactions
Brush supports setting styles inside and outside the selection box, such as color, transparency, etc. At the same time, it can also achieve some interactive effects, such as highlighting selected data.
Example
Next, we will demonstrate how to use the Brush selection component in VChart through a specific example.
First, we need to prepare a scatter chart and use the following code to define the spec of the scatter chart:
Now, we want to add a selection function to this scatter chart, simply add a brush configuration item to the spec and set the appropriate parameters:
spec.brush = {
brushType: 'polygon', // Set the selection type to arbitrary shape selection boxinBrush: {
colorAlpha: 1// Transparency of the data color in the selection box },
outOfBrush: {
colorAlpha: 0.2// Transparency of the data color outside the selection box }
};