A map is a type of chart that visualizes a data lake as a Region color or fill effect to display geographic location. Typically, map charts use administrative boundary layers or map tiles as the base map, and use color or fill levels to represent Region-specific data values.
Chart composition
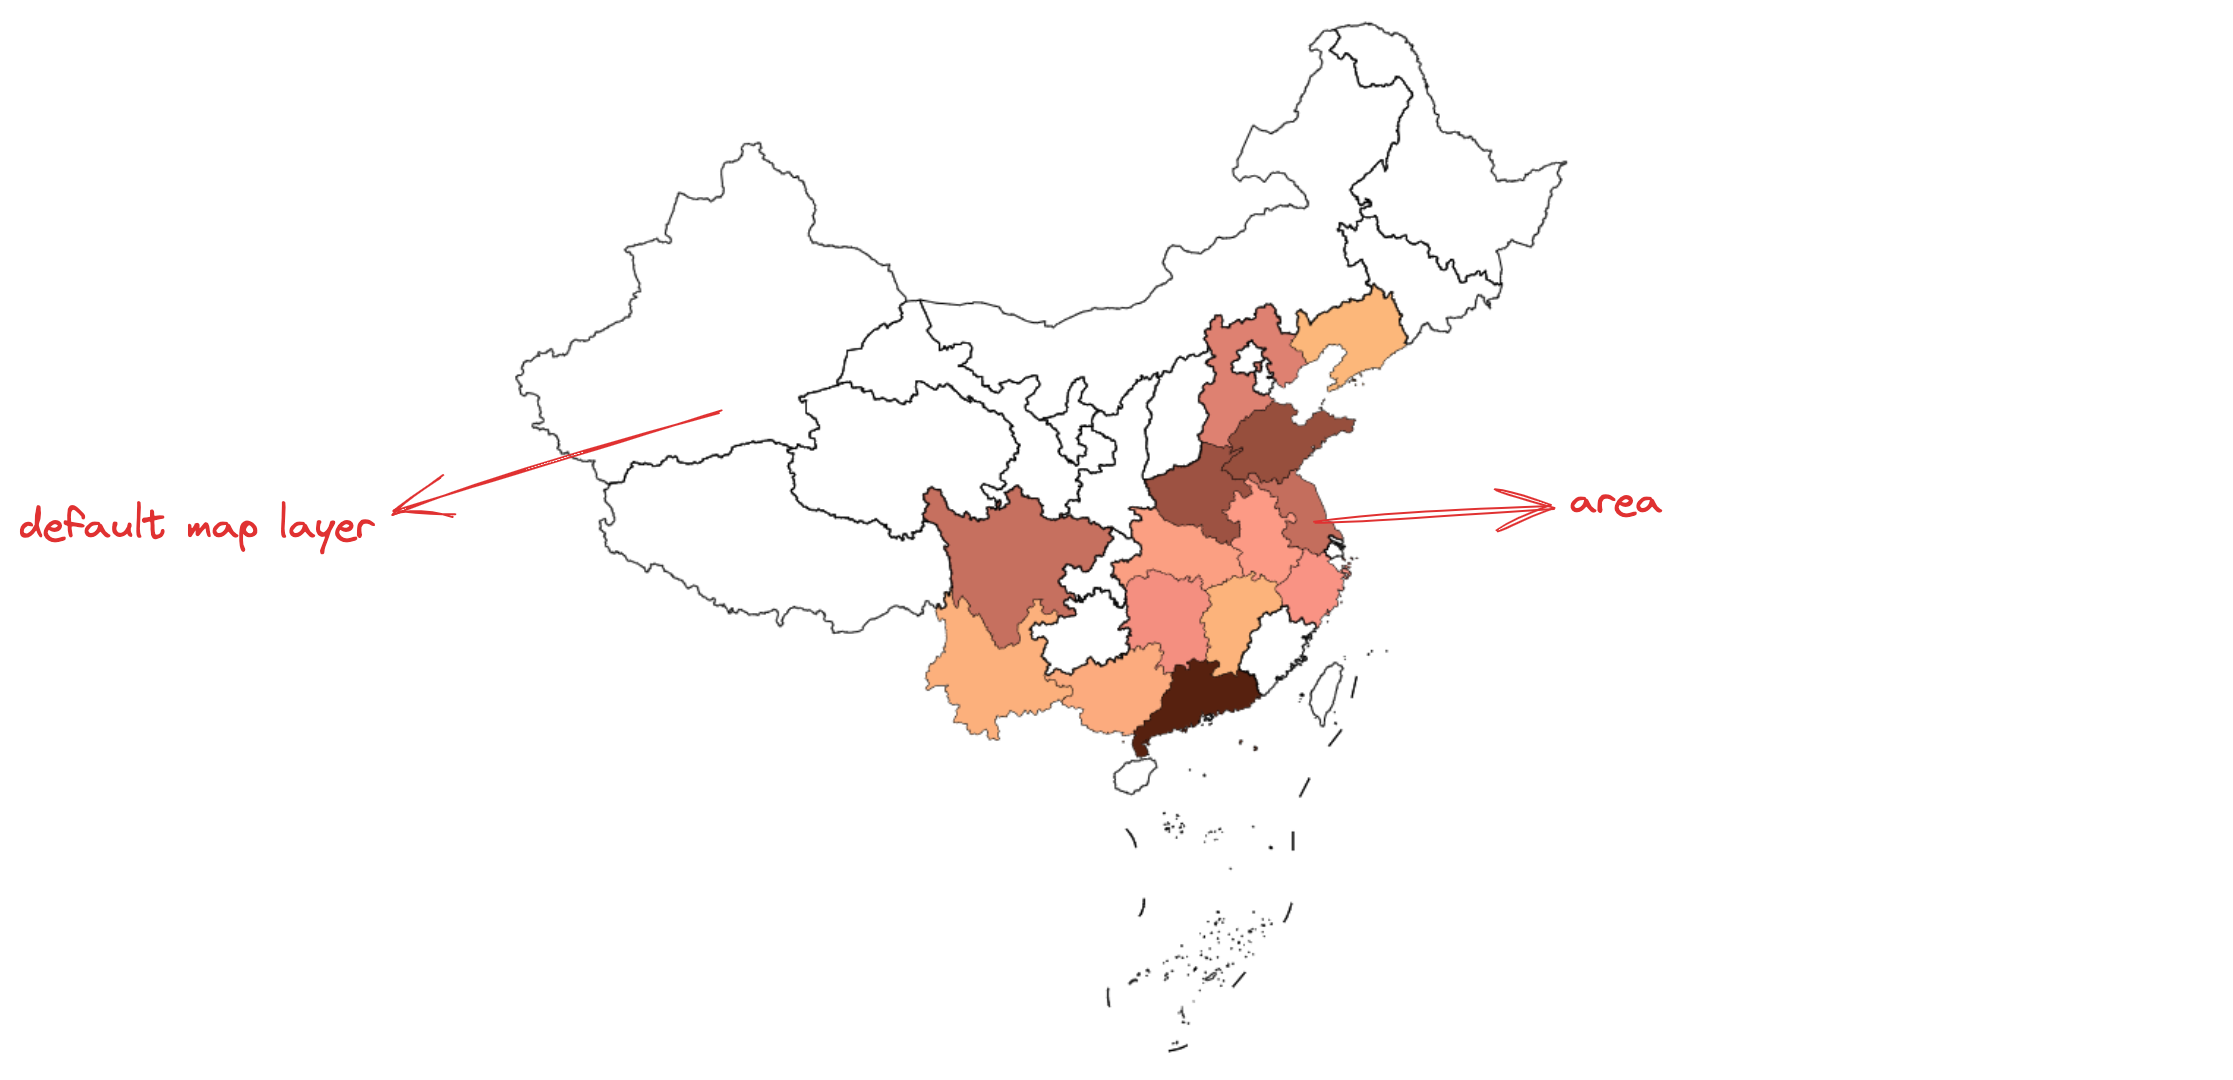
The map is mainly composed of elements such as path data and labels that resemble geographic Regions.
The path primitive shaped like a geographic Region is the basic element of the map, and the relevant drawing configuration is essential:
mapChart.type: Chart type, the type of map is'map'
mapChart.nameField: Classification field, map the geographic Region represented by the path primitive
mapChart.valueField: Numerical field, map the color of the path primitive
Since mapping Geographical Regions requires the support of map data, the configuration of map data is also essential:
VChart.registerMap(mapName, mapData): VChart provides an api for map data registration, wheremapNameIndicates the name of the registered map data,mapDataRefers to the specific map data, the default isgeojsonType map data, also supportedtopojson Type map data.
mapChart.map: Specify to use the registered map data name
VChart provides api for map data registrationVChart.registerMap(mapName, mapData), in whichmapNameIndicates the name of the registered map data,mapDataRefers to the specific map data, the default isgeojsonType map data, also supportedtopojson Type map data as in the example below.
Specify the use of registered map data names, such asVChart.map: 'mapName'
rewind
In Geographic Information System (GIS) and map visualization development, Rewind is a key operation used to correct the vertex order (Winding Order) of polygons.
In simple terms, its function is to ensure that the "outer rings" and "inner rings (holes)" of polygons are arranged in the standard specified direction (clockwise or counterclockwise), preventing serious visual errors from occurring in the rendering engine during drawing.
Generally speaking, if there are no errors in the incoming map data and the mapping configuration is correct, but the drawing effect does not meet expectations, it may be that the vertex order (Winding Order) of the map data does not conform to expectations, causing the rendering engine to draw incorrectly.
In this case, it is necessary to perform a Rewind operation on the map data to ensure that the "outer rings" and "inner rings (holes)" of polygons are arranged in the standard specified direction (clockwise or counterclockwise). VChart provides a rewind option in the parameter values for registering maps, which defaults to false.
// Enable rewind option for topojson data
VChart.registerMap('south-america', topojson, {
  type: 'topojson',
  object: 'south-america',
  rewind: true
});

// Enable rewind option for geojson data
VChart.registerMap('world', world_geojson, {
  type: 'geojson',
  rewind: true
});
Meta map data
One geographic dimension field specifying the region to be colored on the base map
One numeric field used to map the specified visual channel such as shading depth
Note: If the region name in the incoming geographic dimension field does not correspond to the base map data, you need to use mapChart.nameMap to specify the mapping.
Specify nameMap
As mentioned above, if the Region name in the metadata map data does not correspond to the base map data, you need to passmapChart.nameMapSpecify.
For example inBase mapIn the example of, the Region name in the metadata map data does not have an administrative unit, but it is in the base map data, so it needs to be configuredmapChart.nameMap.
Custom Mapping
By default, the map uses discrete coloring to color each Region, that is, the color of each Region is not continuous. But in many scenarios, the map Region needs to represent the numerical size through the shading depth, so as to facilitate and quickly find outliers.
In VChart, this can be achieved by customizing the color map.
Can be configured in Map Regionprojection: typeTo configure the map projection type, you can refer to the specific configuration itemsConfiguration Item Document.
interaction
The map supports the interaction of zooming and dragging, which can be configured in the map Regionroam: trueEnable interaction, and the zoom size can also be configured through configuration.zoomLimitTo limit:
Note: Please ensure that the map data complies with the standard right-hand rule, otherwise it may cause rendering issues. If the data does not comply with the standard, you need to use the rewind option to process it.