A Sunburst Chart is a visualization chart based on a pie chart that displays a nested hierarchical structure within a circle to reflect the hierarchical structure and composition relationship of data.
In the Sunburst Chart, each sector of the circle represents a primary category. Smaller sectors within the larger sectors represent subcategories under this category, and so on. This nesting typically continues recursively until the leaf nodes of the category tree are reached. Data can be encoded by the size and color of sectors, allowing users to quickly understand the organization structure, relative proportions, and relationships between components of complex data from an overall perspective.
Chart Composition
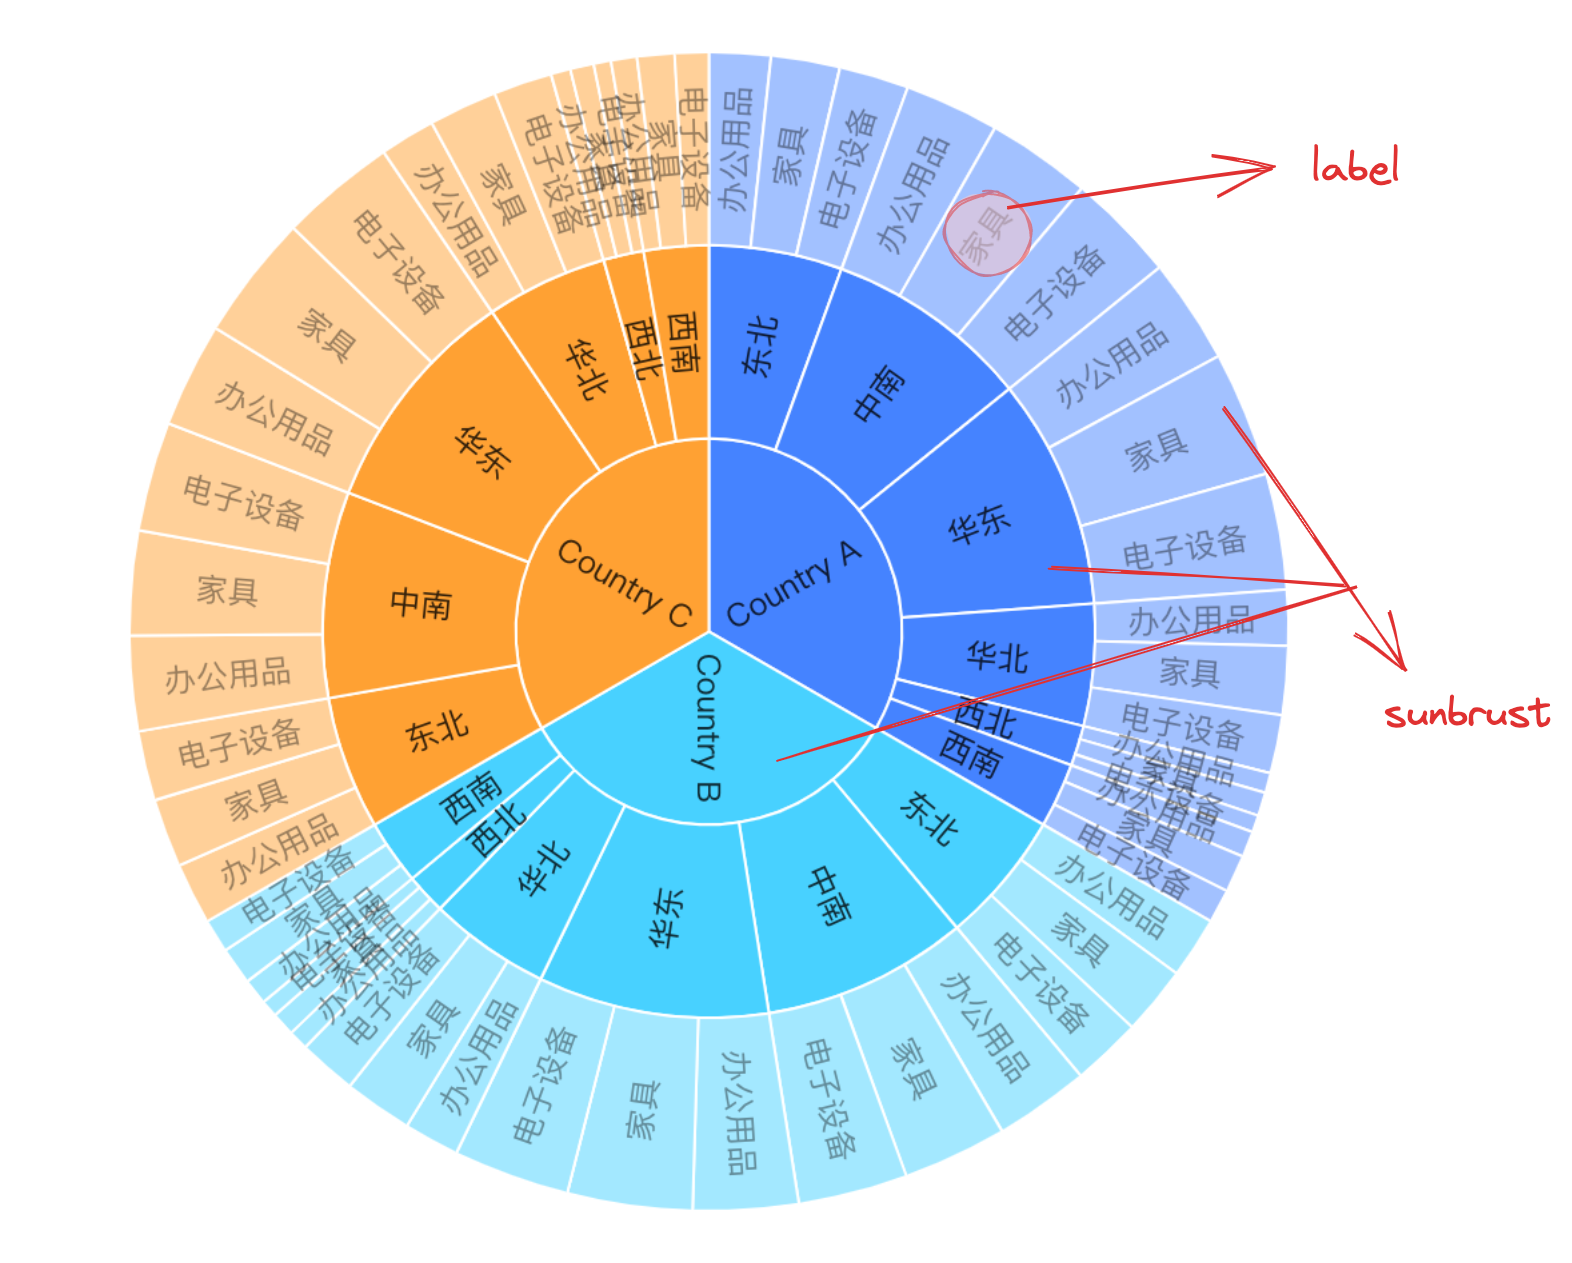
Sunburst Chart mainly consists of fan-like graphics with a hierarchical structure, and other elements or components such as labels and tooltip information.
The hierarchical fan-like graphics are essential to the Sunburst Chart, and related drawing configurations are indispensable:
sunburstChart.type: Chart type, the type of Sunburst Chart is 'circlePacking'
sunburstChart.data: Data source for chart drawing, usually in a hierarchical structure in a Sunburst Chart, in the following format:
sunburst sunburst graphics configuration. By default, all graphics have the same style. To show the hierarchical relationship, different levels of graphics usually need to be distinguished by the callback method.
label label graphic configuration, by default, each graphic has a label with consistent style. To show the hierarchical relationship, different levels of labels usually need to be distinguished by the callback method.
Sunburst Chart Features
Data
As mentioned earlier, the Sunburst Chart represents the nested relationship of data through nested circular layers. Hence the source data must be in a nested structure, like:
Using sunburstChart.centerX, sunburstChart.centerY, sunburstChart.offsetX, and sunburstChart.offsetY, the Sunburst Chart's center point x, y coordinates, and corresponding offsets can be configured.
Angle Range
The angle range of the Sunburst Chart can be configured using sunburstChart.startAngle and sunburstChart.endAngle.
Inner and Outer Radius
The inner and outer radii of the Sunburst Chart can be configured using sunburstChart.innerRadius and sunburstChart.outerRadius, which support passing in an array for layer-by-layer configuration.
Hierarchy Gap
The hierarchy gap can be configured using sunburstChart.gap, which supports passing in an array for layer-by-layer configuration of the hierarchy gap.
Label Layout
todo: a table
Chart Interaction
Drill Down
Drill down is the ability to click a parent category to explore its subcategory information when showing different hierarchy levels in treemaps, Circle Packing, and Sunburst Charts. Through the drill-down feature, users can view details level by level, explore data hierarchy in depth, and better understand the relationships and differences between data, resulting in higher quality analytical conclusions.
By configuring sunburstChart.drill: true and sunburstChart.drillField, the drill-down feature can be enabled, and the field to be used for drilling down can be configured (the drill-down field will use an autogenerated unique key by default, but the drillField must be configured when using the API to drill down).