Funnel chart, shaped like a "funnel", is used for single-process analysis. It consists of N process links between the start and the end, which usually have a logical order.
Chart Components
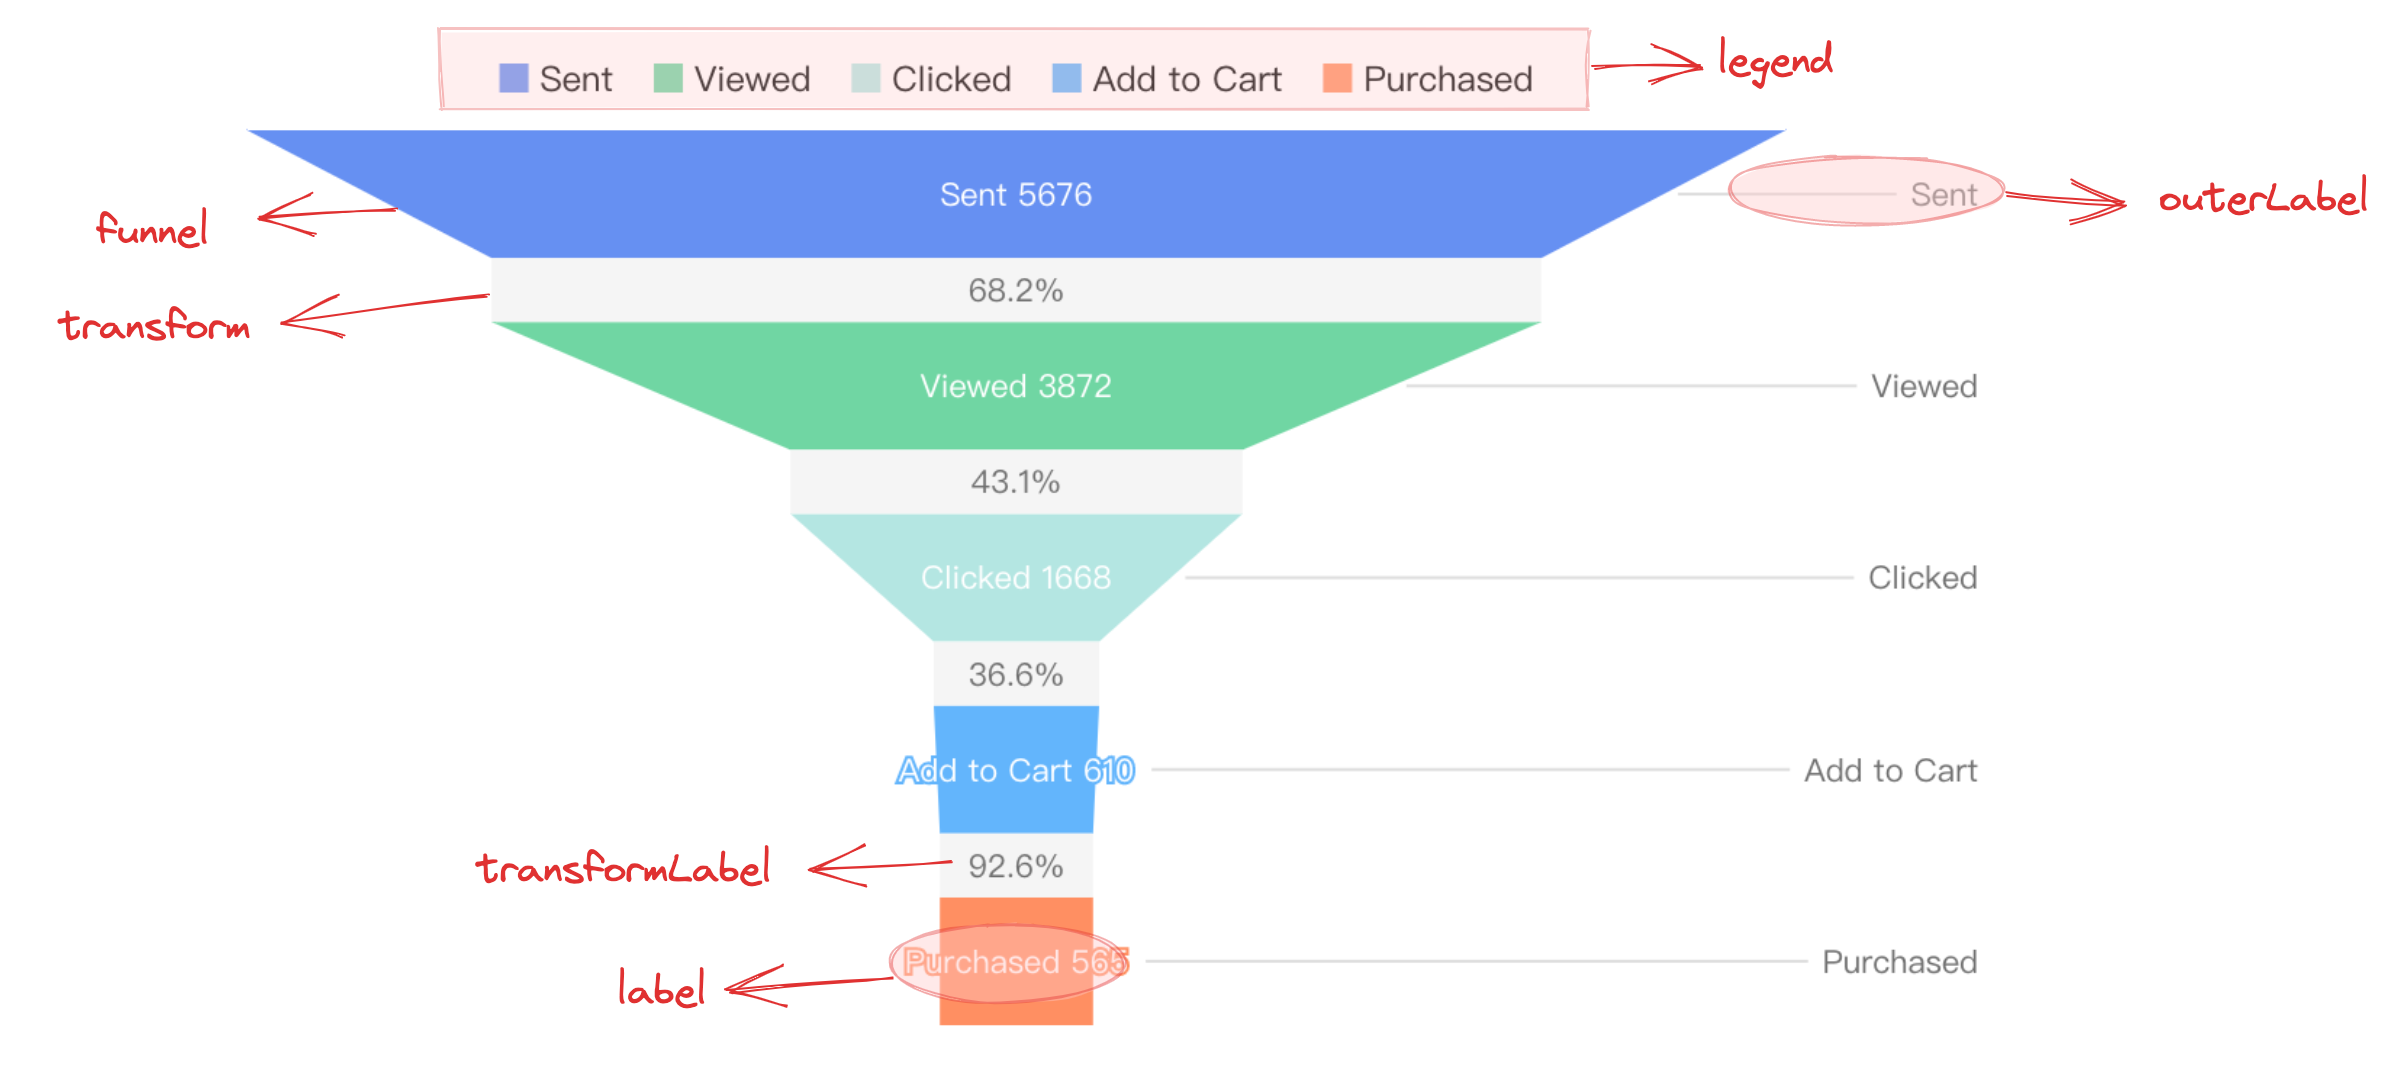
Funnel chart consists of basic elements and other components such as hierarchical polygon elements (default is trapezoid, but can also be rectangle, depending on user configuration), transformation layers, labels, etc.
Polygon elements are the basic elements of the funnel chart, and related drawing configurations are essential:
funnelChart.type: Chart type, the type of funnel chart is 'funnel'
funnelChart.data: Data source for chart drawing
funnelChart.categoryField: Category field, mapped to different graphic elements
funnelChart.valueField: Value field, mapped to the size of the rectangular element or the length of the top and bottom edges of the trapezoidal element
Transformation layers, labels, and other auxiliary elements are displayed only under specific configurations and have slightly different forms:
funnelChart.label: Funnel chart label configuration, displayed when 'visible: true'.
funnelChart.isTransform: Whether to display transformation layer, displayed when the configuration is 'true'.
Tooltip information and other components that assist in chart display are optional configurations with default effects and features:
type: funnel Specifies the chart type as a funnel chart
categoryField Specifies the category field
valueField Specifies the value field
Funnel Chart Features
Data
A discrete field, such as: name, representing different funnel layers
A numeric field, such as: value, representing the values of different funnel layers
It should be noted that, since the funnel chart represents the transformation relationship between different processes, logically, the data has an order and is theoretically greater than 3 phases.
When configured as funnelChart.isTransform: true, the funnel chart adds a transformation layer between layers and automatically calculates the conversion rate, conversion rate = lower data / upper data, which represents the value change of the next step compared to the previous step.
Funnel Chart Alignment
You can specify the funnel chart orientation by funnelChart.funnelAlign: 'left' | 'right' | 'center', with a default value of 'center'.
Funnel Chart Orientation
You can specify the funnel chart orientation by funnelChart.funnelOrient: 'left' | 'right' | 'top' | 'bottom', with a default value of 'top'.
Graphics and Styles
Funnel Chart Element Shape
The funnel chart element shape defaults to a trapezoid, i.e., the default value of funnelChart.shape is 'trapezoid'.
In VChart, the funnel chart shape can also be specified as a rectangle, i.e., funnelChart.shape: 'rect'.
Funnel Bottom Sharp Corner
When the funnel chart element shape is the default trapezoid 'trapezoid', you can specify whether the bottom layer has a sharp corner by funnelChart.isCone, with a default value of true.
Funnel Layer Pixel Spacing
You can specify the pixel spacing between funnel layers by funnelChart.gap, with a default value of 0.
Funnel Maximum and Minimum Width
You can specify the pixel spacing between funnel layers by funnelChart.maxSize and funnelChart.minSize, which support configuring pixel values and percentages. The default values are '80%' and 0, respectively.