VSeed, an elegant data composer, transforming complexity into simplicity.
!!!###!!!title=VChart Load on Demand Tutorial——VisActor/VChart tutorial documents!!!###!!!
VChart Load-on-Demand Tutorial
Quick Start
@visactor/vchart provides all the charts and components of VChart by default. If you don't want to import all components, you can also import the relevant components as needed. Here is an example of how to use it:
If the tree-shaking optimization of your bundle tool is turned off, you need to manually import the internal files from @visactor/vchart/esm/xxx, such as @visactor/vchart/esm/core or @visactor/vchart/esm/component, etc. The usage is as follows:
When you import VChart in the following way, you get an constructor that only contains the core logic.Which does not include any charts, components, plugins, or environment compatibility. Users need to manually import the relevant charts and components, and register them.
import { VChart } from '@visactor/vchart'
The options for registration usually include:
Chart types
Components
Plugins (media queries, formatting, etc.)
Interactions (selection, hover, etc.)
Environment compatibility (Lynx, WeChat Mini Program, Feishu Mini Program compatibility)
Generally speaking, in addition to registering the chart type, it is also necessary to register the necessary components. For example, in a line chart, the axes (continuous and discrete) are indispensable. If they are not registered, the chart cannot be drawn.
This document will explain the rules for component import in as much detail as possible.
How to import charts
VChart currently supports 20+ chart types, which can be imported as follows:
import { registerBarChart } from '@visactor/vchart';
How to import combination charts
A combination chart refers to a chart with type: 'common' in the chart configuration, usually using multiple data series and multiple visual elements, such as line series, bar series, area series, scatter series, pie series, etc., to present various types of data. It is most commonly used to draw dual-axis charts and bar-line combination charts. For a detailed introduction, please refer to theCombination Chart Tutorial.
When introducing as needed, you need to introduce the Common chart and register the series that will be used:
For a list of series register methods, please refer to Appendix I at the end of the document.
How to import components
Users can understand the forms of various functional components in the chart through the related content of Chart Concepts in the tutorial documents, so as to better choose the required components.
For the following Cartesian coordinate system charts, the cartesian coordinate system axes will be registered by default for the calculation of data-to-graphic position mapping.
Line chart, area chart, bar chart, histogram, scatter, heatmap, boxplot, waterfall, intervalBar chart, intervalArea chart, linearProgress chart
Usually, linear axis (registerCartesianLinearAxis) and the band axis (registerCartesianBandAxis) is enough to meet most needs. If you need to use the logarithmic axis (registerCartesianLogAxis) or the time axis (registerCartesianTimeAxis), you need to load them separately.
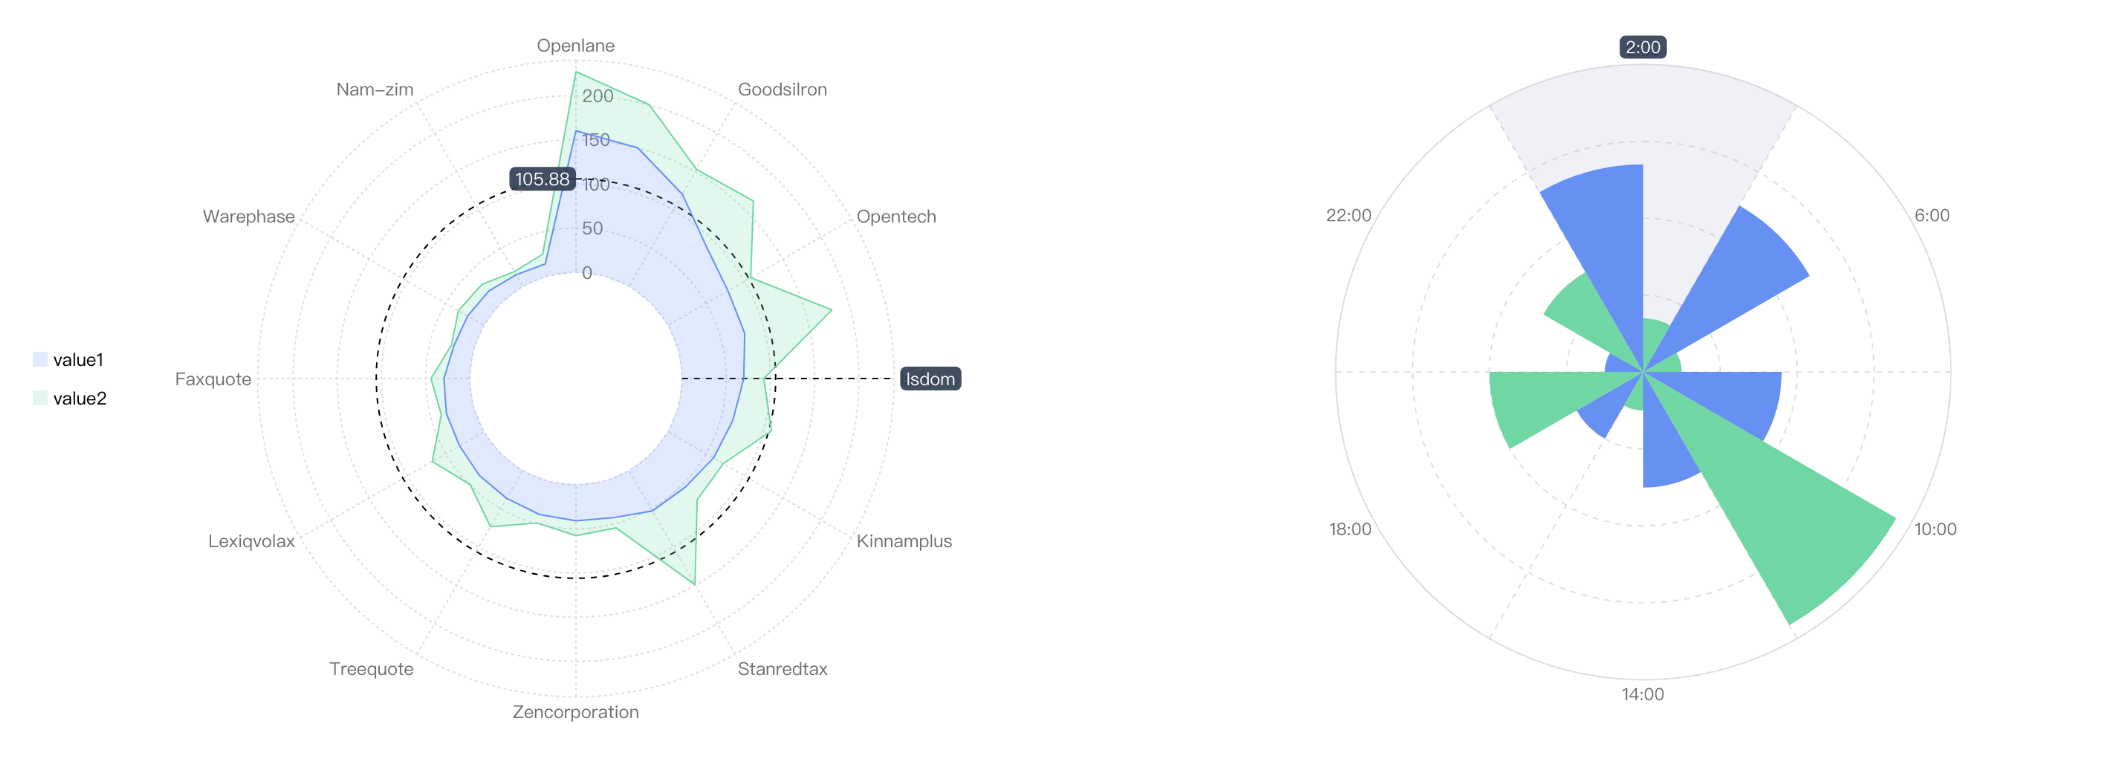
For the following polar coordinate system charts, the polar coordinate system axes will be registered by default.
Radar chart, rose chart, gauge chart, circularProgress chart, circlePacking chart
Other components and their registration methods can be found in Appendix II at the end of the document.
Supplementary: CustomMark components
CustomMark components, namely the customMark and extensionMark items in the chart configuration, are usually used to draw supplementary annotations. The usage can be referred to the Custom Graphic Example.
VChart provides more than 10 types of graphics. In the mode of loading as needed, in order to minimize redundant packaging, graphics need to be manually registered. For example:
import { registerTextMark, registerImageMark } from '@visactor/vchart';

VChart.useRegisters([registerTextMark, registerImageMark]);
Of course, we also provide a method to register all graphics:
import { registerAllMarks } from '@visactor/vchart';

VChart.useRegisters([registerAllMarks]);
For a specific list of graphics and their registration methods, please refer to Appendix III at the end of the document.
How to import plugins
Taking the Media Queryas an example, it can be imported in the following way:
import { registerMediaQuery } from '@visactor/vchart';
React-VChart On-Demand Loading
React-VChart inherently supports on-demand loading. When on-demand loading of VChart is needed, there are two methods:
React-VChart inherently supports on-demand loading. When on-demand loading of VChart is required, there are two methods:
Use the <VChartSimple /> tag to implement custom on-demand loading.
The <VChartSimple /> component and the <VChart /> component are used in almost the same way. The only difference is that users need to import the VChart constructor class from @visactor/vchart and pass it to <VChartSimple />.
interface VChartSimpleProps extends EventsProps {
/** Chart definition */spec: any;
/** Chart configuration */ options?: ChartOptions;
/** Event triggered when the chart has finished rendering */ onReady?: (instance: VChart, isInitial: boolean) =>void;
/** Throw error when the chart encounters an error */ onError?: (err: Error) =>void;
/**
* Switch to synchronous rendering
*
* @since 1.8.3
**/ useSyncRender?: boolean;
/**
* When props are updated, skip the check for all functions, assuming no functions have updated
*
* @since 1.6.5
**/ skipFunctionDiff?: boolean;
/**
* VChart constructor class
*
* @since 1.8.3
**/ vchartConstructor: IVChartConstructor;
}
Use semantic tags, from version 1.11.0, all semantic tags support on-demand loading by default. The default registered components for various semantic tags are as follows:
Chart
Category
Additional Registered Components
<LineChart/>
Cartesian Coordinate
registerLabel
<AreaChart/>
Cartesian Coordinate
registerLabel, registerTotalLabel
<BarChart/>
Cartesian Coordinate
registerLabel, registerTotalLabel
<Bar3dChart/>
Cartesian Coordinate
registerLabel, registerTotalLabel
<BoxPlotChart/>
Cartesian Coordinate
registerLabel,
<HeatmapChart/>
Cartesian Coordinate
registerLabel
<Histogram3dChart/>
Cartesian Coordinate
registerLabel
<HistogramChart/>
Cartesian Coordinate
registerLabel
<LinearProgressChart/>
Cartesian Coordinate
registerLabel
<RangeColumnChart/>
Cartesian Coordinate
registerLabel
<RangeColumn3dChart/>
Cartesian Coordinate
registerLabel
<ScatterChart/>
Cartesian Coordinate
registerLabel
<SequenceChart/>
Cartesian Coordinate
registerLabel
<WaterfallChart/>
Cartesian Coordinate
registerLabel, registerTotalLabel
<RadarChart/>
Polar Coordinate
registerLabel
<RoseChart/>
Polar Coordinate
registerLabel
<CircularProgressChart/>
Polar Coordinate
registerLabel, registerIndicator
<Pie3dChart/>
General
registerLabel, registerIndicator
<PieChart/>
General
registerLabel, registerIndicator
<CirclePackingChart/>
General
None
<FunnelChart/>
General
registerLabel
<Funnel3dChart/>
General
registerLabel
<GaugeChart/>
General
None
<MapChart/>
General
registerLabel
<SankeyChart/>
General
None
<SunburstChart/>
General
None
<TreemapChart/>
General
None
<VennChart/>
General
None
<WordCloud3dChart/>
General
None
<WordCloudChart/>
General
None
<LiquidChart/>
General
registerIndicator
For Cartesian coordinate charts, the default registered components are as follows:
registerCartesianLinearAxis
registerCartesianBandAxis
registerCartesianTimeAxis
registerCartesianLogAxis
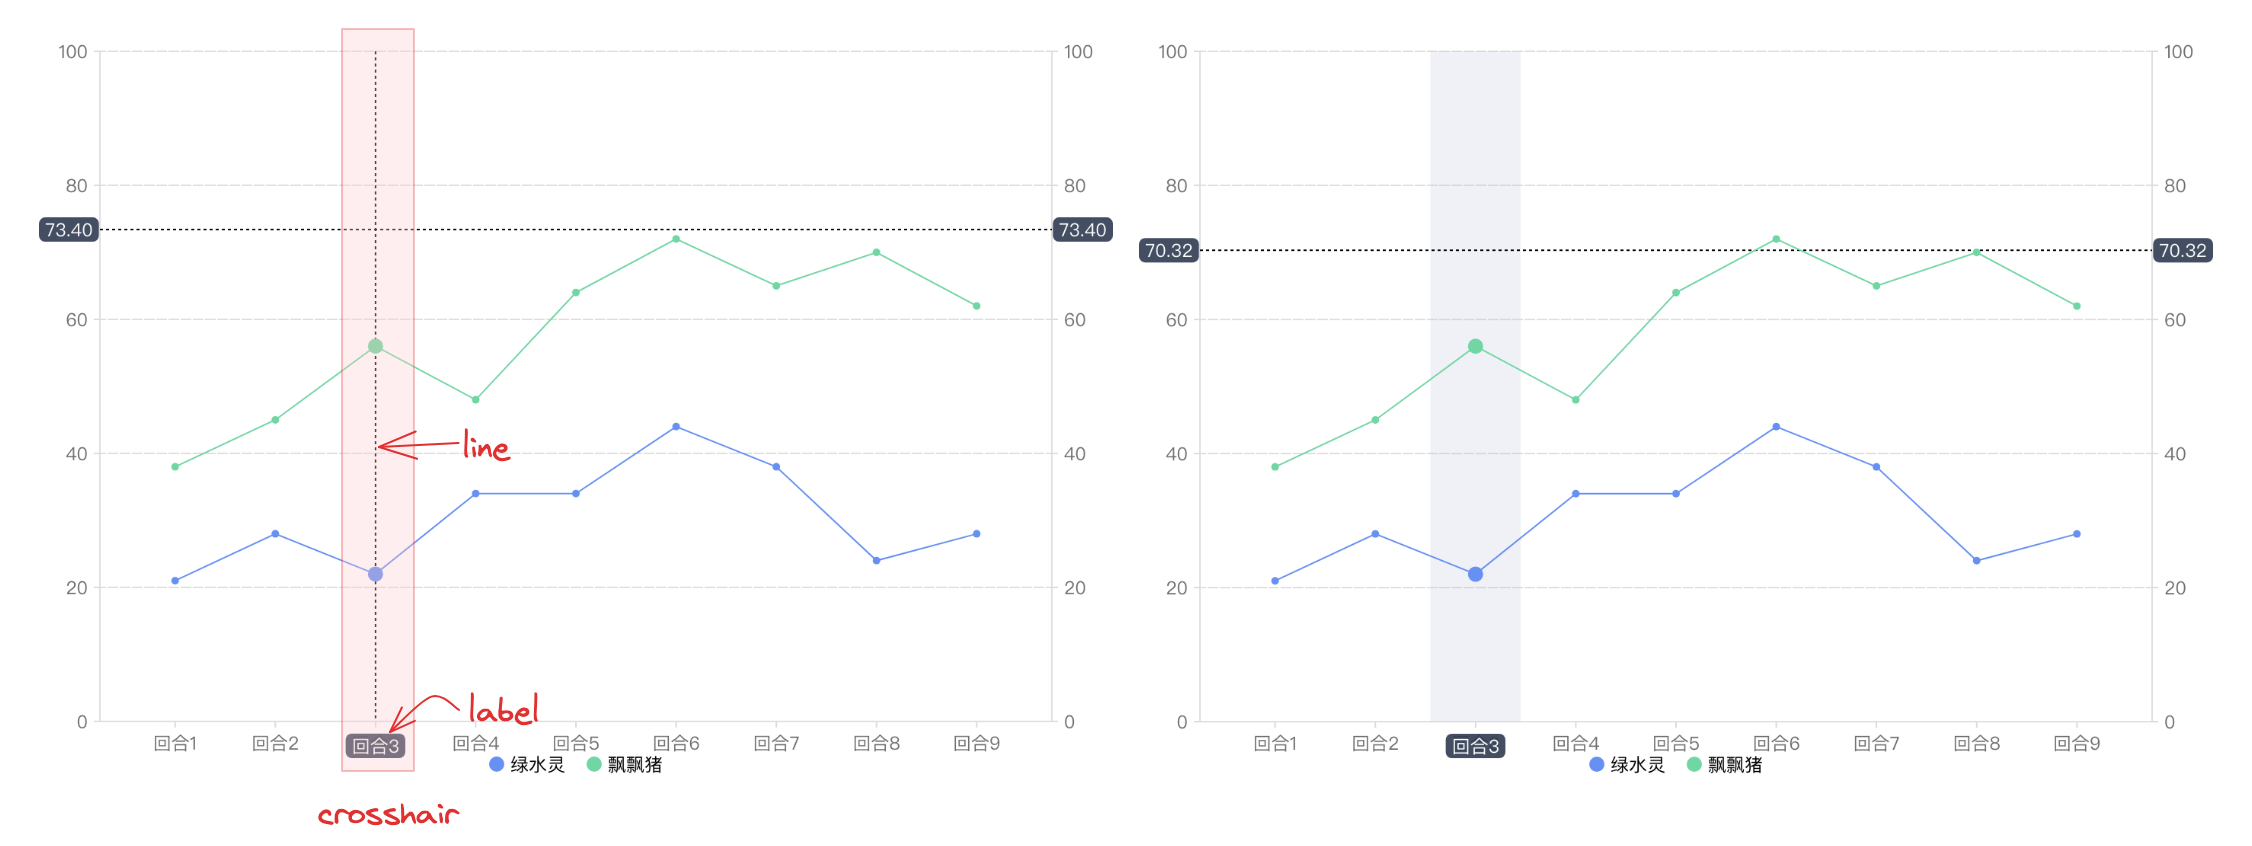
registerCartesianCrossHair
registerBrush
registerContinuousLegend
registerDataZoom
registerDiscreteLegend
registerCustomMark
registerAllMarks
registerMarkArea
registerMarkLine
registerMarkPoint
registerScrollBar
registerTitle
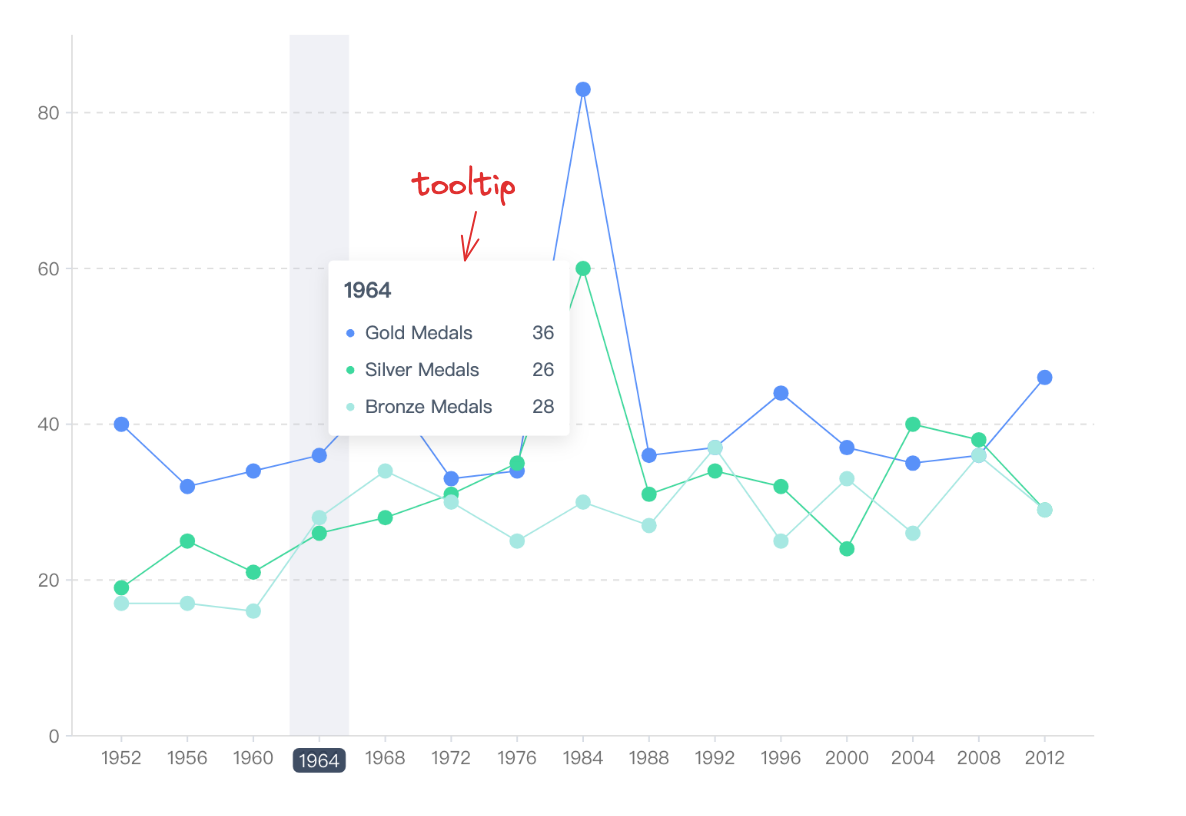
registerTooltip
registerDomTooltipHandler
For polar coordinate charts, the default registered components are as follows:
registerPolarLinearAxis
registerPolarBandAxis
registerPolarCrossHair
registerBrush
registerContinuousLegend
registerDataZoom
registerDiscreteLegend
registerCustomMark
registerAllMarks
registerScrollBar
registerTitle
registerTooltip
registerDomTooltipHandler
For general charts, the default registered components are as follows:
registerDiscreteLegend
registerContinuousLegend
registerCustomMark
registerAllMarks
registerTitle
registerTooltip
registerDomTooltipHandler
When using semantic tags, if other components not loaded by default are needed, simply register the required components.
For more details on on-demand loading, refer to the react-vchart tutorial section.
On-Demand Loading for taro-vchart
taro-VChart inherently supports on-demand loading. There are two ways to achieve on-demand loading when needed:
Using the <VChartSimple /> tag for custom on-demand loading
Supported starting from version 1.10.0
The <VChartSimple /> component and the <VChart /> component are used in almost the same way. The only difference is that users need to import the VChart constructor from @viasctor/vchart/esm/core, register the required charts and components as described in this document, and pass them to <VChartSimple />.
Using semantic tags, all semantic tags support on-demand loading by default, with the default registered content for various semantic tags as follows:
Supported starting from version 1.12.0
Chart
Category
Additional Registered Components
<LineChart/>
Cartesian Charts
registerLabel
<AreaChart/>
Cartesian Charts
registerLabel, registerTotalLabel
<BarChart/>
Cartesian Charts
registerLabel, registerTotalLabel
<Bar3dChart/>
Cartesian Charts
registerLabel, registerTotalLabel
<BoxPlotChart/>
Cartesian Charts
registerLabel
<HeatmapChart/>
Cartesian Charts
registerLabel
<Histogram3dChart/>
Cartesian Charts
registerLabel
<HistogramChart/>
Cartesian Charts
registerLabel
<LinearProgressChart/>
Cartesian Charts
registerLabel
<RangeColumnChart/>
Cartesian Charts
registerLabel
<RangeColumn3dChart/>
Cartesian Charts
registerLabel
<ScatterChart/>
Cartesian Charts
registerLabel
<SequenceChart/>
Cartesian Charts
registerLabel
<WaterfallChart/>
Cartesian Charts
registerLabel, registerTotalLabel
<RadarChart/>
Polar Charts
registerLabel
<RoseChart/>
Polar Charts
registerLabel
<CircularProgressChart/>
Polar Charts
registerLabel, registerIndicator
<Pie3dChart/>
General Charts
registerLabel, registerIndicator
<PieChart/>
General Charts
registerLabel, registerIndicator
<CirclePackingChart/>
General Charts
None
<FunnelChart/>
General Charts
registerLabel
<Funnel3dChart/>
General Charts
registerLabel
<GaugeChart/>
General Charts
None
<MapChart/>
General Charts
registerLabel
<SankeyChart/>
General Charts
None
<SunburstChart/>
General Charts
None
<TreemapChart/>
General Charts
None
<VennChart/>
General Charts
None
<WordCloud3dChart/>
General Charts
None
<WordCloudChart/>
General Charts
None
<LiquidChart/>
General Charts
registerIndicator
For Cartesian coordinate charts, the default registered components are as follows:
registerCartesianLinearAxis
registerCartesianBandAxis
registerCartesianTimeAxis
registerCartesianLogAxis
registerCartesianCrossHair
registerBrush
registerContinuousLegend
registerDataZoom
registerDiscreteLegend
registerCustomMark
registerAllMarks
registerMarkArea
registerMarkLine
registerMarkPoint
registerScrollBar
registerCanvasTooltipHandler
registerTitle
For polar coordinate charts, the default registered components are as follows:
registerPolarLinearAxis
registerPolarBandAxis
registerPolarCrossHair
registerBrush
registerContinuousLegend
registerDataZoom
registerDiscreteLegend
registerCustomMark
registerAllMarks
registerScrollBar
registerCanvasTooltipHandler
registerTitle
For general charts, the default registered components are as follows:
registerDiscreteLegend
registerContinuousLegend
registerCustomMark
registerAllMarks
registerTitle
registerTooltip
registerCanvasTooltipHandler
When using semantic tags, if other components not loaded by default are needed, simply register the required components.
For more details on on-demand loading, refer to the taro-vchart tutorial section.
Cross-platform Related
VChart provides support for the browser and node environments by default. If your project needs to run in a mini-program environment, please note to import the mini-program environment code when loading on demand.
For example, when using in WeChat Mini Program, you need to call registerWXEnv:
import { registerWXEnv } from '@visactor/vchart';
VChart.useRegisters([registerWXEnv]);
The environment compatibility registrars currently supported by VChart include:
Environment
Component Registration Method
Browser
registerBrowserEnv
Node
registerNodeEnv
WeChat Mini Program
registerWXEnv
Lark Mini Program
registerLarkEnv
Lynx
registerLynxEnv
All of the above
registerAllEnv
FAQ
Why is on-demand loading not working in the development environment?
In the development environment, tree-shaking is not applied, so the following on-demand import is equivalent to import VChart from '@visactor/vchart' (full import).
However, note that tree-shaking will be enabled during the build, so missing necessary imports may cause runtime errors.
How to fix the issue when NuxtJs works in development but errors after build?
In NuxtJs, on-demand loading requires the following configuration in nuxt.config.ts, otherwise an error indicating that CommonJS imports are not supported will occur.
Appendix II: List of component registration methods
Component
Component Registration Method
Actual Scenario Illustration
Discrete Legend
registerDiscreteLegend
Continuous Legend
registerContinuousLegend
Tooltip
registerTooltip
Tooltip includes two rendering methods, canvas and dom: Usually in a browser
environment, you need to registerregisterDomTooltipHandler In non-browser environments such as
mini programs and node, you need to registerregisterCanvasTooltipHandler
Crosshair (Cartesian Coordinate System)
registerCartesianCrossHair
Crosshair (Polar Coordinate System)
registerPolarCrossHair
Zoom Slider
registerDataZoom
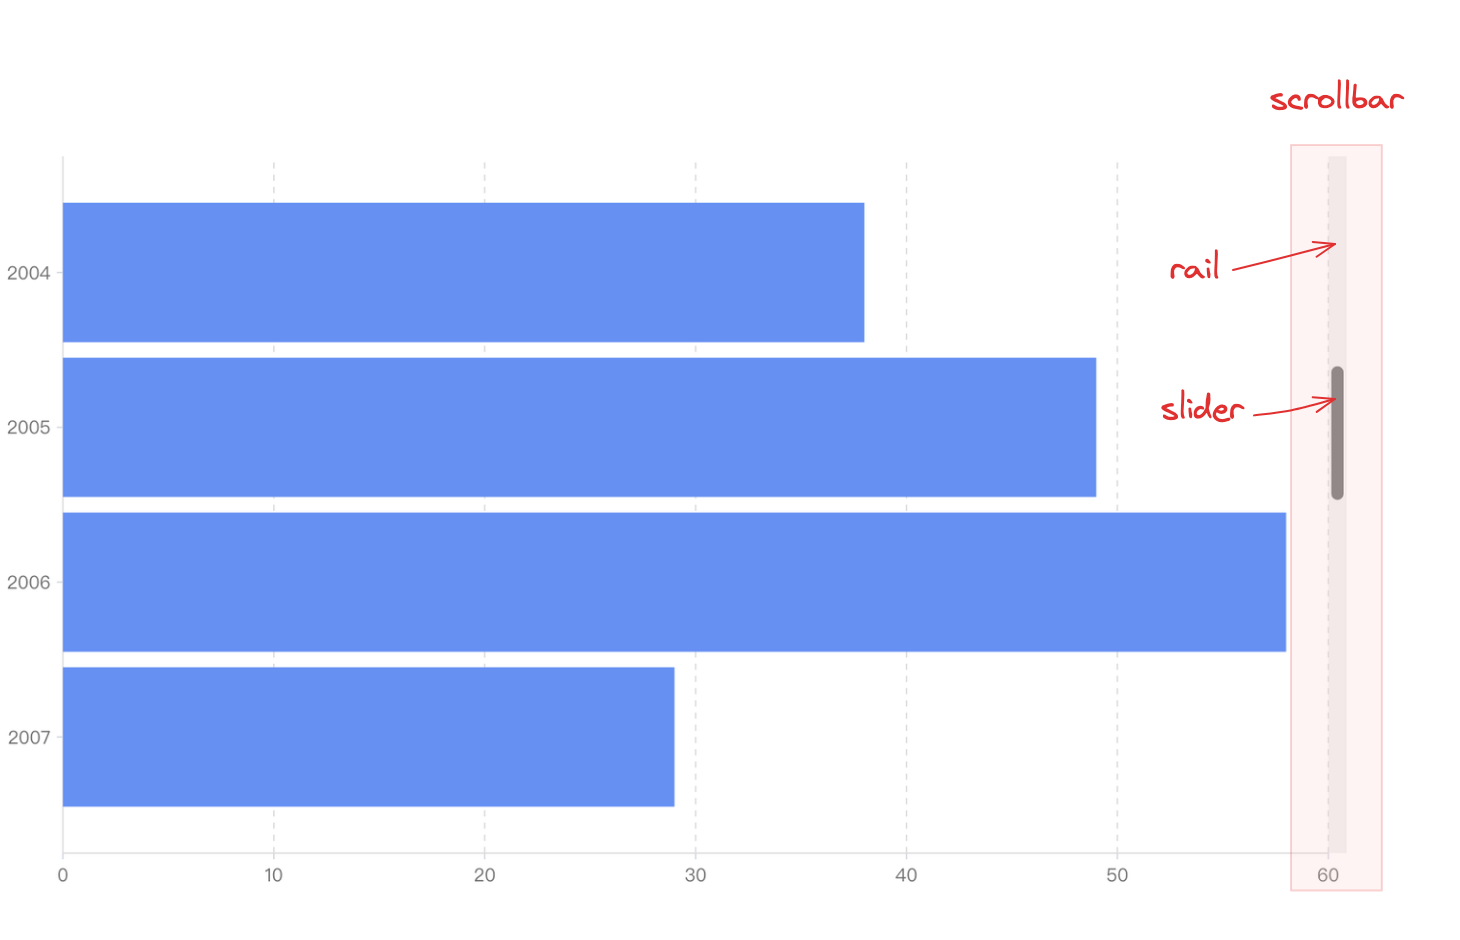
Scrollbar
registerScrollBar
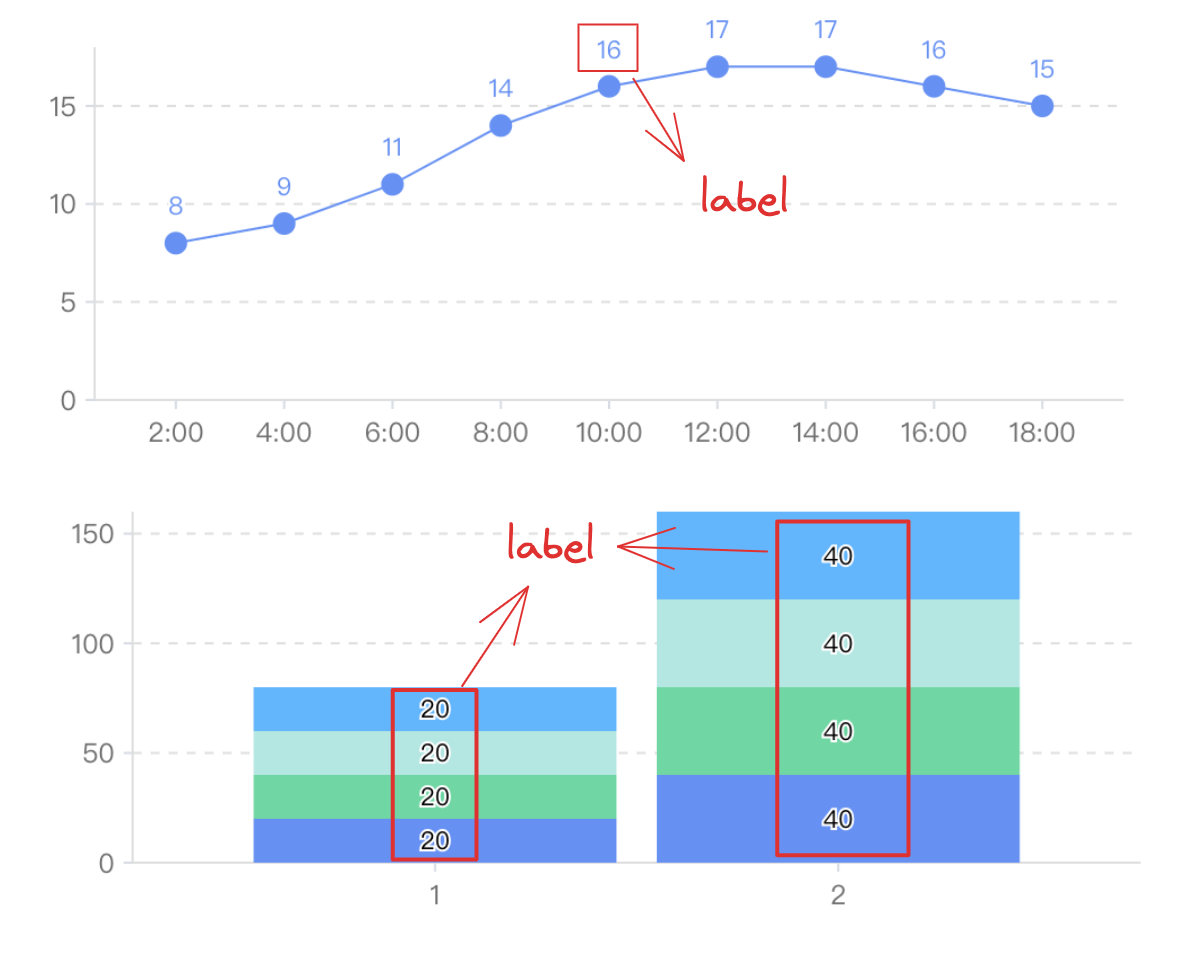
Label
registerLabel
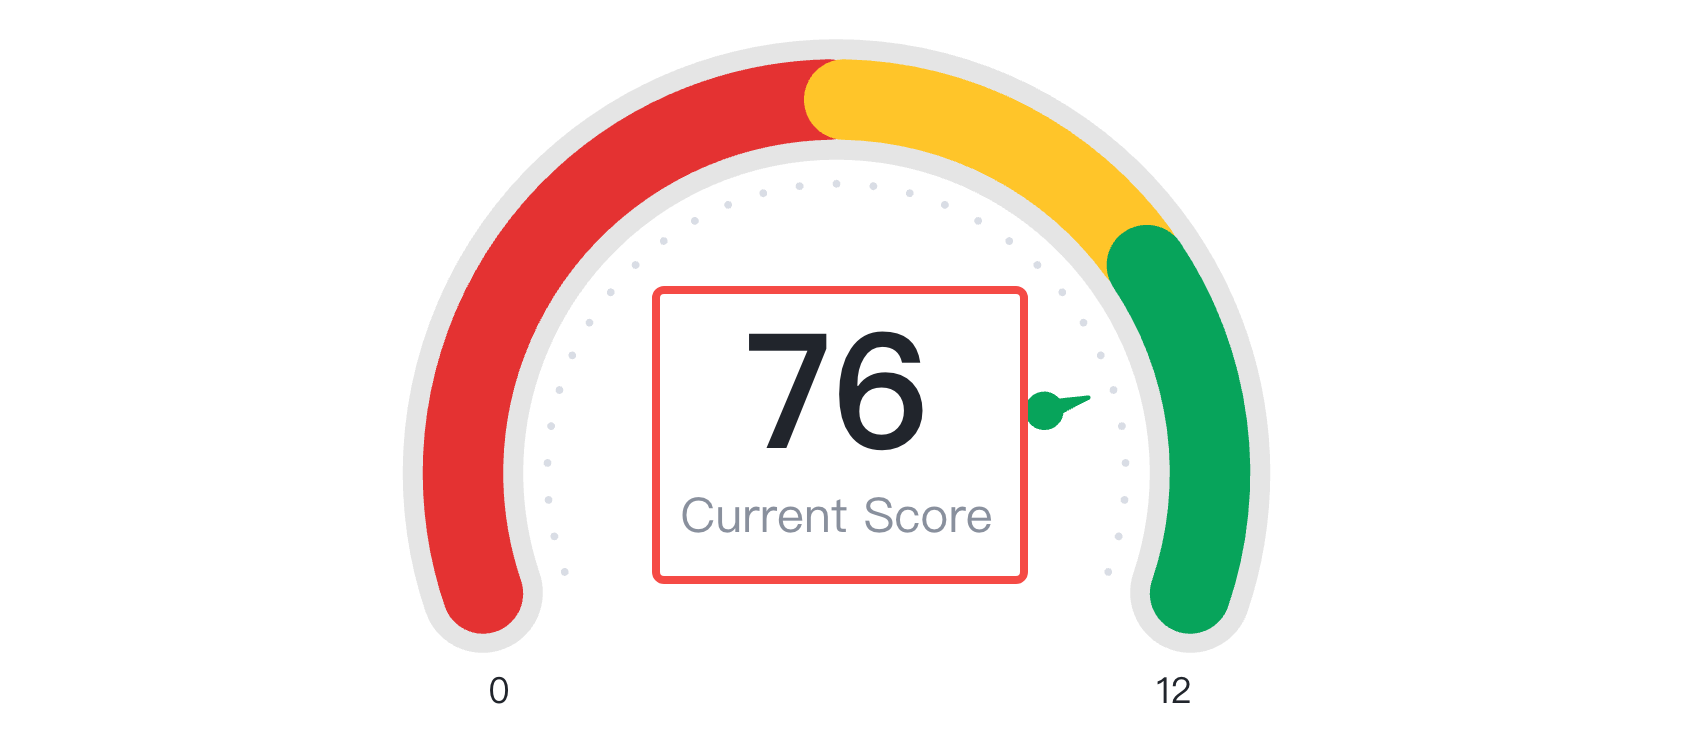
Indicator
registerIndicator
Commonly used for numerical indicator card display in pie charts and dashboard charts.
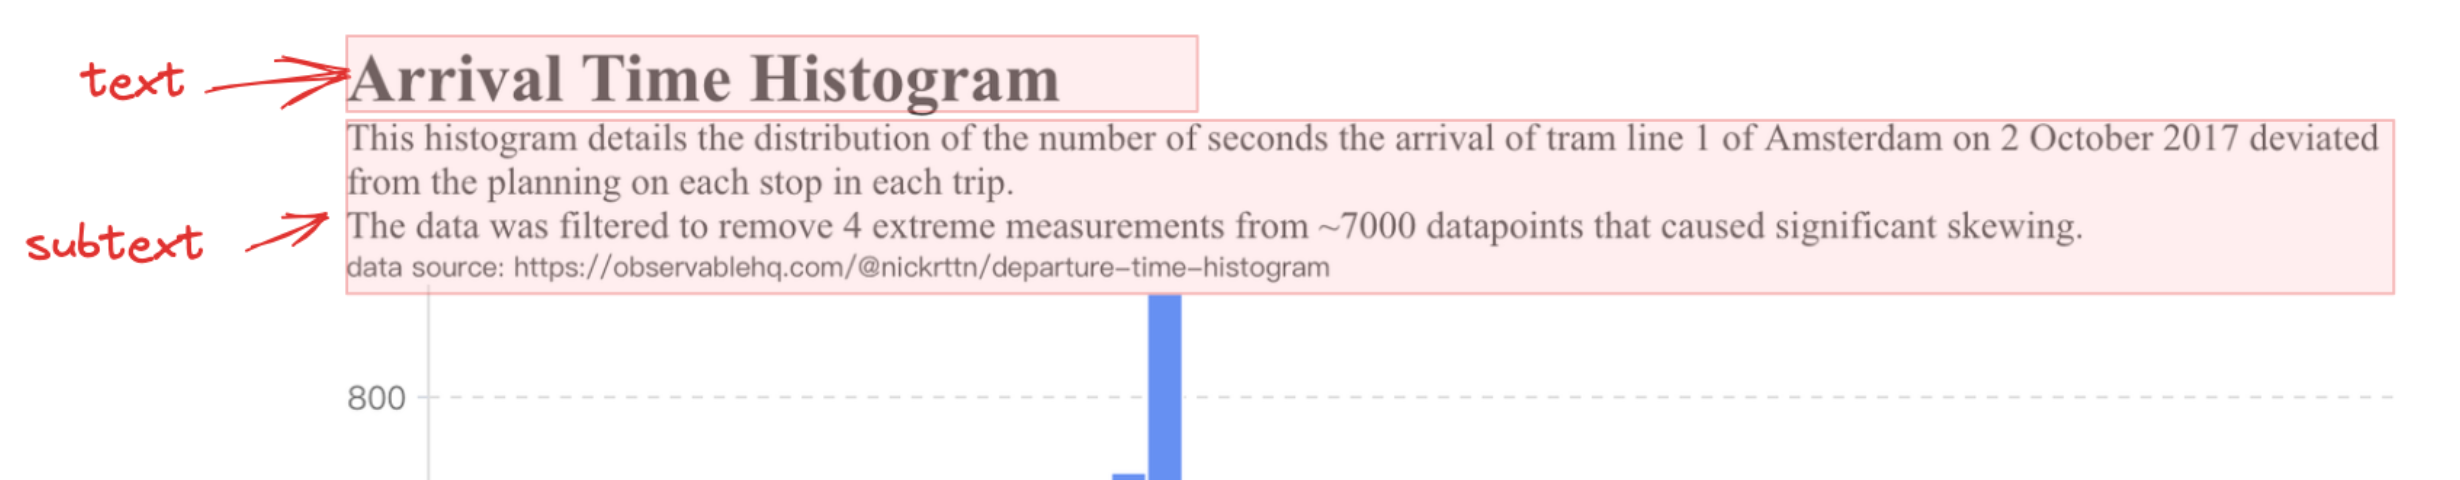
Title
registerTitle
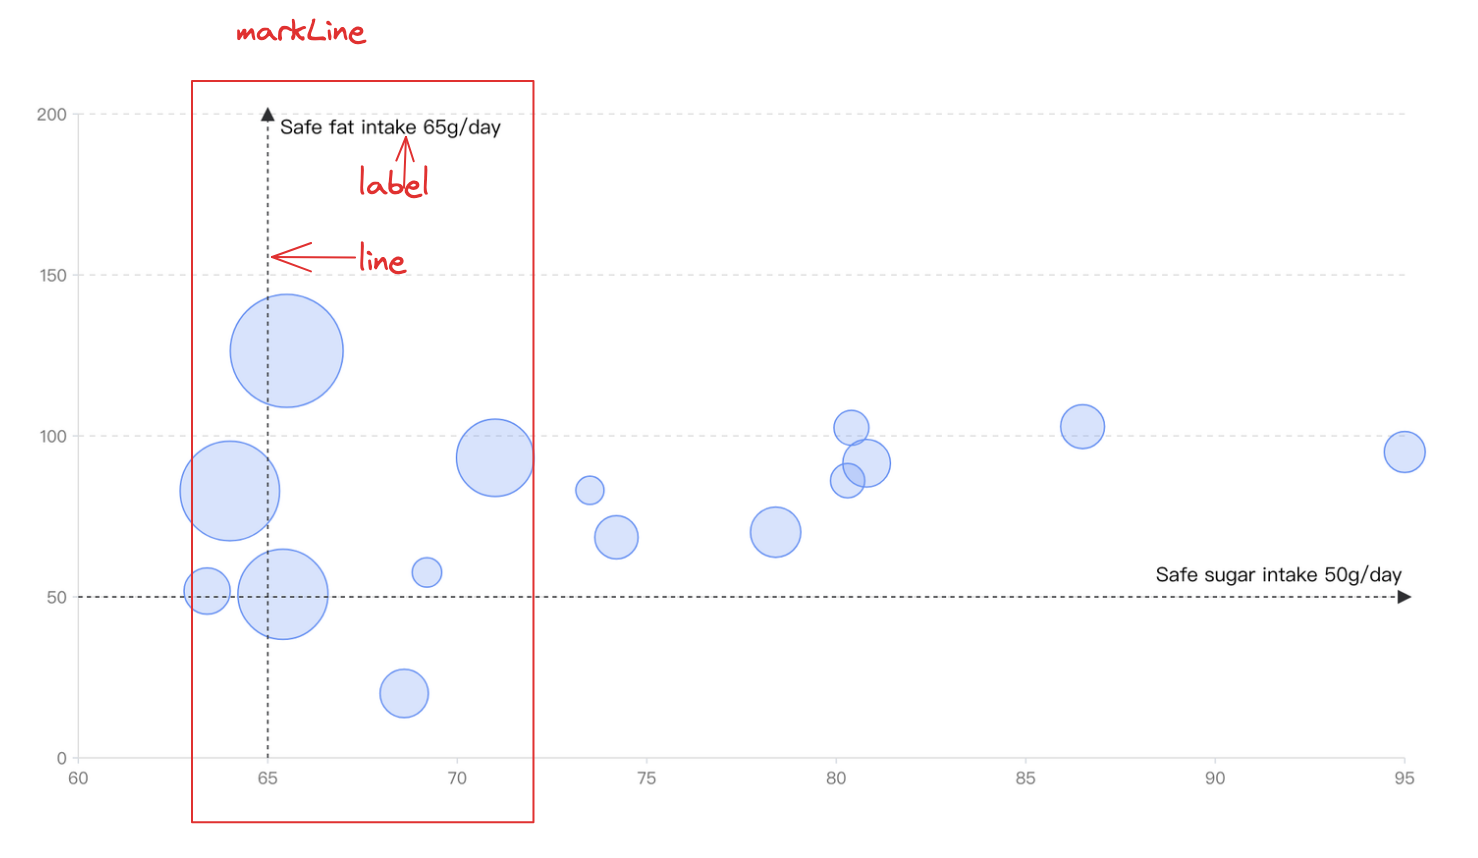
Mark Line
registerMarkLine
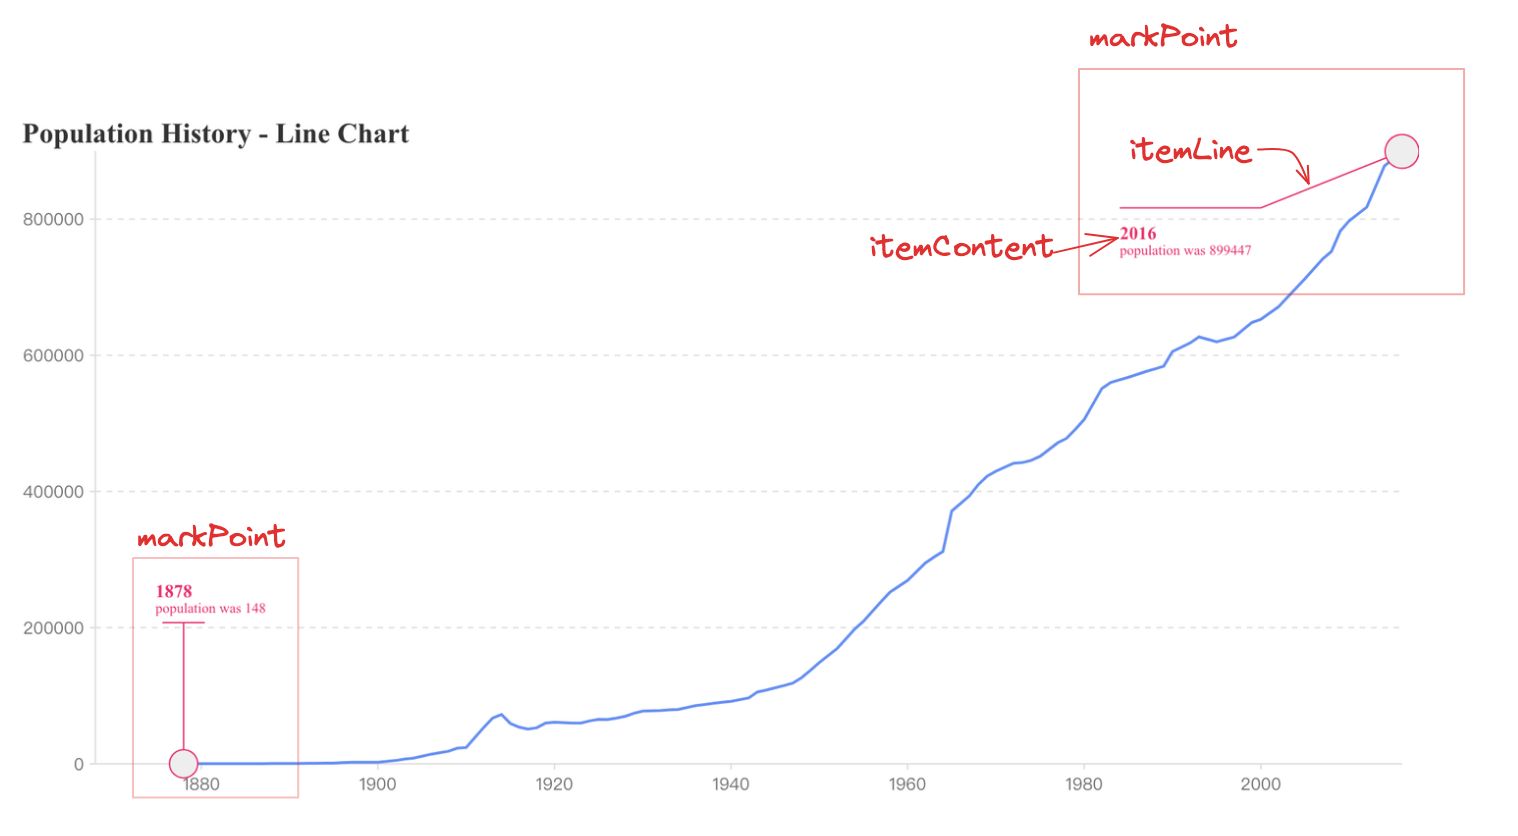
Mark Point
registerMarkPoint
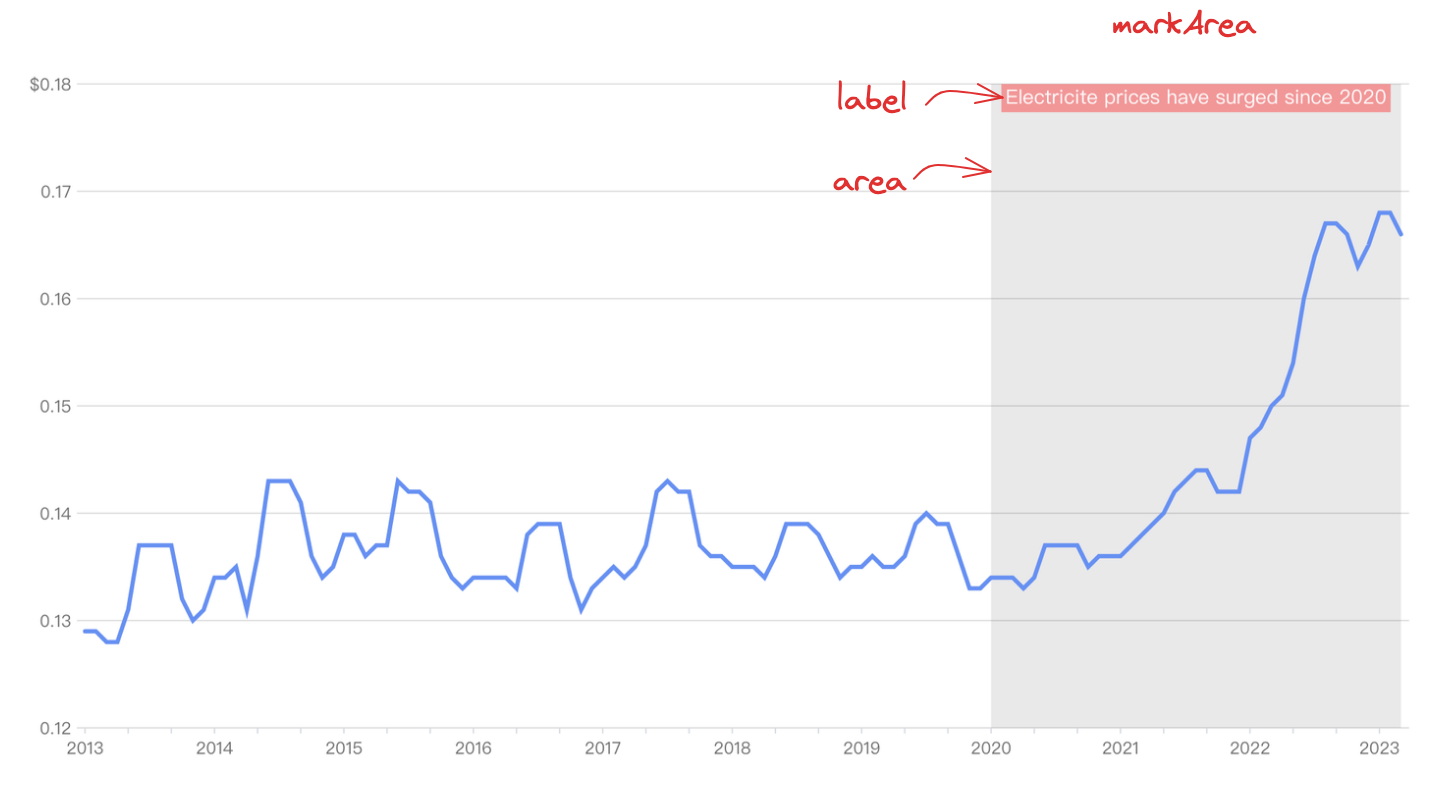
Mark Area
registerMarkArea
Total Label
registerTotalLabel
Usually used for stacked charts to display the total stack.
Brush
registerBrush
Custom Mark
registerCustomMark
Provides the ability to extend custom drawing.
Player
registerPlayer
Appendix III: List of graphic registration methods
Mark
Mark Register
Scene Illustration
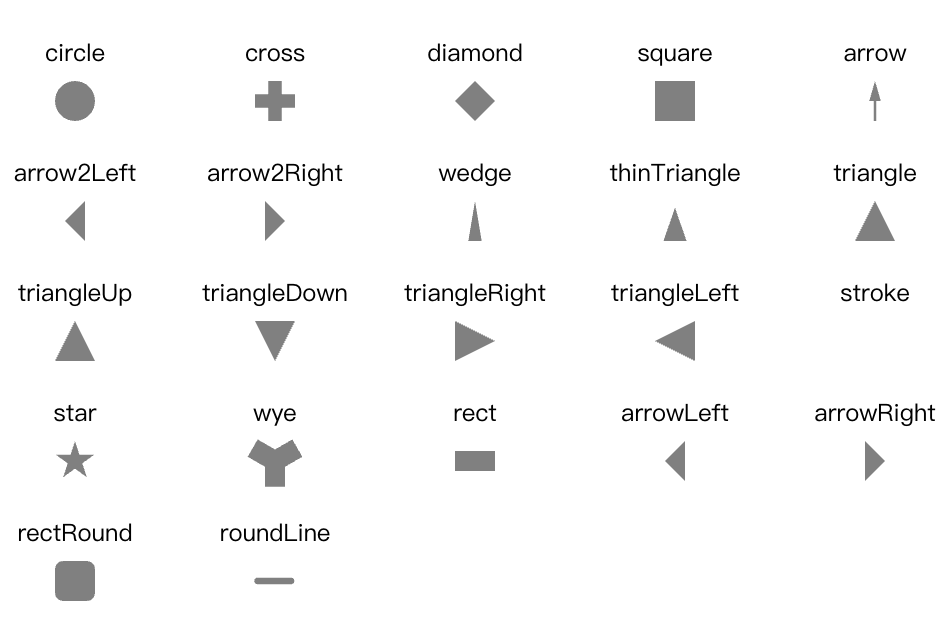
Symbol
registerSymbolMark
Symbol mark is used to draw specific shapes such as circles and rectangles, and can create visualization effects like scatter plots.Support : 1. Built-In shapes,Please refer toexample
2. svg path
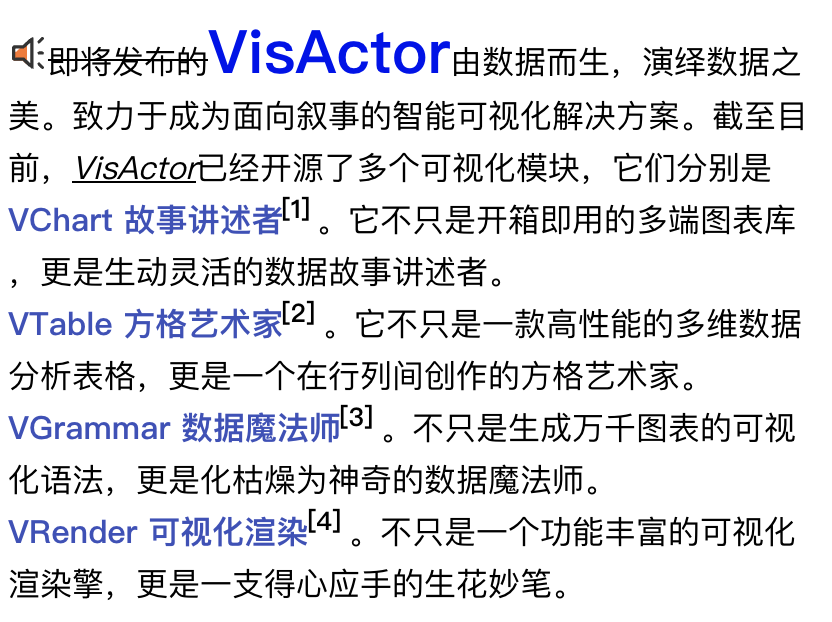
Text
registerTextMark
ext mark is used to draw text and can create visualization effects such as labels and titles. Text mark supports both regular text and rich text. 1. Regular text
Rectangle mark is used to draw rectangles and can create visualization effects such as bar charts. Please refer toexample
Image
registerImageMark
Image mark is used to insert images in visualization scenes, creating visualization effects such as backgrounds and icons. Please refer toexample
Polygon
registerPolygonMark
Polygon mark is used to draw polygons and can create visualization effects such as funnel charts and convex hulls. Please refer toexample
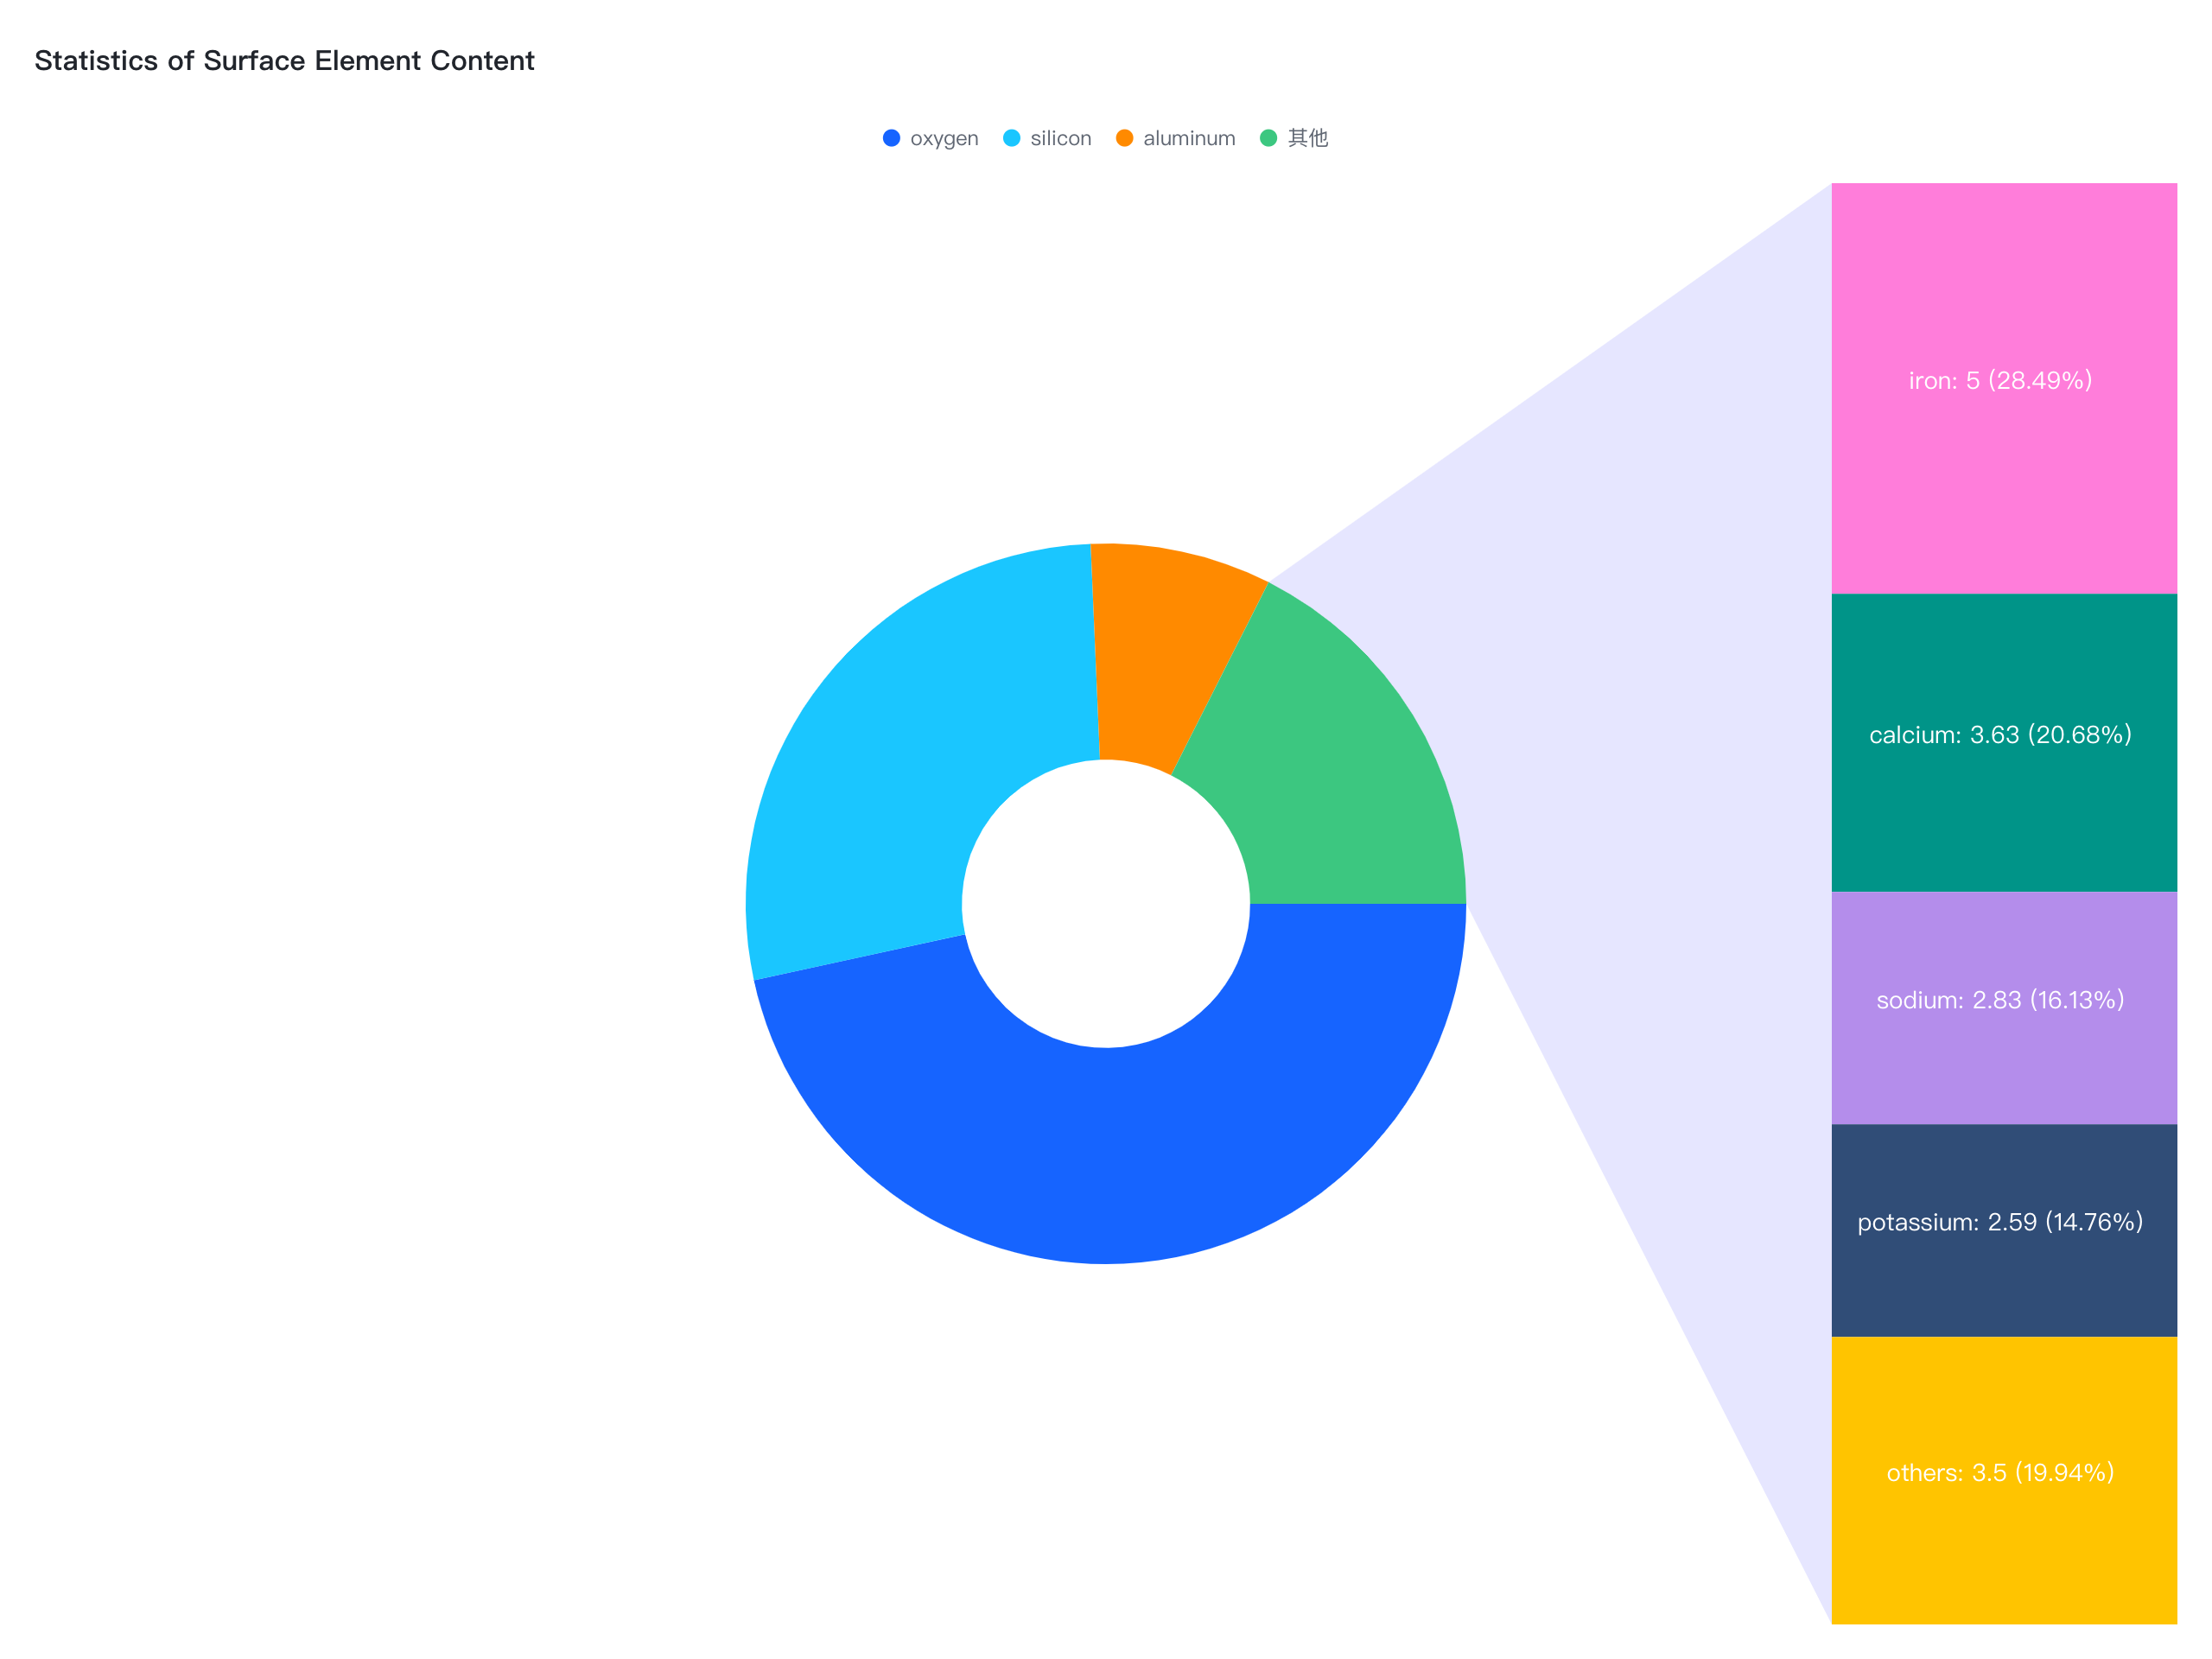
Arc
registerArcMark
Arc mark s used to draw arcs and can create visualization effects such as pie charts and ring charts. Please refer toexample
Group
registerGroupMark
Group mark are used to group multiple primitives for unified operations such as scaling and translation. It should be noted that group mark is different from other basic marks and do not support data mapping. A declared Group Mark can only correspond to a single final group graphic element. Please refer toexample
Line
registerLineMark
Line mark is used to draw lines and can create visualization effects such as line charts.
Rule
registerRuleMark
Rule mark is used to draw straight lines and can create visualization effects such as guide lines and reference lines.
Area
registerAreaMark
Area mark is used to draw areas between closed curves and coordinate axes, creating visualization effects such as area charts.
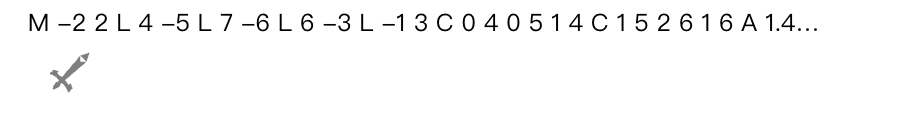
Path
registerPathMark
Path mark is used to draw arbitrary shapes of paths, creating visualization effects such as custom shapes and geographic trajectories.
Ripple
registerRippleMark
RipplePoint is a point glyph with a ripple effect, typically used to emphasize a specific data point or indicate data changes at a specific location. In map visualization and time series analysis, RipplePoint glyphs can express the spatial distribution of data and the dynamic process of data change. Application scenarios include showing the spread of earthquakes, epidemics, news events, etc.
3D Rectangle
registerRect3dMark
3D rectangle mark is used to draw cuboids and can create visualization effects such as bar charts in 3D visualizations.
3D Arc
registerRect3dMark
3D arc mark is used to draw cylinders and can create visualization effects such as pie charts and ring charts in 3D visualizations.
3D Pyramid
registerPyramid3dMark
3D pyramid marks is used to draw pyramid-shaped hexahedrons and can create visualization effects such as funnel charts in 3D visualizations.