VSeed, an elegant data composer, transforming complexity into simplicity.
!!!###!!!title=Lark Mini Program——VisActor/VChart tutorial documents!!!###!!!!!!###!!!description=We provide the `@visactor/lark-vchart` chart component library for Lark Mini Programs, which can be introduced via `npm`.Example project: [examples](https://github.com/VisActor/VChart/tree/main/packages/lark-vchart/gallery) can be imported using Lark Developer Tools.!!!###!!!
Lark Mini Program
We provide the @visactor/lark-vchart chart component library for Lark Mini Programs, which can be introduced via npm.
Example project: examples can be imported using Lark Developer Tools.
Due to serialization issues, the Feishu applet currently does not support passing complex objects and functions in setData and triggerEvent, and only supports serializable data. Therefore the events function, chartinit callback parameter, chartready callback parameter are temporarily unavailable.
If you need to use callbacks on the chart spec, you can currently solve this problem through the following methods. Let's take the label text callback function for the pie chart as an example (specific code: link), the detailed steps are as follows (users can adjust the strategy according to the situation, only a basic idea and steps are provided here):
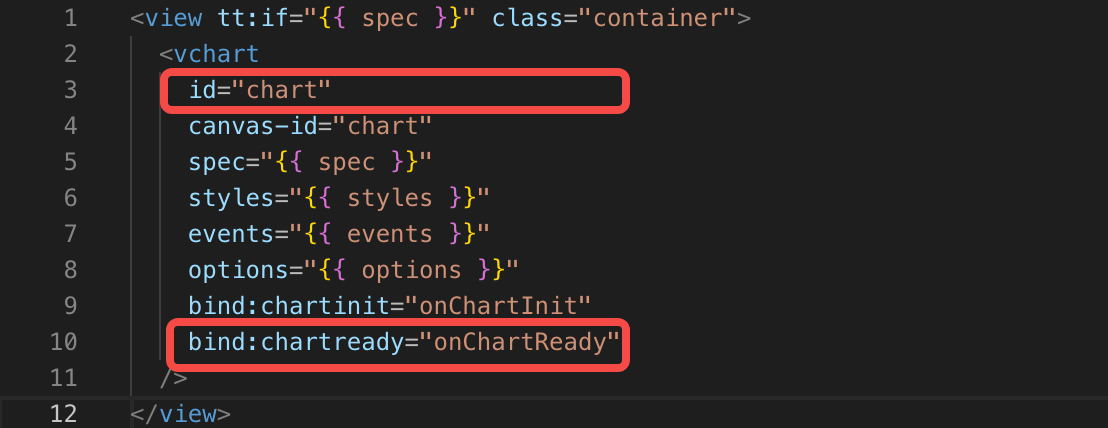
step1: Configure the id and chartOnReady events when declaring the chart component so that updateSpec can be updated after the empty chart is rendered.
step2: When initializing the chart, declare an empty chart (the chart type and data must be declared, and the data can be declared as an empty array)
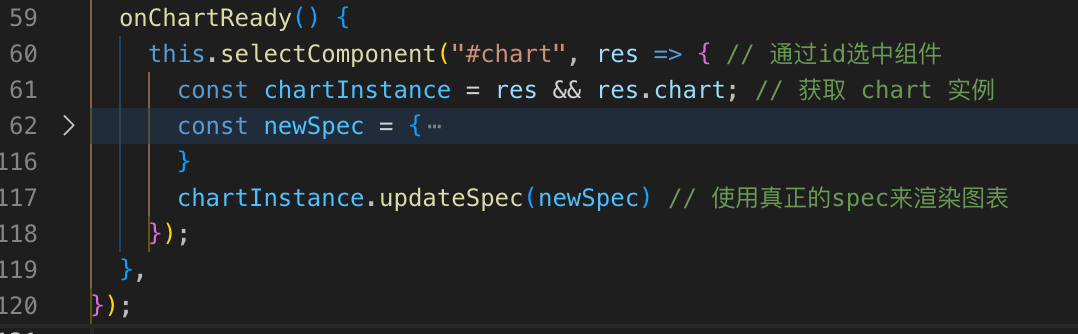
step3: In the onChartReady event, obtain the component and chart instance through selectComponent, and update the spec of the chart instance
Effect: The callback function of the pie chart label takes effect successfully.
2. How to get the chart instance
For some functions that require the use of chart instances, you can currently use selectComponent to indicate the id attribute to the component <chart id="chart1"> Finally, get the chart instance through selectComponent, as shown below:
onChartReady() {
console.log('chart instance rendering completed');
this.selectComponent("#chart1", res => {
const chartInstance = res && res.chart; // Get chart instance// ... });
},
API
The usage of the @visactor/lark-vchart chart component is shown below:
canvas-id is the chart id, consistent with the id of the dom. Please make sure the id is not duplicated.
spec is the core concept of VChart, with the spec of the cross-end component consistent with the PC side. Chart configuration examples can be found in VChart Examples. For users unfamiliar with VChart, please refer to the Getting Started with VChart tutorial.
styles are the chart container styles, which can be used to control chart width, height, etc.
events is an array of objects used to register a series of events, defined as follows. For specific event names, event filter configurations, and callback function parameters, please refer to VChart Event API
interfaceIEvent {
/**
* Name of the event
*/ type: string;
/**
* Event API's event filtering configuration
*/ query?: object;
handler: (event) => void;
}
bind:chartinit is a callback function, called when the chart initialization is complete.
bind:chartready is a callback function, called when the chart rendering is complete.
How to Use
Prerequisites
Before using the VChart Lark Mini Program component library, please make sure you have read the relevant documentation on the Lark Open Platform.