!!!###!!!title=Series Break——VisActor/VChart tutorial documents!!!###!!!!!!###!!!description=The series break component is used in conjunction with the axis break function to display breaks in the series of a chart.Currently, the following series types support break display:- `bar` series- `line` series- `area` series
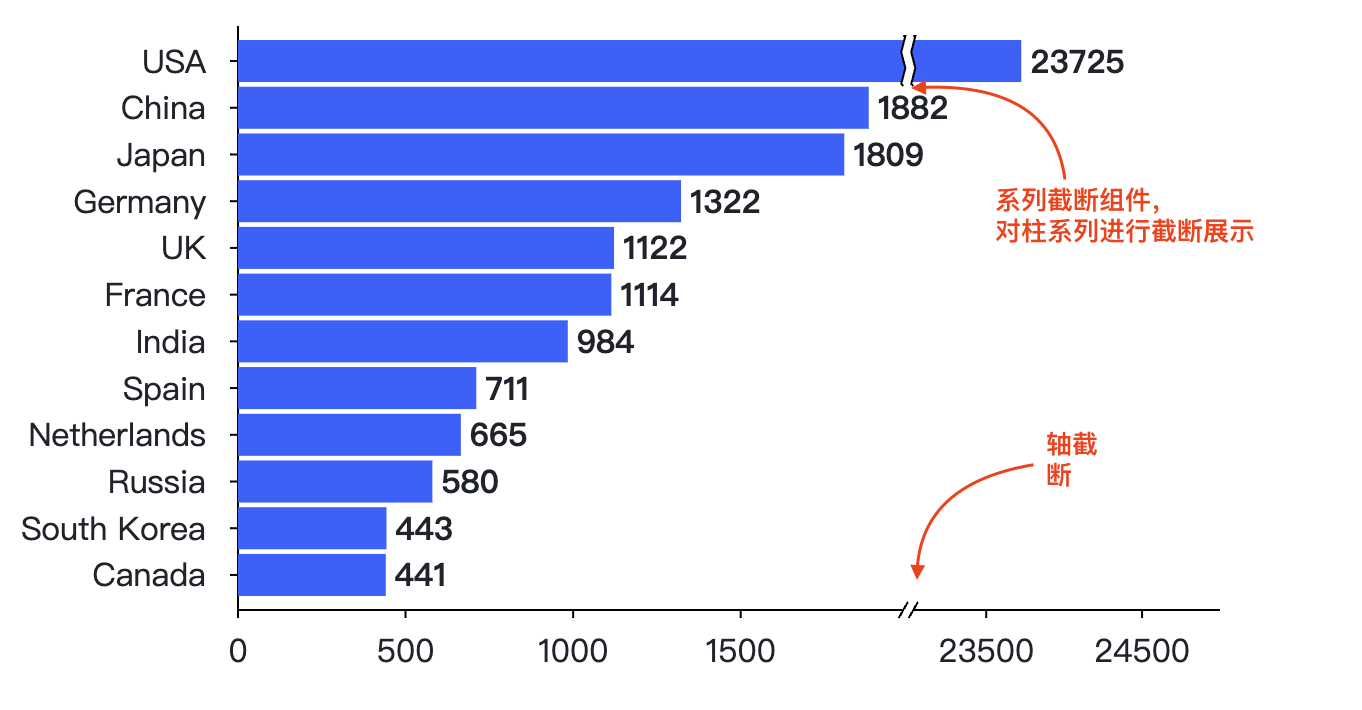
![img](/vchart/guide/extension/series-break.png)!!!###!!!

Series Break Component

The series break component is used in conjunction with the axis break function to display breaks in the series of a chart. Currently, the following series types support break display:

  • bar series
  • line series
  • area series

How to Enable Axis Break

Axis break is a feature supported by the VChart main package, so it only needs to be enabled on the axis. Currently, only continuous axes support the axis break function. The configuration example is as follows:

axes: [
  {
    orient: 'left',
    breaks: [
      {
        range: [2100, 22900]
      },
      {
        range: [700, 900]
      }
    ],
    nice: false,
    tick: {
      tickMode: 'd3'
    },

    domainLine: {
      visible: true
    }
  }
];

For detailed configuration, refer to: Bar Chart Axis Break Configuration

How to Enable Series Break

The series break component needs to be registered on the chart. The registration and usage method is as follows:

import VChart from '@visactor/vchart';
import { registerSeriesBreak, appendSeriesBreakConfig } from '@visactor/vchart-extension';

const spec = {
  //  your spec
};
registerSeriesBreak();
appendSeriesBreakConfig(spec);

const vchart = new VChart(spec, { dom: 'chart' });
vchart.renderSync();

If using the CDN import method, the registration method is as follows:

<script src="https://cdn.jsdelivr.net/npm/@visactor/vchart/build/index.min.js"></script>
<script src="https://cdn.jsdelivr.net/npm/@visactor/vchart-extension/build/index.min.js"></script>
<script>
  const spec = {
    //  your spec
  };
  VChartExtension.registerSeriesBreak();
  VChartExtension.appendSeriesBreakConfig(spec);

  const vchart = new VChart.default(spec, { dom: 'chart' });
  vchart.renderSync();
</script>

Axis Break Example