
3D Funnel Chart
Introduction
The configuration of a 3D funnel chart mostly inherits from the general word cloud configuration. The difference is that the type needs to be set to funnel3d, and the VChart instance needs to be added with the option3d configuration.
Chart Composition
A funnel chart is composed of hierarchical polygon elements (these polygons are trapezoids by default, and can also be rectangles depending on the user's configuration), transformation layers, labels, and other components.
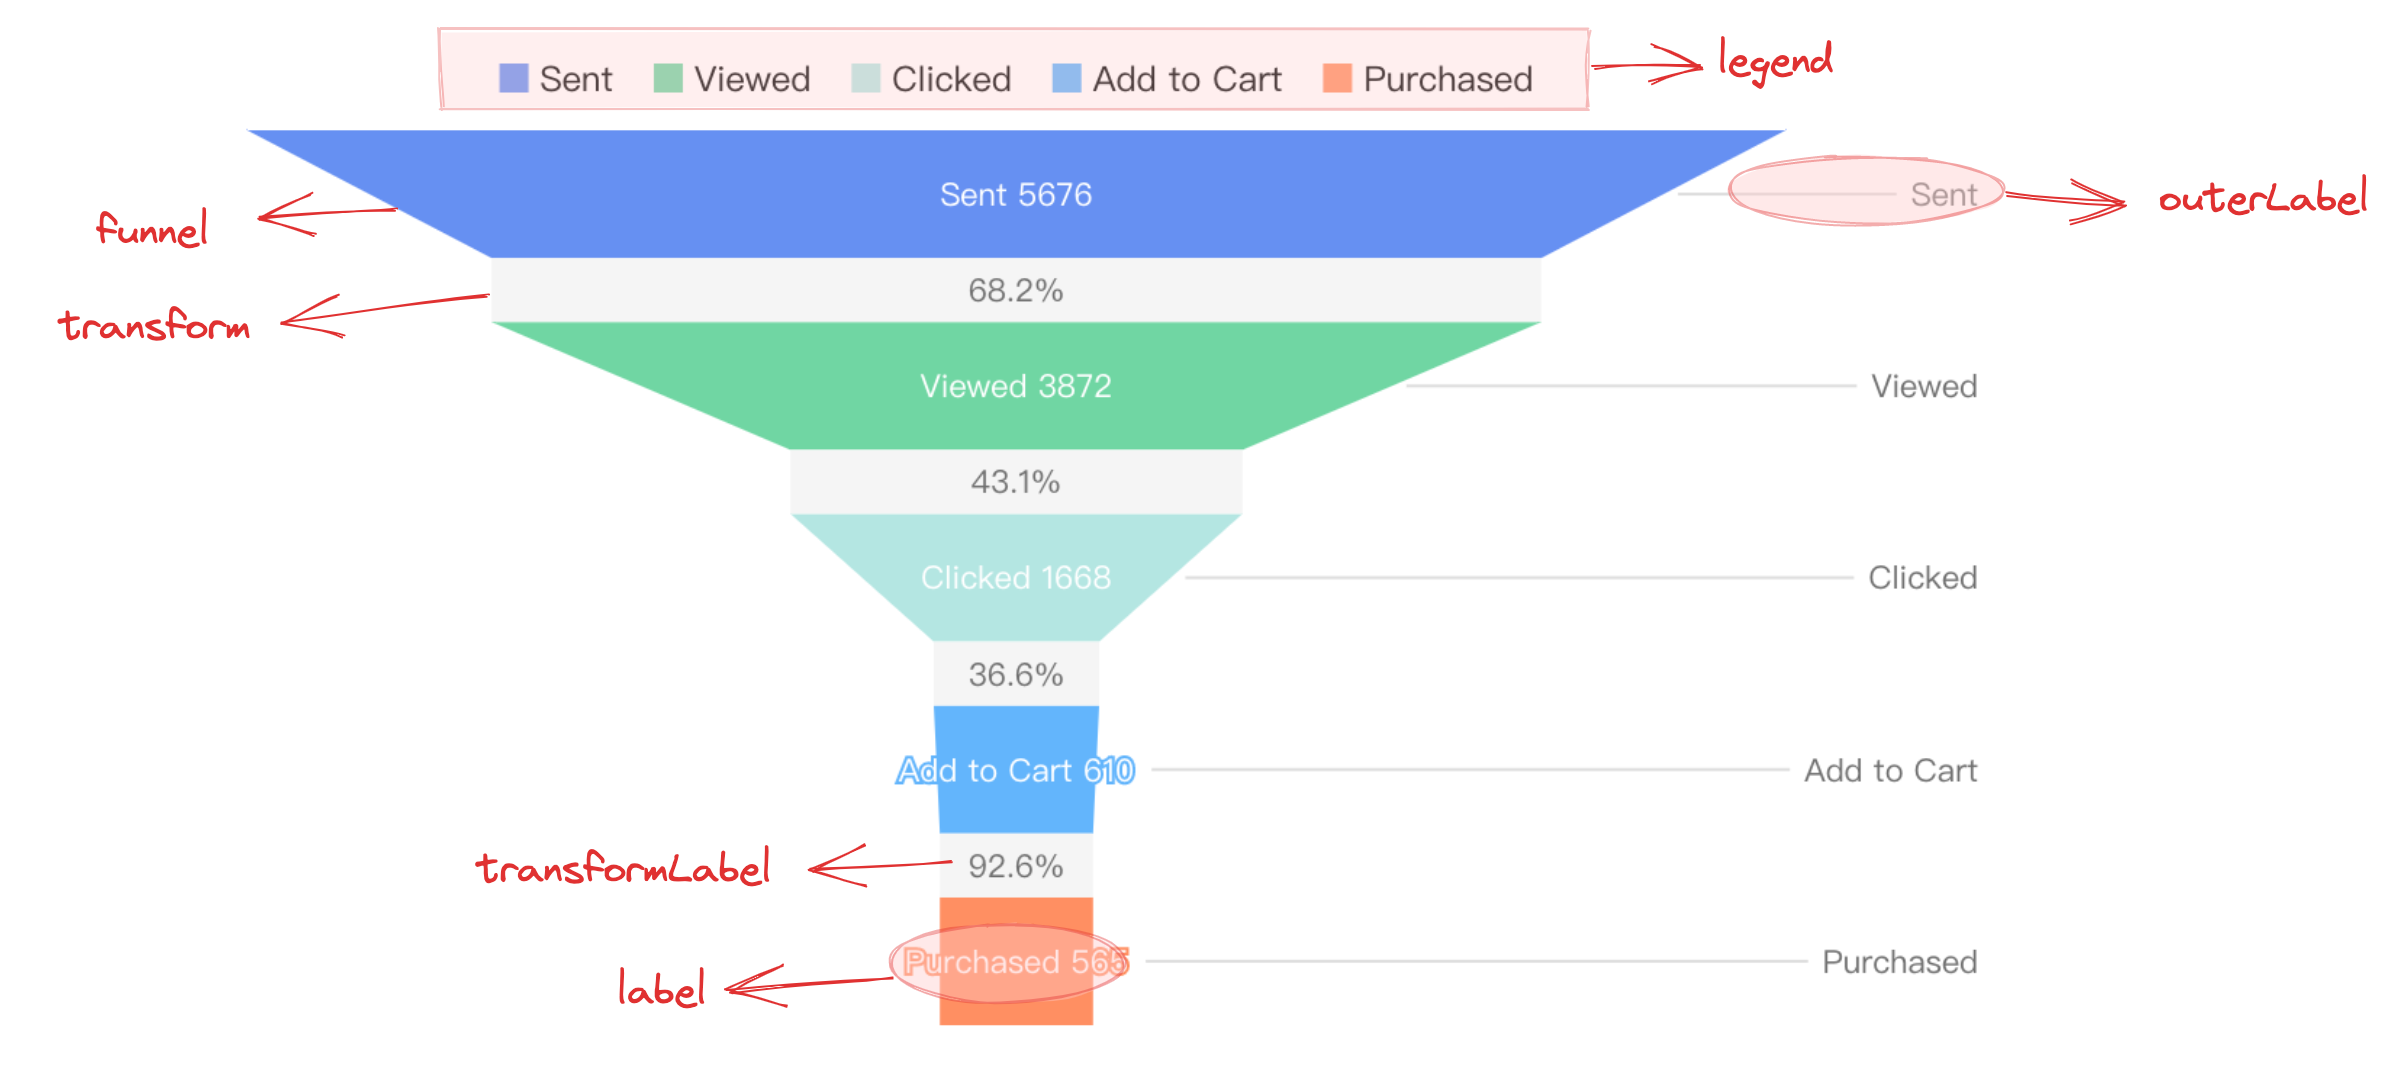
Polygon elements are the basic components of a funnel chart, and their related drawing configurations are essential:
funnelChart.type: Chart type, the type for funnel chart is'funnel3d'funnelChart.data: The data source for chart renderingfunnelChart.categoryField: Category field, mapped to different elementsfunnelChart.valueField: Value field, mapped to the size of the rectangular element or the length of the top and bottom edges of the trapezoidal element
Transformation layers, labels, and other auxiliary elements are only displayed in specific configurations and have slightly different display forms:
funnelChart.label: Funnel chart label configuration, displayed when 'visible: true'.funnelChart.isTransform: Whether to display the transformation layer, displayed when the configuration is 'true'.
Tooltip information and other components that assist in chart presentation are optional configurations that come with default effects and functions:
funnelChart.tooltip: Tooltip information, displayed by default during interaction, for detailed configuration see VChart Tooltip Component Configuration- For more component configurations, see VChart funnelChart Configuration
As a 3D chart, a 3D scatter plot requires enabling the 3D view, which needs to be configured in the initialization parameters of vchart:
options3d.enable: Enable 3D view
Quick Start
For other configurations, refer to Funnel Chart