It is not only a fully functional graph visualization library, but also an explorer of data relationships.
!!!###!!!title=Marker Data Annotation——VisActor/VChart tutorial documents!!!###!!!!!!###!!!description=Marker is a chart auxiliary annotation component designed to enhance data perception and assist data narration, commonly used to highlight a specific data point or display the statistical results of multiple data points. **It should be noted that this component currently only supports Cartesian coordinate system charts.**This tutorial mainly explains the related concepts and components of the Marker component. For more detailed configuration and examples of the Marker component, please refer to the [Configuration Documentation](../../../option) and [Example](../../../example) pages.!!!###!!!
Marker Data Annotation
Marker is a chart auxiliary annotation component designed to enhance data perception and assist data narration, commonly used to highlight a specific data point or display the statistical results of multiple data points. It should be noted that this component currently only supports Cartesian coordinate system charts.
This tutorial mainly explains the related concepts and components of the Marker component. For more detailed configuration and examples of the Marker component, please refer to the Configuration Documentation and Example pages.
Annotation Types
In VChart, according to the positioning and shape of the markers, the Marker data annotation component is divided into the following three types:
MarkPoint Data Annotation Point
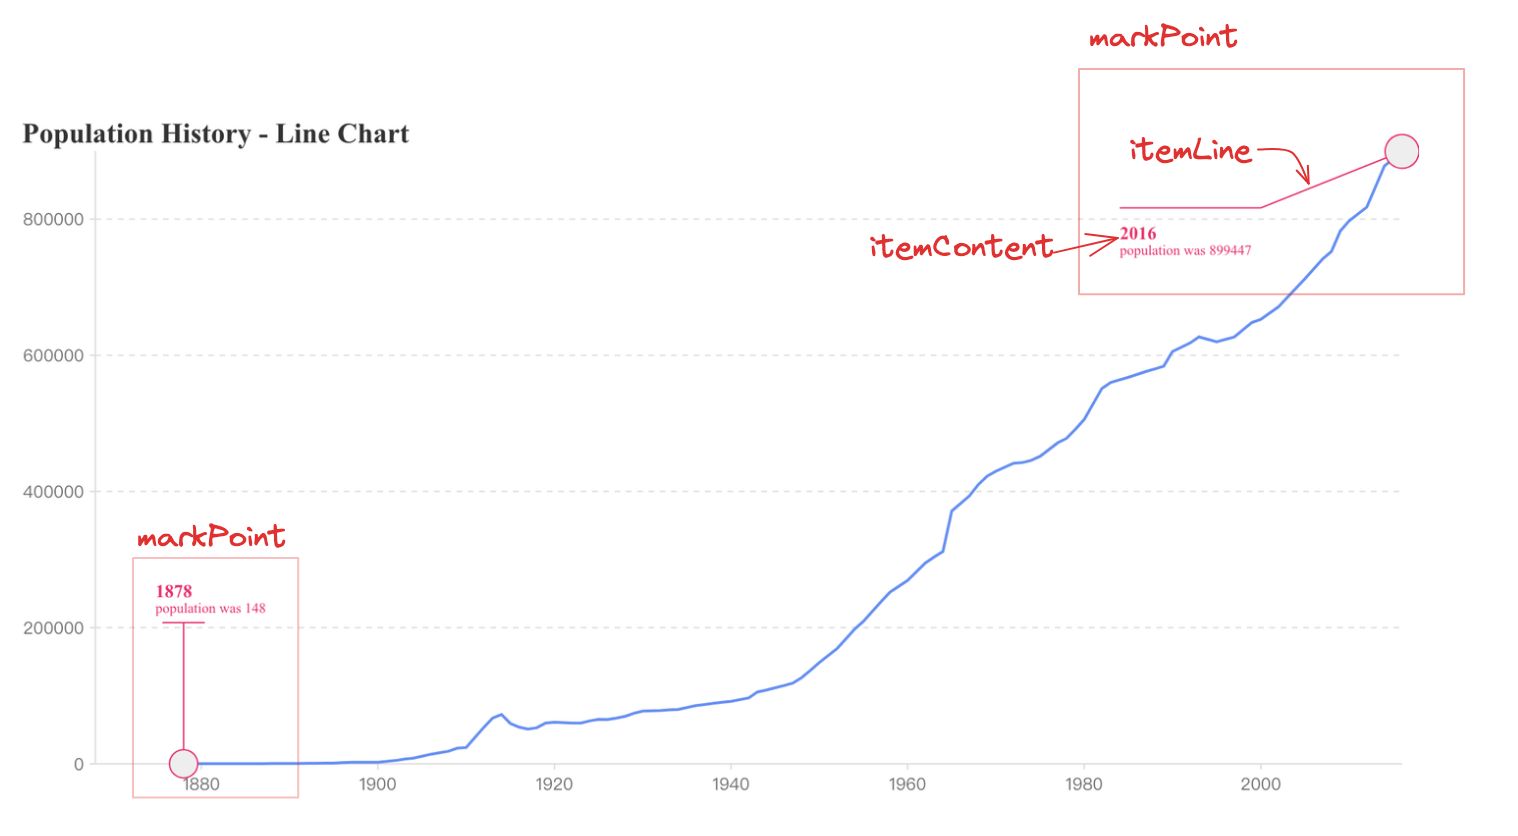
MarkPoint is a data annotation point that can represent the position of a specific data in the chart. By using MarkPoint, users can highlight specific data, making it easier for readers to see the detailed data of that data point.
MarkPoint can be configured through the markPoint attribute:
{
  markPoint: {
    // Configure the position of the annotation point
    coordinate: {
      year: '2016',
      population: 899447
    },
    // Configure the annotation content
    itemContent: {
      type: 'richText',
    },
    itemLine: {
      type: 'type-do',
    }
  }
}
MarkLine Data Annotation Line
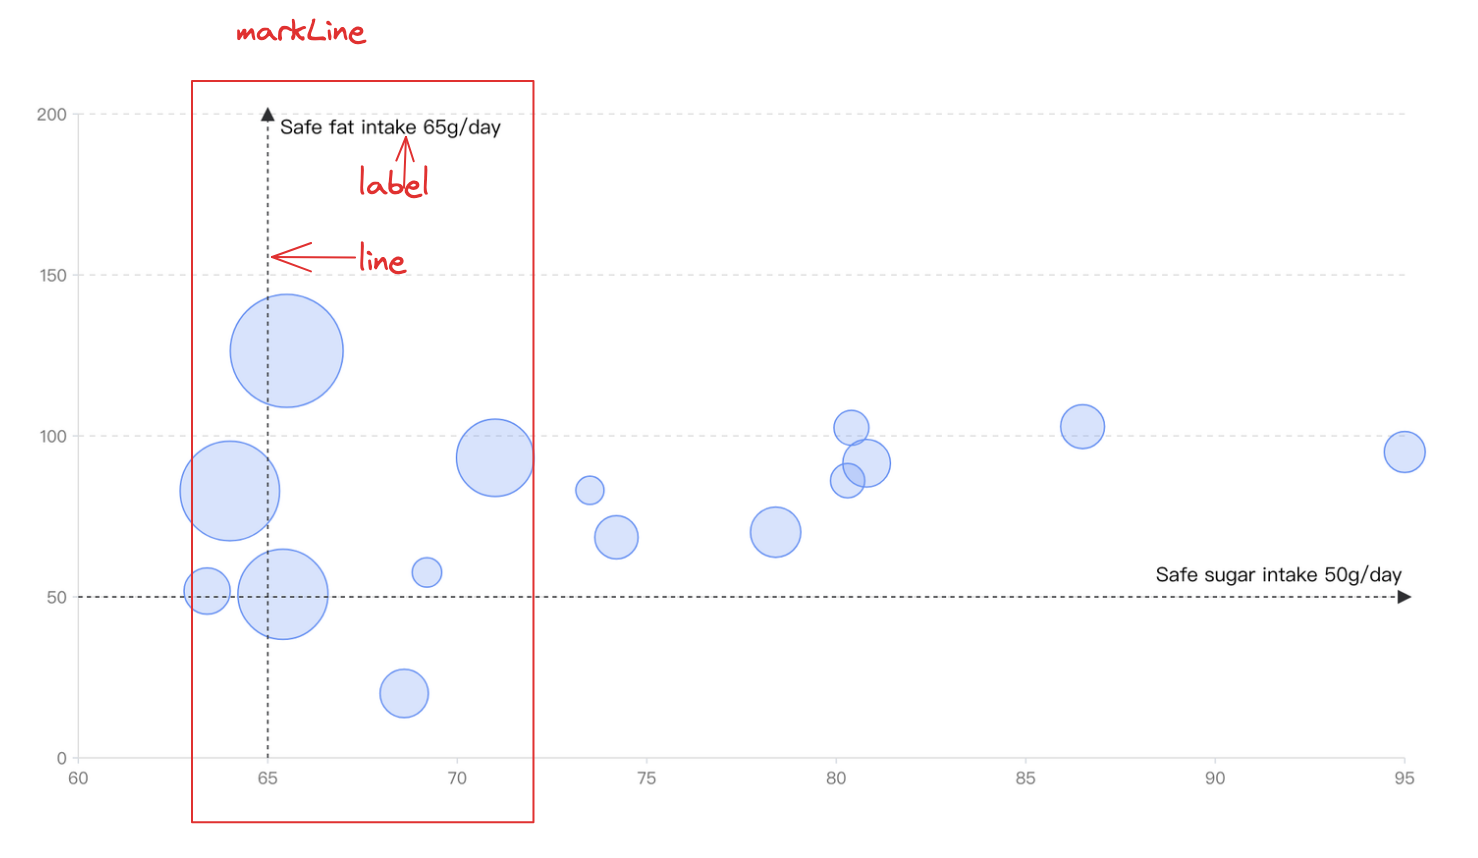
MarkLine is a data annotation line that can represent a specific value's horizontal or vertical position in the chart. By using MarkLine, the data changes near that value are highlighted in the form of a line, helping users to quickly discover patterns in the data.
MarkLine can be configured through the markLine attribute:
{
markPoint: {
x: 50, // Annotation target: Cartesian coordinate system x-axis space. Annotation line on the x-axis// Configure text label: {
text: 'Annotation line',
},
line: {
// Configure line style style: {
lineWidth: 2,
}
}
}
}
Through these two examples, you can learn how to use MarkPoint and MarkLine for data annotation in VChart. Feel free to try VChart to create more feature-rich and visually appealing charts.
MarkArea Data Annotation Area
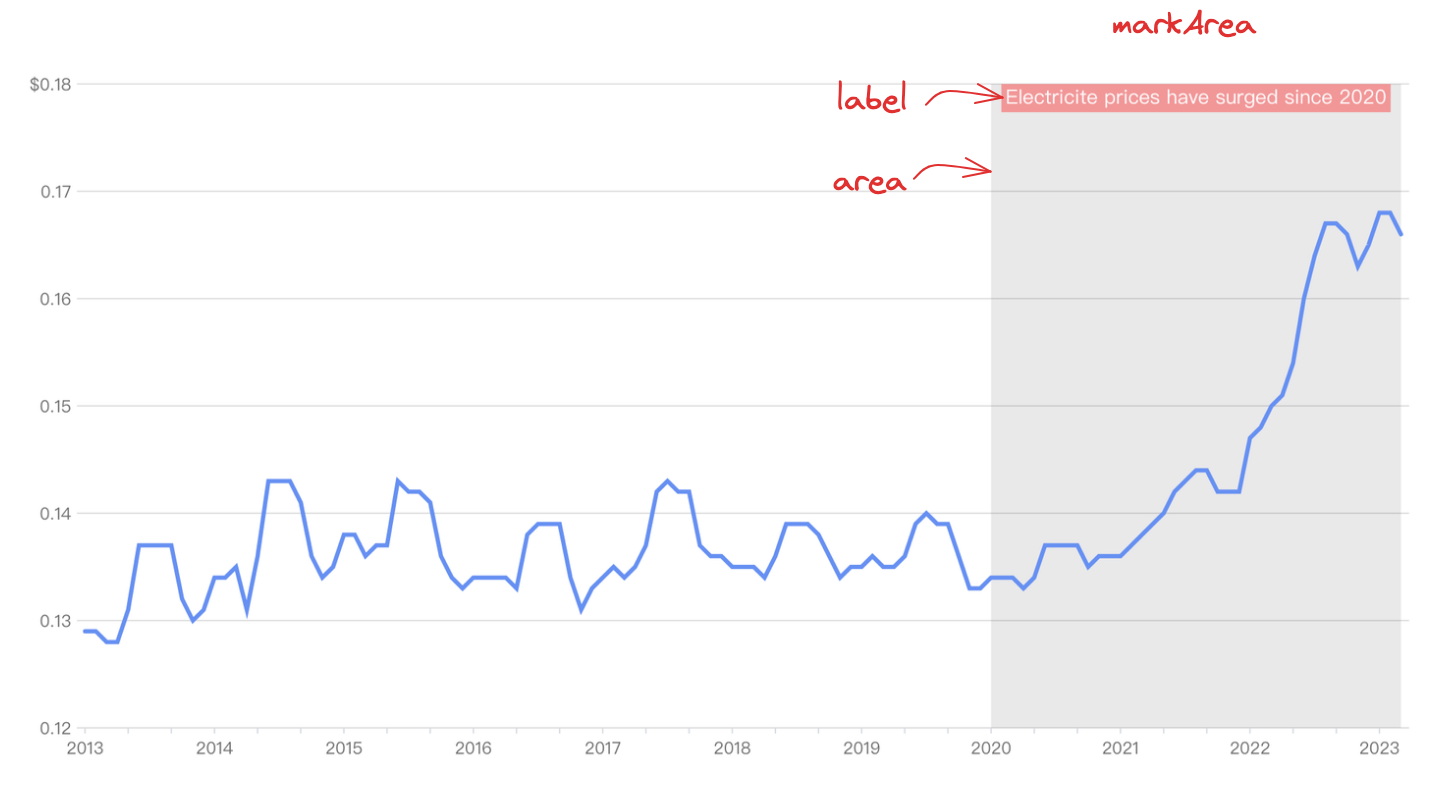
MarkArea is a data annotation area that can annotate a range of data, highlighting the data changes in that range. By using MarkArea, users can get a more intuitive understanding of data distribution and trends.
MarkArea can be configured through the markArea attribute:
{
  markArea: {
    // Declare the coordinates of the four points that make up the annotation area
    coordinates: [
      { x: 0, y: 100 },
      { x: 100, y: 100 },
      { x: 100, y: 0 },
      { x: 0, y: 0 },
    ],
    // Configure text
    label: {
      text: 'Annotation line',
    },
    area: {
      // Configure area style
      style: {
        lineWidth: 2,
      }
    }
  }
}
Examples
For more examples of using the Marker component, please refer to the Marker Examples page.