It is not only a fully functional graph visualization library, but also an explorer of data relationships.
!!!###!!!title=Label Data Labels——VisActor/VChart tutorial documents!!!###!!!!!!###!!!description=When using VChart for chart visualization, it is not only necessary to display various graphic elements, but also to display more detailed information through data labels (Label). Data labels allow users to more intuitively understand and analyze the data points in the chart.VChart supports multiple types of charts, including bar charts, line charts, pie charts, area charts, and scatter plots, etc. Each type of chart can implement data label display and style settings through configuring labels (`label`). In this tutorial, we will introduce in detail how to use data labels in various charts of VChart.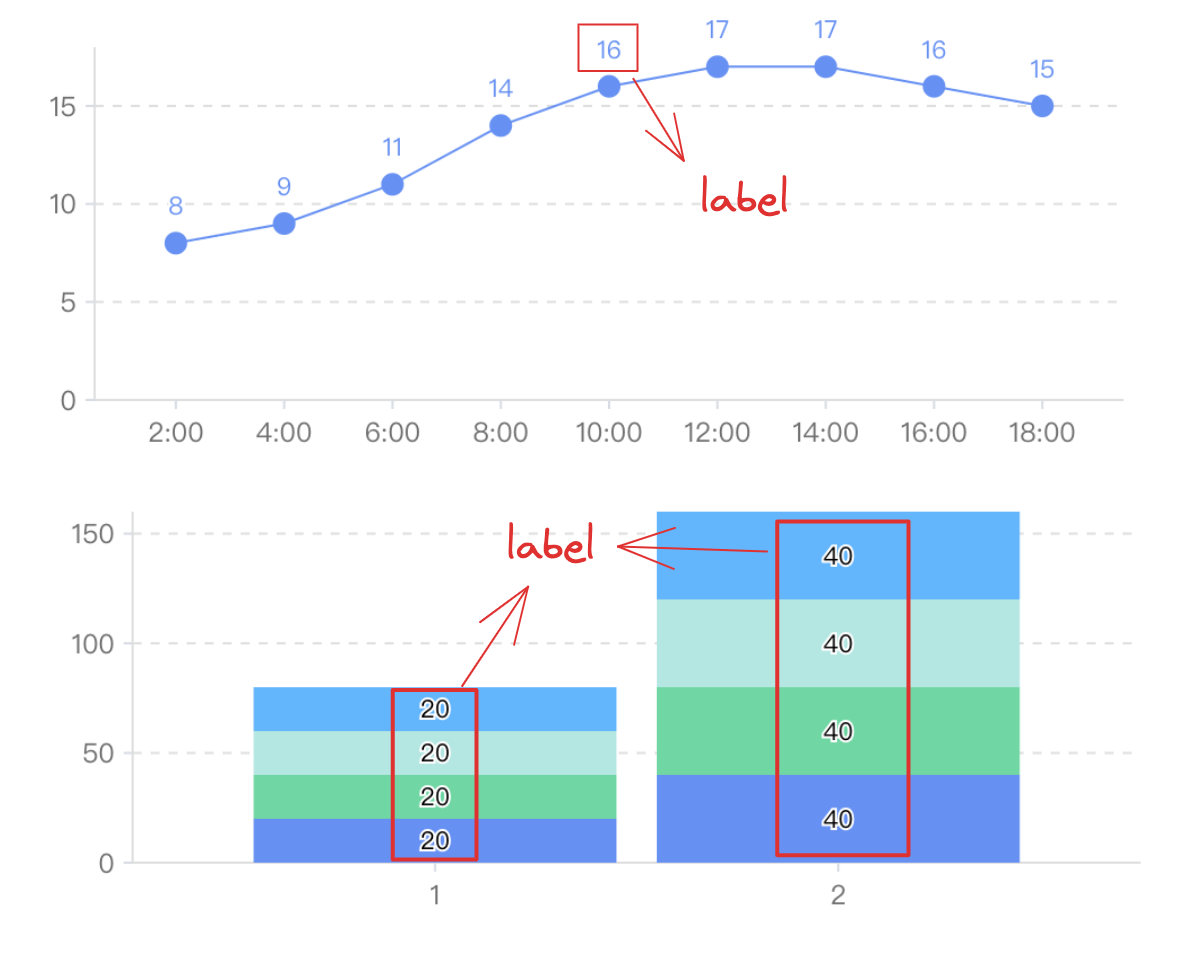!!!###!!!
Label Data Labels
When using VChart for chart visualization, it is not only necessary to display various graphic elements, but also to display more detailed information through data labels (Label). Data labels allow users to more intuitively understand and analyze the data points in the chart.
VChart supports multiple types of charts, including bar charts, line charts, pie charts, area charts, and scatter plots, etc. Each type of chart can implement data label display and style settings through configuring labels (label). In this tutorial, we will introduce in detail how to use data labels in various charts of VChart.
Label Styles
In VChart, the style of data labels can be configured through label.style. Here's an example of setting the data label style for a bar chart:
You can try editing the label styles in the example below:
Similarly, you can set the corresponding data label styles for other types of charts.
Custom Labels
VChart supports configuring label content with custom functions. For example, you can display the number of bar charts in thousands place or add parentheses to pie chart percentages, etc.
Here's an example of using a custom label function to display bar chart values as thousands:
In this example, we added a text property to label.style, which is a JavaScript function. This function takes a parameter datum, which represents the raw data of the data point, and returns the processed label text.
Label Avoidance
In some cases, data labels can experience overlapping issues, especially in data-intensive charts. To solve this problem, VChart supports setting label avoidance strategies in line charts, area charts, bar charts, pie charts, scatter plots, and other charts through configuration options.
{
"label": {
"visible": true,
"overlap": {
// Whether to hide when labels overlap"hideOnHit": false,
"strategy": [{ "type": "position", "position": ["inside-top", "top"] }]
},
// Do not process label avoidance"overlap": false }
}
In this example, we set the following options for the data labels of the scatter plot:
overlap: If set to false, it indicates turning off the label avoidance function.
overlap.hideOnHit: Set not to hide when labels overlap.
overlap.strategy: Set the processing strategy when labels overlap. For detailed strategy configuration, please refer to the configuration documentation
Here's an example of a custom label anti-overlap strategy for a bar chart:
Through this tutorial, you should have already learned how to use data labels in VChart charts. Please continue exploring other features of VChart to create richer and more diverse chart visualization effects.

