It is not only a fully functional graph visualization library, but also an explorer of data relationships.
!!!###!!!title=Candlestick——VisActor/VChart tutorial documents!!!###!!!!!!###!!!description=Candlestick Chart (K-line Chart) is a common chart type in the financial field, used to display price trends over a period of time, including four key price points: open price, high price, low price, and close price.VChart provides a candlestick chart extension component that supports flexible style configuration and interactive features, meeting various financial data visualization needs.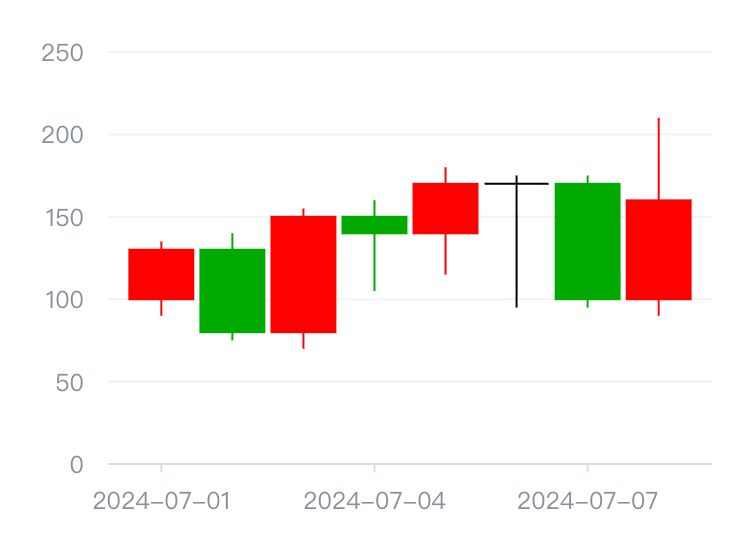!!!###!!!
Extend Chart: Candlestick Chart
Candlestick Chart (K-line Chart) is a common chart type in the financial field, used to display price trends over a period of time, including four key price points: open price, high price, low price, and close price.
VChart provides a candlestick chart extension component that supports flexible style configuration and interactive features, meeting various financial data visualization needs.
How to use extended charts
The candlestick chart needs to be manually registered before use. The registration and usage methods are as follows:
The candlestick chart requires the following data fields to be configured:
xField: Time axis field, used to display the time dimension
openField: Open price field
highField: High price field
lowField: Low price field
closeField: Close price field
Style Configuration
The candlestick chart supports style configuration for three states:
rising: Style configuration for rising state (close price > open price)
falling: Style configuration for falling state (close price < open price)
doji: Style configuration for doji state (close price = open price)
Each state can be configured with the following style properties:
boxWidth: The width of the candlestick box
boxFill: The fill color of the box
stroke: Border color
lineWidth: Border width
Animation Configuration
The candlestick chart has built-in entry and exit animations, and custom animation effects can be configured through animation. The default animations are candlestickScaleIn and candlestickScaleOut.
Best Practices
Data Preparation: Ensure the data contains complete time, open price, high price, low price, and close price fields
Color Configuration: It is recommended to use red for rising and green for falling, in line with domestic market habits
Responsive Design: On small screen devices, boxWidth can be appropriately reduced to avoid candlestick overlap
Combination Charts: Can be combined with volume bar charts to provide a more comprehensive market analysis view

