It is not only a fully functional graph visualization library, but also an explorer of data relationships.
!!!###!!!title=Byte Mini Program——VisActor/VChart tutorial documents!!!###!!!!!!###!!!description=We provide the `@visactor/tt-vchart` chart component library for Byte mini-programs, which can be imported through `npm`.Example project: [examples](https://github.com/VisActor/VChart/tree/main/packages/tt-vchart/gallery) Import using Lark Developer Tools.!!!###!!!
Byte Mini Program
We provide the @visactor/tt-vchart chart component library for Byte mini-programs, which can be imported through npm.
Example project: examples Import using Lark Developer Tools.
Environment Requirements
Byte Mini Program basic library version > 2.34.0
API
The use of the @visactor/tt-vchart chart component is shown below:
canvasId is the id of the chart, consistent with the id of the dom, please make sure id is not repeated.
spec is the core concept of VChart, and the spec of the cross-end components is consistent with the PC end. Chart configuration examples can be found in VChart Chart Examples. For users who are not familiar with VChart, you can refer to the Getting Started with VChart tutorial.
styles is the style of the chart container, which can be used to control chart width, height, and other styles.
events is an array of objects used to register a series of events, defined as follows, specific event names, event filtering configurations, and callback function parameters refer to VChart Event API
interfaceIEvent {
/**
* The name of the event
*/ type: string;
/**
* Event filtering configuration in event API
*/ query?: object;
/**
* Event callback
*/ handler: (event) => void;
}
onChartInit is a callback function called after the chart is initialized. The parameter instance is the instance of the chart, which can be used to register events, themes, etc.
onChartReady is a callback function called after the chart is rendered.
The npm capability is only supported in the basic library version 2.12.0 and above, so developers need to specify the minimum basic library version as 2.12.0 on the Douyin Open Platform Developer Platform to ensure that the applet does not run on a lower version of the basic library. For more information, please read npm Capability.
Use with npm
Step1: Install chart components
Execute the command to install the npm package in the directory where the applet package.json is located:
$ npm install @visactor/tt-vchart
Description
The package.json participating in the npm build needs to be defined within the miniprogramRoot specified in project.config.json. When the miniprogramRoot field does not exist, the miniprogramRoot points to the directory where the project.config.json is located.
The npm dependencies are built based on the dependencies field in package.json. Dependencies in devDependencies can also be installed and used during development but will not be included in the build.
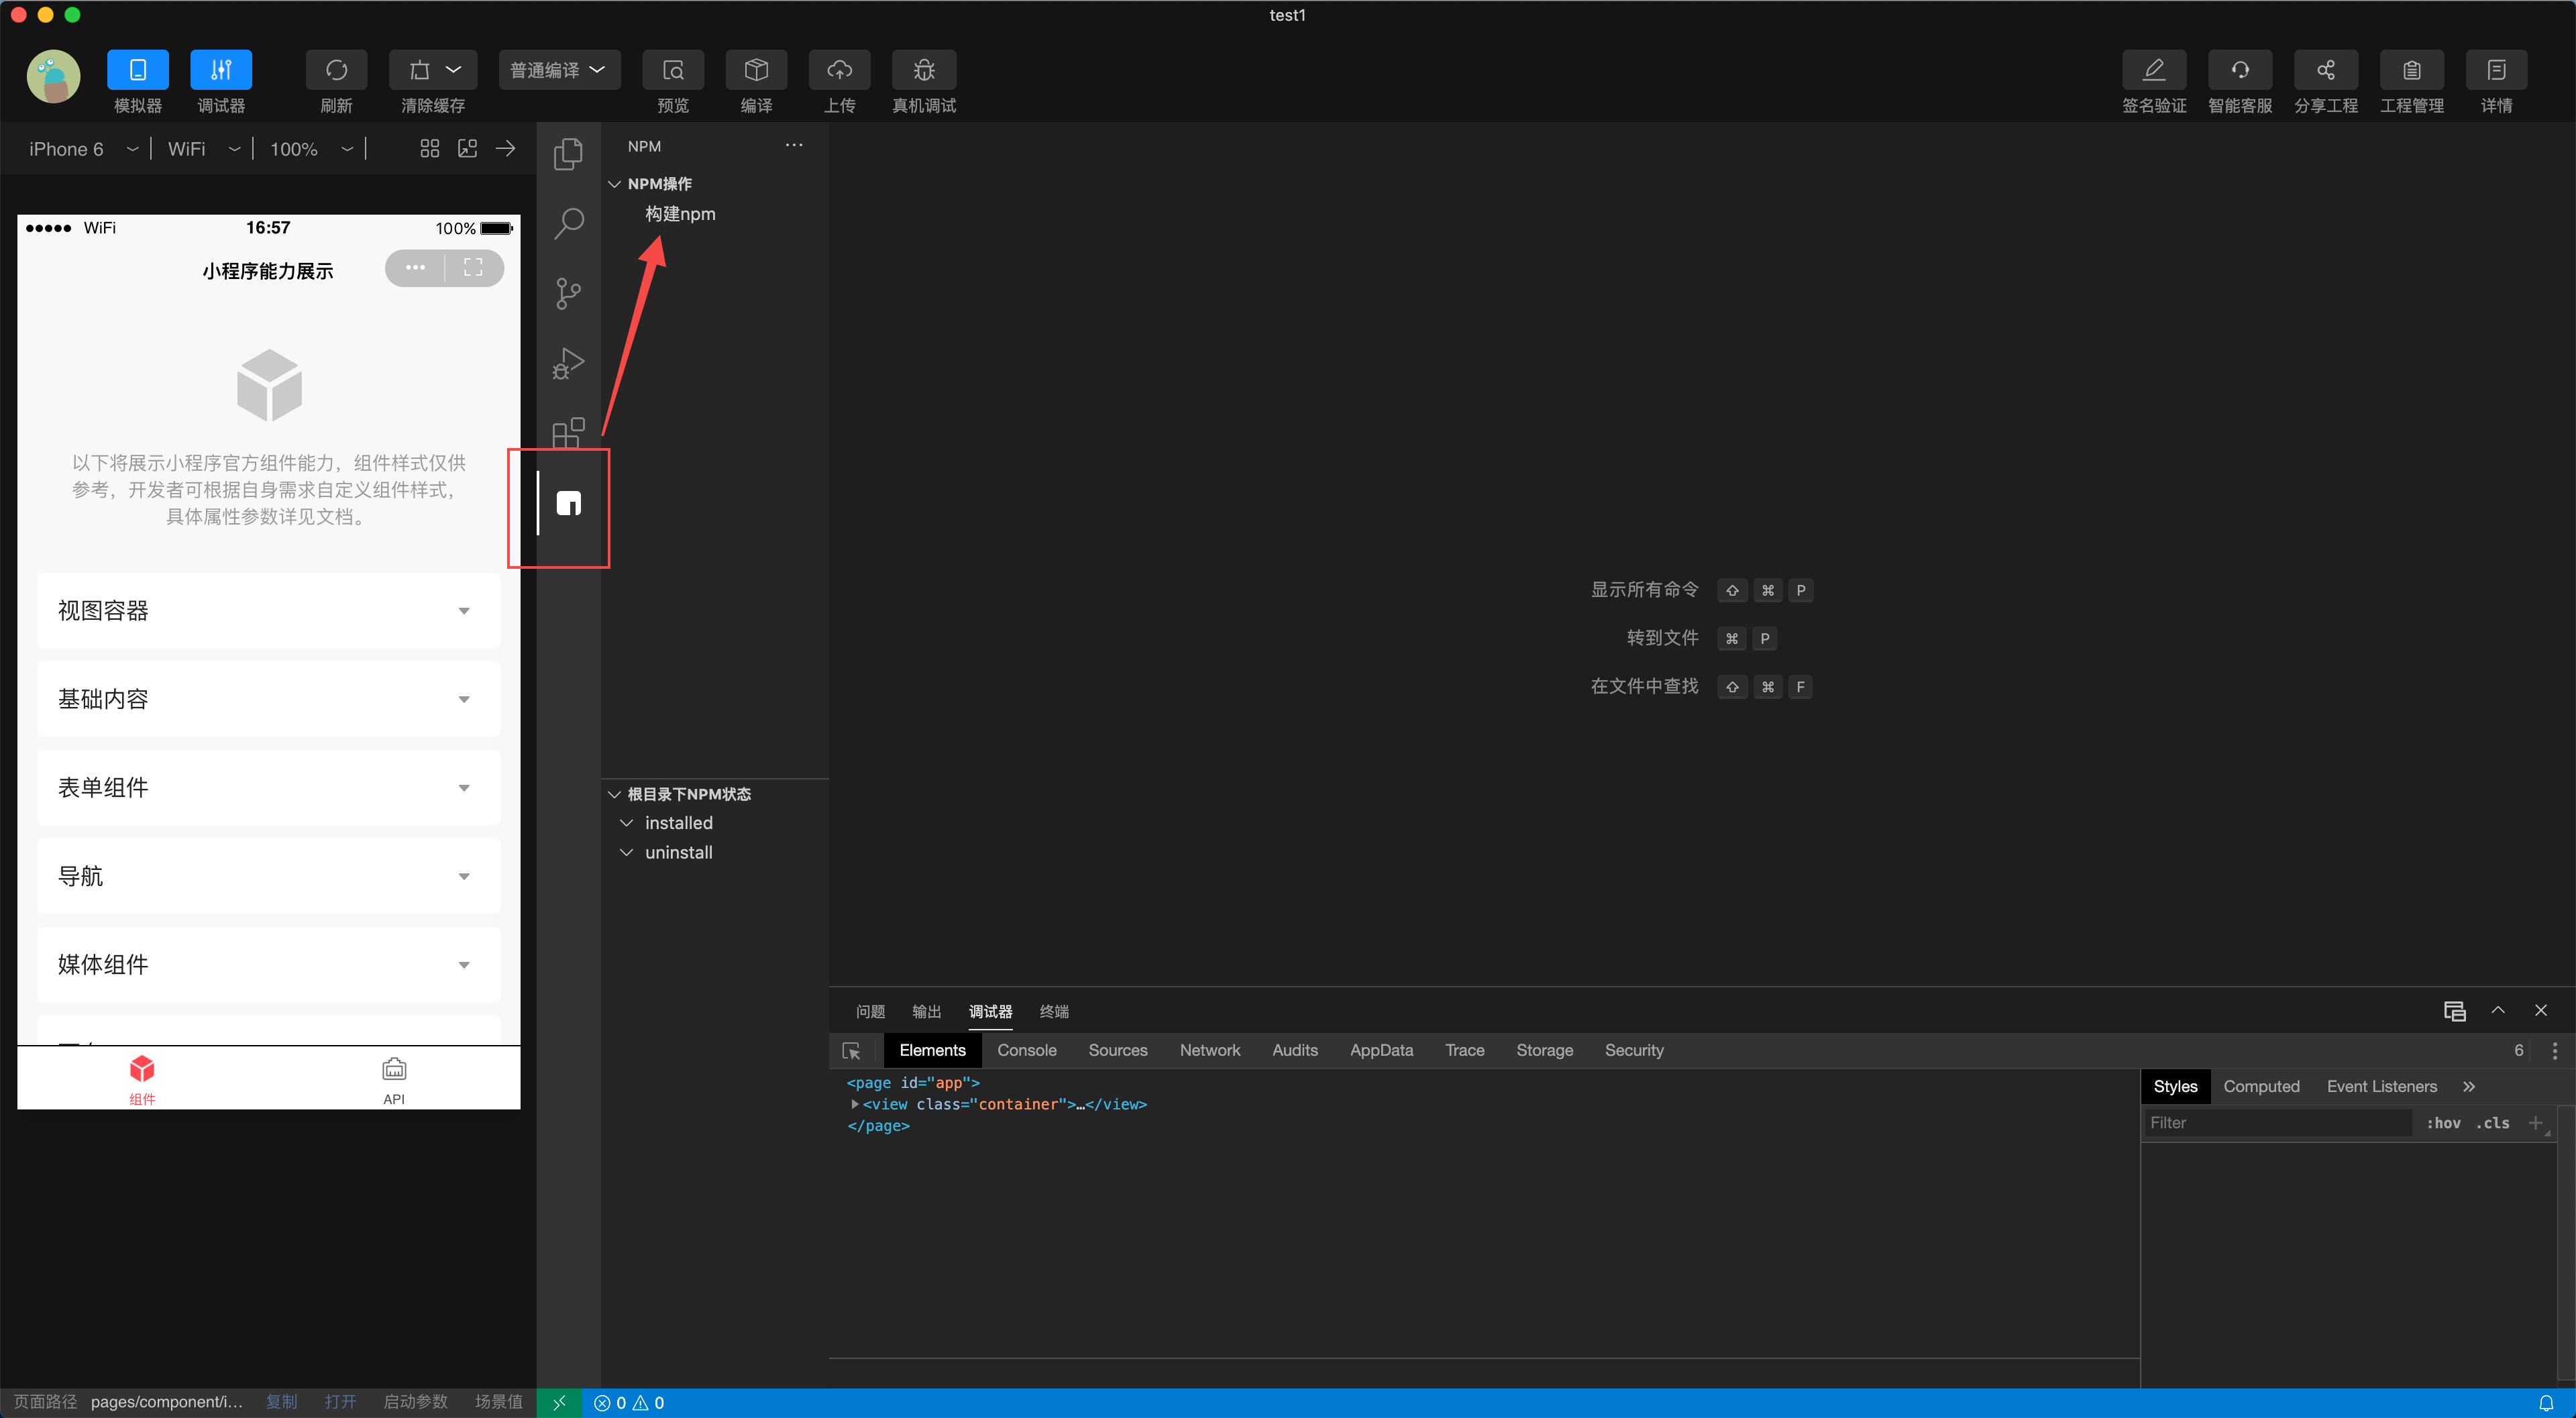
Step2: Build npm
Open the NPM module panel in the editor's "sidebar"
Click the "Build NPM" button
After the build is completed, a miniprogram_npm build file will appear in the project.
ext://@visactor/tt-vchart/index is a special rule for mini-program terminals: to reference custom components through npm, the path reference format needs to be followed: ext://packageName/componentName
In which,
ext:// is the prefix specified by the mini-program
packageName is the npm package name
componentName is the component name
Corresponding to our chart components:
packageName is: @visactor/tt-vchart
componentName is: index (preset by chartspace component library)
For a more detailed description, please refer to: Using npm
Step5: Create Chart
Prepare the following XML structure in index.ttml:
After installing with npm, you can directly copy all files from the @visactor/tt-vchart/src directory to your own project. Set usingComponents yourself.
Feedback
If you encounter any issues during use, please feel free to raise them in GitHub issues. We appreciate your feedback!