
3D Bar/Column Chart
Introduction
The majority of configuration options for 3D bar charts are inherited from 2D area charts. They are enabled by changing the series or chart type from bar to bar3d.
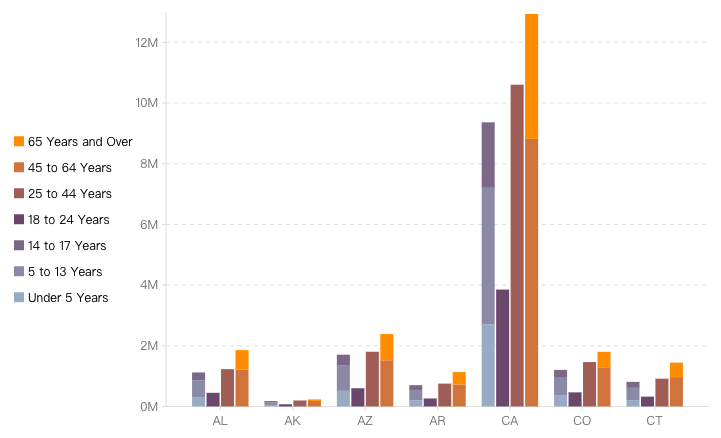
Column charts are based on bar charts with the x-axis and y-axis transposed. The configuration is almost the same as bar charts, except that the x-axis and y-axis configurations need to be swapped, and the direction attribute should be configured as 'horizontal'.
Chart Composition
Bar charts consist of rectangular chart elements, axes, and other components.
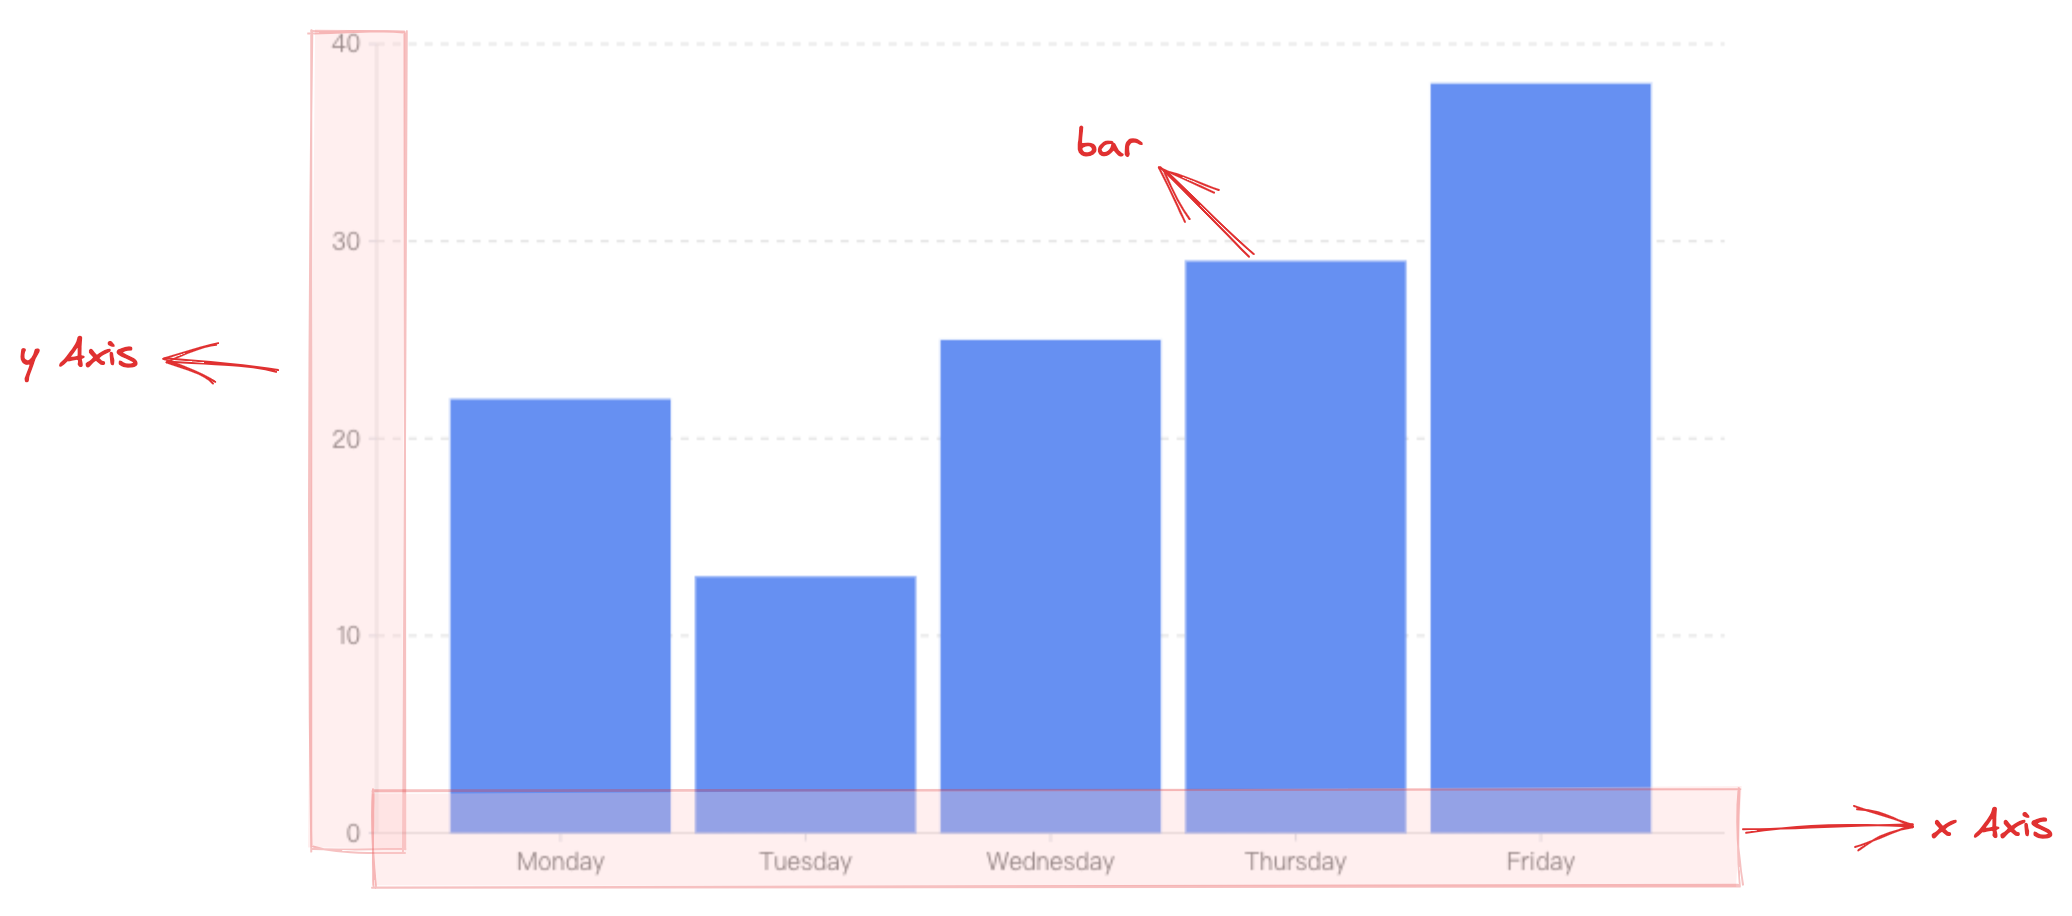
barChart.type: Chart type, the type for bar/column charts is'bar3d'barChart.data: Data source for chart renderingbarChart.xField: Category field, mapping the element's x-coordinate/widthbarChart.yField: Numeric field, mapping the element's height/y-coordinate
Axes, tooltips, and other components, which serve as auxiliary chart display components, are optional configurations with default effects and functionality:
-
barChart.axes: Axis component, displayed by default and automatically inferring coordinate system and data mapping logic based on chart type. For detailed configurations, see VChart Axis Component Configuration -
barChart.tooltip: Tooltip information, displayed by default during interaction, for detailed configurations, see VChart Tooltip Component Configuration -
For more component configurations, see VChart barChart Configuration As a 3D chart, 3D scatter plot needs to enable 3D view, which needs to be configured in the initialization parameters of vchart:
-
options3d.enable: Enable 3D view
Quick Start
For other configurations, refer to