
Introduction to univer-vchart-plugin
About Univer
Univer is an open-source alternative to the Office suite, including spreadsheets, documents, and presentations. It currently offers features such as formulas, number formatting, conditional formatting, data validation, and text-image mixing. You can integrate Univer into your system and develop personalized business requirements based on Univer.
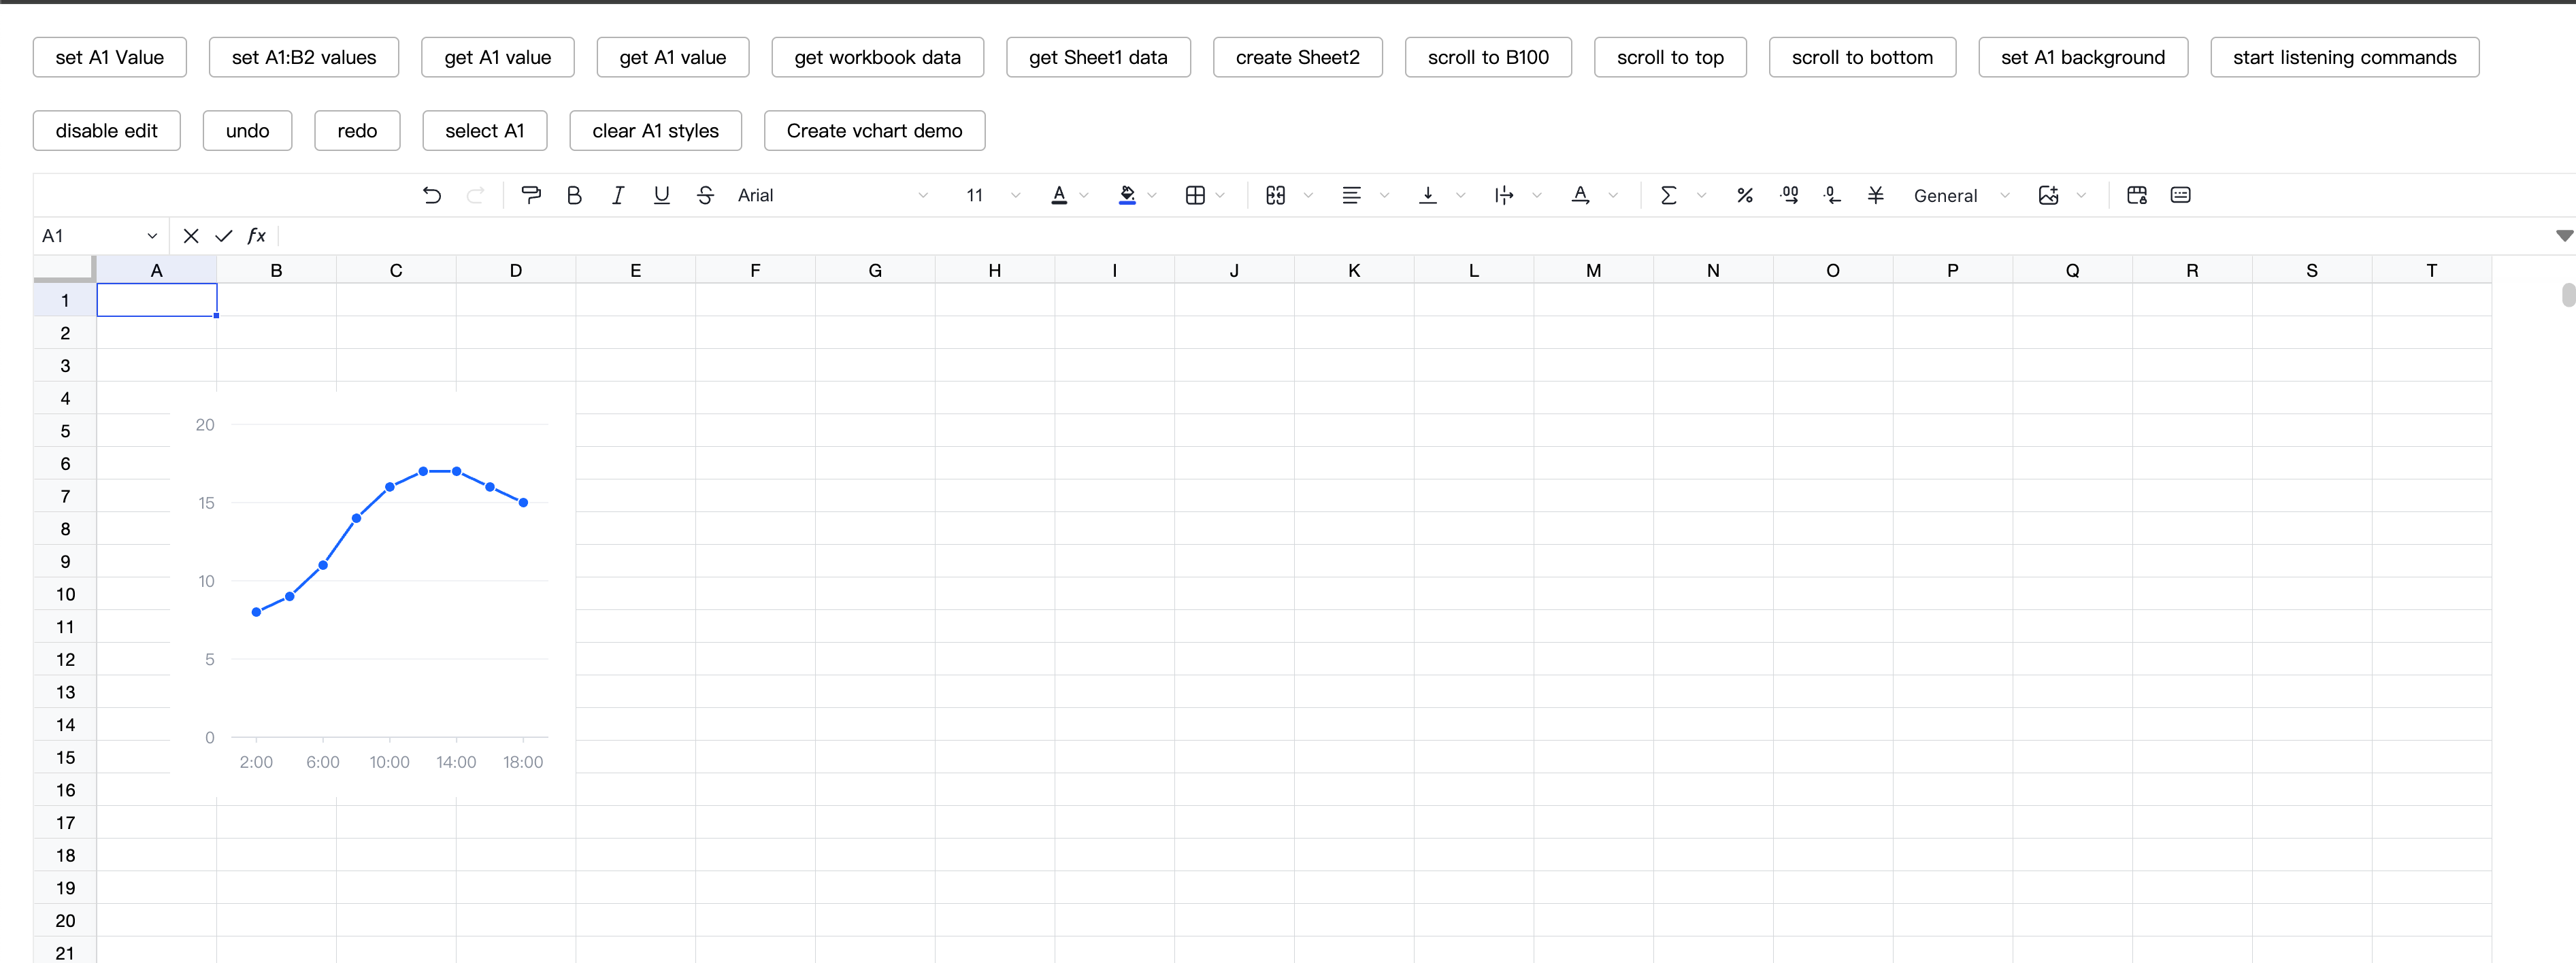
univer-vchart-plugin is a plugin encapsulated based on Univer, allowing you to quickly insert vchart charts into Univer.
Quick Start
Installation
# Install using npm
npm install @visactor/univer-vchart-plugin

# Install using yarn
yarn add @visactor/univer-vchart-plugin
Usage
- Register the plugin
import { UniverVChartPlugin } from '@visactor/univer-vchart-plugin';

export function setupUniver() {
  const univer = new Univer({
    theme: defaultTheme,
    locale: LocaleType.EN_US,
    locales: {
      [LocaleType.EN_US]: enUS
    }
  });
  univer.registerPlugin(UniverVChartPlugin);
}
- Create a vchart chart, example as follows:
import { CREATE_VCHART_COMMAND_ID } from '@visactor/univer-vchart-plugin';
...

await univerAPI.executeCommand(CREATE_VCHART_COMMAND_ID, {
      spec: { ... },
    });
The following parameters are supported when creating a vchart chart:
/**
 * the params of create a vchart instance
 *
 * @param spec spec of vchart
 * @param options options of vchart
 * @param initPosition ths position of vchart layer
 */
export interface CreateVChartParams {
  spec: ISpec;
  options?: Omit<IInitOption, 'dom' | 'renderCanvas'>;
  initPosition?: {
    startX?: number;
    startY?: number;
    endX?: number;
    endY?: number;
  };
}
A Simple Chart Example
import { UniverVChartPlugin, CREATE_VCHART_COMMAND_ID } from '@visactor/univer-vchart-plugin';

export function setupUniver() {
  const univer = new Univer({
    theme: defaultTheme,
    locale: LocaleType.EN_US,
    locales: {
      [LocaleType.EN_US]: enUS
    }
  });
  univer.registerPlugin(UniverVChartPlugin);
}

export function setupVChartDemo($toolbar: HTMLElement, univerAPI: FUniver) {
  const $button = document.createElement('a');
  $button.textContent = 'Create vchart demo';
  $toolbar.appendChild($button);

  $button.addEventListener('click', async () => {
    if (!univerAPI) throw new Error('univerAPI is not defined');

    const activeWorkbook = univerAPI.getActiveWorkbook();
    if (!activeWorkbook) throw new Error('activeWorkbook is not defined');
    const activeSheet = activeWorkbook.getActiveSheet();
    if (!activeSheet) throw new Error('activeSheet is not defined');

    await univerAPI.executeCommand(CREATE_VCHART_COMMAND_ID, {
      spec: {
        type: 'line',
        data: {
          values: [
            {
              time: '2:00',
              value: 8
            },
            {
              time: '4:00',
              value: 9
            },
            {
              time: '6:00',
              value: 11
            },
            {
              time: '8:00',
              value: 14
            },
            {
              time: '10:00',
              value: 16
            },
            {
              time: '12:00',
              value: 17
            },
            {
              time: '14:00',
              value: 17
            },
            {
              time: '16:00',
              value: 16
            },
            {
              time: '18:00',
              value: 15
            }
          ]
        },
        xField: 'time',
        yField: 'value'
      }
    });
  });
}
[View the online demo](https://stackblitz.com/~/github.com/xile611/univer-vchart-plugin-demo)