Pie chart, also known as a pie chart, is a circular statistical chart divided into several sectors to describe the relative relationship between quantities, frequencies or percentages. In a pie chart, the size of the arc length (as well as the central angle and area) of each sector represents the proportion of the quantity it represents. These sectors together form a complete circle.
A donut chart is formed by adding the innerRadius and outerRadius attributes to the base of the pie chart to adjust the inner and outer radii of the specified sectors.
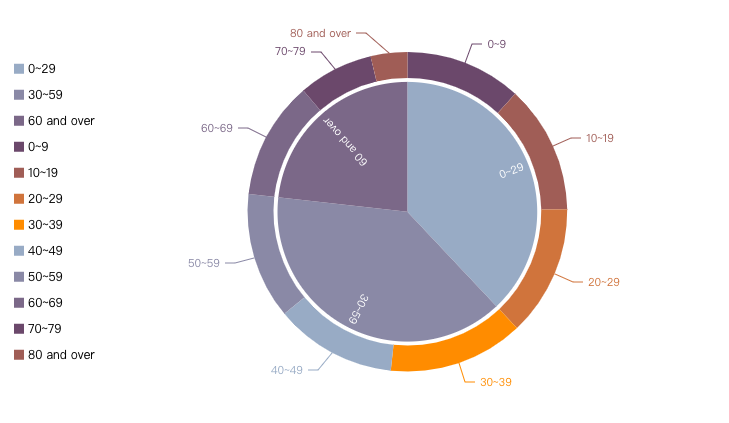
In VChart, you can display the relative relationships of multiple data through the Pie/Donut Chart Configuration. The following chart shows the distribution of the U.S. population by age in 2021 using a combination of a pie chart and donut chart:
The categoryField and valueField attributes are used to specify the pie chart category and sector angle fields, respectively
The innerRadius and outerRadius attributes are used to specify the inner and outer radii of the sector.
Chart composition
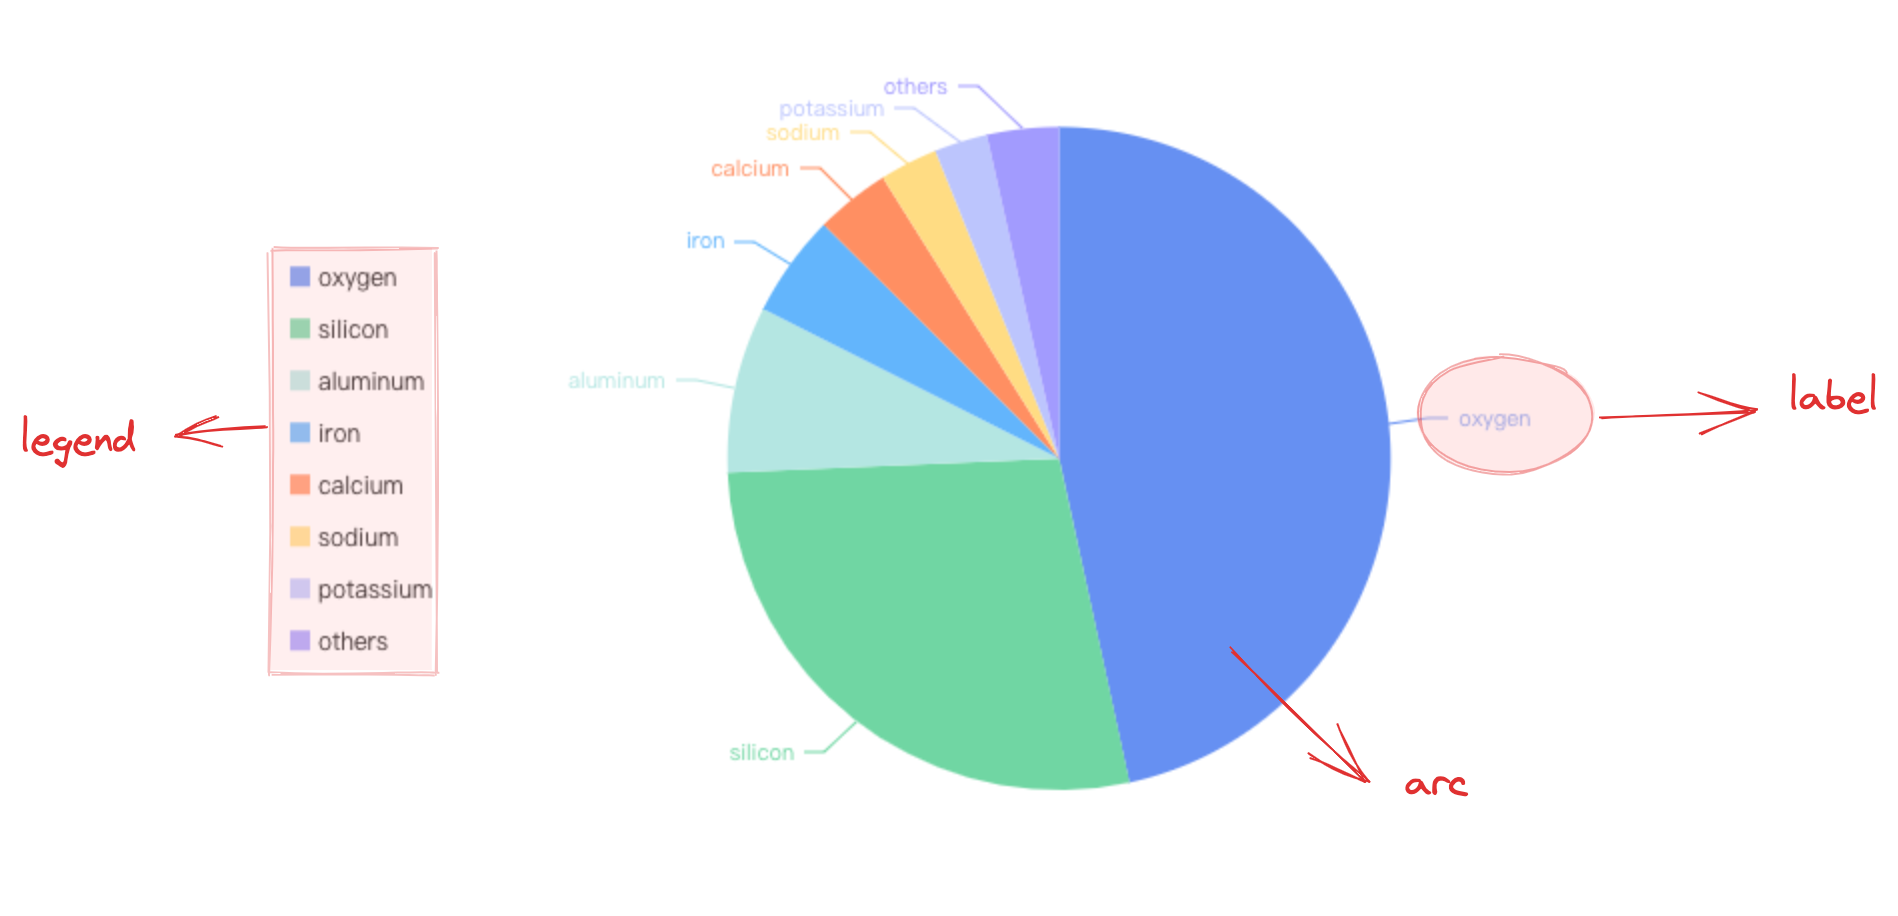
Pie charts are made up of sector primitives, labels, and legends, among other components.
Sector primitives are the basic elements of pie/donut charts, and related drawing configurations are essential:
pieChart.type: chart type, pie/donut chart type is 'pie'
pieChart.data: data source for chart drawing
pieChart.categoryField: category field, mapping the sector category of the graphic element
pieChart.valueField: value field, mapping the sector angle of the graphic element
pieChart.seriesField: category field, mapping the sector color of the graphic element
Indicator cards, tooltips, and other components that assist the chart in displaying are optional configurations with default effects and functionality:
pieChart.indicator: Indicator card component, located at the heart of the pie chart, used to display total data or the data of a specific sector during interaction. See the detailed configuration of VChart Indicator Card Component Configuration
pieChart.tooltip: Tooltip information, displayed by default during interaction. See the detailed configuration of VChart Tooltip Component Configuration
Since there is no explicit axis, pie charts often rely on label components to display the different data categories represented by different sectors. Pie chart labels are usually made up of guide lines and label content. To avoid label overlap, VChart provides an excellent adaptive layout solution.
Donut Chart Indicator Card
In donut charts, indicator cards are often used to display total data or data from a specific sector during interaction.
Graphic Elements and Styles
Texture Filling
By configuring the pieChart.pie.style.texture attribute, you can configure the texture fill for graphic elements. This configuration applies to all graphic elements. For details, see Graphic Element Texture Configuration
Keyword
Type
Description
Default Value
texture
TextureType | string
Texture of arc graphic element
textureColor
string
Color of the texture for the arc graphic element
textureSize
number
Size of the texture for arc graphic element
texturePadding
number
Size of the gap between textures for arc graphic element